Get Data
Summary:
This data set contains two ASCII files (.txt format). One file contains monthly above-ground biomass data (total live biomass plus dead matter) for May 1956 to February 1958 for an annually burned, humid derived savanna in the Olokemeji Forest Reserve, Nigeria (7.42 N, 3.55 E) . This file also contains single measurements of above-ground biomass for years 1963 and 1964, single measurements of above-ground biomass at a nearby area for years 1960 and 1964, a single measurement of peak herbaceous leaf area index (LAI) for 1963, and a single measurement of peak tree/shrub LAI for 1964. Harvest procedures were used to measure biomass. LAI was determined by direct measurements.
The second file contains climate data (precipitation amount and maximum/minimum temperature) from a weather station at the study site for the period 1956/01/01 through 1964/12/31.
Annual above-ground net primary production (ANPP) estimates presented here are the sum of the increase in above-ground plant matter accumulation (total live biomass plus dead matter). ANPP of the herbaceous layer was estimated in 1957 to be around 680 g/m2/yr based on peak total clipped matter.
Revision Notes: Only the documentation for this data set has been modified. The data files have been checked for accuracy and are identical to those originally published in 1997.
Additional Documentation:
The Net Primary Productivity (NPP) data collection contains field measurements of biomass, estimated NPP, and climate data for terrestrial grassland, tropical forest, temperate forest, boreal forest, and tundra sites worldwide. Data were compiled from the published literature for intensively studied and well-documented individual field sites and from a number of previously compiled multi-site, multi-biome data sets of georeferenced NPP estimates. The principal compilation effort (Olson et al., 2001) was sponsored by NASA Terrestrial Ecology Program. For more information, please visit the NPP web site at http://daac.ornl.gov/NPP/npp_home.html.
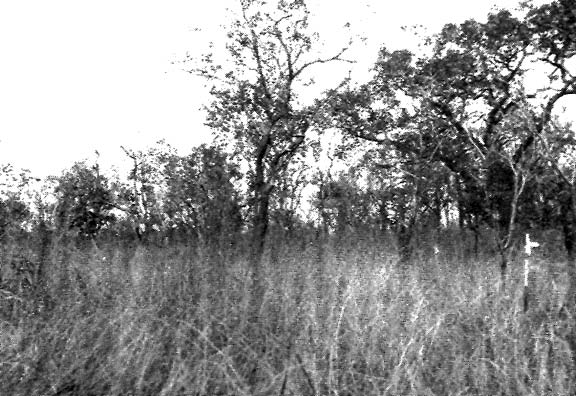
Figure 1. Approximate north-western view of the Olokemeji grassland site, Nigeria. (Butyrospermum paradoxum tree in center of picture in background; south-east corner of site marked by flagstaff on right of picture in foreground. Photograph taken 27th January 1958, about five days before burning, mid-dry season, by Dr. B. Hopkins, Chichester, U.K.). Reproduced by kind permission of the Journal of Ecology and the British Ecological Society.
Data Citation:
Cite this data set as follows:
Hopkins, B. 2014. NPP Grassland: Olokemeji, Nigeria, 1956-1964, R1. Data set. Available on-line [http://daac.ornl.gov] from Oak Ridge National Laboratory Distributed Active Archive Center, Oak Ridge, Tennessee, USA. doi:10.3334/ORNLDAAC/195
This data set was originally published as:
Hopkins, B. 1997. NPP Grassland: Olokemeji, Nigeria, 1956-1964. Data set.
Available on-line [http://daac.ornl.gov] from Oak Ridge National Laboratory
Distributed Active Archive Center, Oak Ridge, Tennessee, U.S.A.
Table of Contents:
- 1 Data Set Overview
- 2 Data Description
- 3 Applications and Derivation
- 4 Quality Assessment
- 5 Acquisition Materials and Methods
- 6 Data Access
- 7 References
1. Data Set Overview:
Project: Net Primary Productivity (NPP)
The ecology and productivity of a humid derived savanna in the Olokemeji Forest Reserve, Nigeria (7.42 N, 3.55 E), was studied between 1956 and 1964. The Olokemeji study site is operated in collaboration between the University of Ibadan, the Federal Department of Forest Research, Ibadan, and the Western Region Forestry Department, Ibadan, Nigeria.
The 50-m x 50-m wooded grassland study site is situated within the 7,100-hectare Olokemeji Forest Reserve about 40-km west of Ibadan at the boundary between the derived savanna and forest zones, 110-km north of the coast of southwestern Nigeria. The savanna part of the Olokemeji Reserve is characterized by annual burning during the dry season (November - February). Prior to 1900, the area was subject to bush fallow cultivation of cassava, yams, and maize with many villages around it and a great proportion of open grassland beyond. After reservation in 1899, agricultural activity within the reserve declined except near Olokemeji village and as a part of forest-planting operations. No agricultural activity took place near the study site after 1940.
Monthly dynamics of above-ground live biomass and dead matter were monitored by harvest procedures from 1956 to 1958, then once annually in 1963 and 1964. Single measurements of peak leaf area index (LAI) were made in 1963 and 1964 and of above-ground biomass at a nearby area in 1960 and 1964.
The NPP measurement presented here is sum of the increase in above-ground plant matter accumulation (total live biomass plus dead matter). Annual ANPP of the herbaceous layer was estimated in 1957 to be 680 g/m2/yr based on peak total clipped matter (Esser, 2013; Hopkins, 1968; Scurlock and Olson, 2013). This equates to 310-320 gC/m2/yr depending on the conversion factor used (0.45 or 0.475, respectively) (Olson et al., 2013a; b).
In addition to data on above-ground production, information is available in the literature on burning temperatures (above 540 C at ground level, estimated with heat-sensitive paints) and amount of matter consumed by fire (mean = 84% of herb layer).
2. Data Description:
Spatial Coverage
Site: Olokemeji, Nigeria
Site Boundaries: (All latitude and longitude given in decimal degrees)
| Site (Region) | Westernmost Longitude | Easternmost Longitude | Northernmost Latitude | Southernmost Latitude | Elevation (m) |
|---|---|---|---|---|---|
| Olokemeji, Nigeria | 3.55 | 3.55 | 7.42 | 7.42 | 100 |
Spatial Resolution
The study area is 50 m x 50 m. Harvest plots were 0.25 m2 in size in the primary research area. A contiguous grid of 1,600 above-ground biomass quadrats, each 0.5 m2, was analyzed in a nearby area on similar plots to the southeast of the primary research area. LAI was determined by direct measurements from twenty-five approximately random quadrats of area 0.25 m2.
Temporal Coverage
Above-ground biomass measurements were made in the primary research area from 1956/01/31 through 1958/02/02, on 1963/09/29, and on 1964/11/29. Above-ground biomass measurements were made in a nearby area on similar plots on 1960/05/01 and 1964/12/04. LAI measurements were made on 1963/09/29 (herbaceous layer at the primary research site) and 1964/11/29 (tree/shrub layer near the primary research site). Climate data are available from 1956/01/01 through 1964/12/31.
Temporal Resolution
Above-ground biomass measurements were made at the primary research site approximately monthly from 1956 to 1958, then once annually in 1963 and 1964. Single measurements of above-ground biomass measurements were made in a nearby area in 1963 and 1964. No biomass measurements were made in 1959 and 1962. All biomass estimates are based on plant dry matter accumulation, expressed as g/m2.
Single measurements of peak LAI were made in 1963 at the primary research site and in 1964 nearby and are expressed as m2/m2.
Climate data are expressed as monthly and annual precipitation amounts (mm) and monthly and annual average maximum/minimum temperature (degrees C) for the 1956-1964 period.
Data File Information
Table 1. Data files in this data set archive
| FILE NAME | TEMPORAL COVERAGE | FILE CONTENTS |
|---|---|---|
| olk_npp.txt | 1956/01/31 - 1964/11/29 | Above-ground biomass and LAI data for a humid derived savanna at Olokemeji, Nigeria |
| olk_cli.txt | 1956/01/01-1964/12/31 | Climate data for a humid derived savanna at Olokemeji, Nigeria |
NPP Data. Above-ground biomass and LAI estimates for the Olokemeji site are provided in one ASCII file (.txt format). The first 18 lines are metadata; data records begin on line 19. The variable values are delimited by semicolons. The values -9.9 and -999.9 are used to denote missing values. Biomass units are g/m2 (dry matter weight) and LAI units are m2/m2. Above-ground biomass data for 1960/05/01 and 1964/12/04 come from a nearby area on very similar plots; these data are labeled in the data file as treatment "burned2".
Table 2. Column headings in NPP file
| COLUMN HEADING | DEFINITION | UNITS |
|---|---|---|
| Site | Site where data were gathered (code refers to site identification) | Text |
| Treatmt | Long term management of site (code refers to treatment described in metadata in data file; number refers to study site) | |
| Year | Year in which data were collected | Numeric |
| Mn | Month in which data were collected | |
| Dy | Day on which data were collected | |
| Tyear | Date in decimal year (year plus the Julian date divided by 365) | |
| AGtotclip | Monthly above-ground plant matter (total live biomass plus dead matter) | g/m2 |
| LAI_herb | Leaf Area Index (LAI) of herbaceous vegetation | m2/m2 |
| LAI_treeshrub | LAI of trees and shrubs on the savanna |
Note: All data values are from Hopkins (1968).
Sample NPP Data Record
| Site;Treatmt;Year;Mn;Dy;Tyear; AGtotclip [units g/m2]; LAI_herb; LAI_treeshrub [units m2/m2) olk;burned ;1956;01;31;1956.085; 0.0; -9.99; -9.99 olk;burned ;1956;03;28;1956.238; 75.6; -9.99; -9.99 olk;burned ;1956;04;30;1956.323; 154.8; -9.99; -9.99 ... |
Climate Data.The climate data set is an ASCII file (.txt format). The first 18 lines are metadata; data records begin on line 19. The variable values are delimited by semicolons. The values -99.9 and -999.9 are used to denote missing values.
| COLUMN HEADINGS | DEFINITION |
|---|---|
| Site | Unique 3-character code for each site based on the first three consonants in the site name (e.g., olk for Olokemeji) |
| Temp (Temporal) |
Indicates whether the values in that row are either long-term (i.e, mulit-year) or annual data for the specified parameter. For multi-year, the values are: mean=mean values (monthly and annual) calculated for the years of data as noted in the documentation numb=number of years of data included in a reported mean value stdv=standard deviation of a mean value Annual data: 19XX=monthly and annual parameter values for the specified year (e.g., 1972) |
| Parm | Parameter, indicates the meteorological data reported in that row. prec-total precipitation for the month or year tmax=maximum temperature for the month or year reported in degrees C tmin=minimum temperature for the month or year reported in degrees C |
|
Description of specific Temp and Parm data values: Long-term data: site;mean;prec; Multi-year mean of total precipitation for each month [Jan, Feb, Mar, …, Dec] and mean of total annual precipitation across all years [Year] (mm) site;mean;tmax; Multi-year mean of maximum temperature for each month [Jan, Feb, Mar, …, Dec] and mean of annual maximum temperature across all years [Year] (C) site;mean;tmin; Multi-year mean of minimum temperature for each month [Jan, Feb, Mar, …, Dec] and mean of annual minimum temperature across all years [Year] (C) … site; numb and stdv; repeat for prec, tmax, and tmin; Annual data: site;19XX;prec; Total precipitation for each month [Jan, Feb, Mar,.....Dec] and total precipitation for the year 19XX [Year] (mm) site;19XX;tmax; Maximum temperature for each month [Jan, Feb, Mar,.....Dec] and maximum for the year 19XX [Year] (C) site;19XX;tmin; Minimum temperature for each month [Jan, Feb, Mar,.....Dec] and minimum for the year 19XX [Year] (C) … site;19XX;(prec, tmax, and tmin); repeat for reported years. Annual data missing value note: If a monthly parm value is missing, the parm value for [Year] is also set to missing (-999.9). |
Sample Climate Data Record
| Site;Temp;Parm; Jan; Feb; Mar; Apr; May; Jun; Jul; Aug; Sep; Oct; Nov; Dec; Year OLK;aver;prec;-99.9;-99.9;-99.9;-99.9;-99.9;-99.9;-99.9;-99.9;-99.9;-99.9;-99.9;-99.9;1232.0 OLK;aver;tmin; 19.3; 22.3; 23.0; 22.5; 21.6; 21.8; 21.4; 20.9; 21.4; 21.4; 22.3; 20.5;-999.9 OLK;aver;tmax; 34.1; 35.7; 35.0; 33.0; 32.0; 30.5; 28.9; 28.4; 29.8; 31.4; 33.0; 33.6;-999.9 OLK;mean;prec; 1.3; 20.9;108.7;112.7;133.3;207.1;179.9;116.0;160.7;149.9; 56.6; 7.6;1254.7 OLK;mean;tmax;-99.9;-99.9;-99.9;-99.9;-99.9;-99.9;-99.9;-99.9;-99.9;-99.9;-99.9;-99.9; -99.9 ... Where, Temp (temporal) - specific year or long-term statistic: mean = mean based on all years numb = number of years stdv = standard deviation based on all years Parm (parameter): prec = precipitation for month or year (mm) tmax = mean maximum temperature for month or year (C) tmin = mean minimum temperature for month or year (C) |
3. Data Application and Derivation:
The accumulation of biomass, or NPP, is the net gain of carbon by photosynthesis that remains after plant respiration. While there are many fates for this carbon, this data set accounts for accumulation of above-ground plant matter (total live biomass plus dead matter). These are considered the major components of NPP.
The main objective of this study was to assess seasonal variation and response of the two main vegetation types (moist semideciduous forest and derived savanna woodland) within the study area. The aim was to elucidate the general trend of these seasonal changes. The savanna's response to annual burning was also studied.
The grassland monthly biomass dynamics data for the Olokemeji savanna site are provided for comparison with models and estimation of NPP. Climate data are provided for use in driving ecosystem/NPP models.
4. Quality Assessment:
At the time of this study, there were few published data for comparison with this study. Hopkins (1968) describes a few similar studies in other African savannas. The values obtained at Olokemeji are within the expected range for African savannsa with about 1,200 mm of rainfall per year.
5. Data Acquisition Materials and Methods:
Site Information
The study site is located within the 7,100-hectare Olokemeji Forest Reserve about 40-km west of Ibadan in southwestern Nigeria. The study size is 50 m x 50 m. The presence of all vascular species and biomass measurements were recorded in 25 square quadrats of area 0.25 m2 which were distributed in an approximately random manner over the whole site at monthly intervals from January 1956 to February 1958, then again in September 1963 and November 1964. A single measurement of herbaceous LAI was made in September 1963 and a single measurement of tree/shrub LAI was made in November 1964. Additional above-ground biomass measurements were made nearby in May 1960 and December 1964.
Both of the main vegetation types in southwestern Nigeria are present -- moist semi-deciduous forest which is the climatic climax, and derived savanna woodland which is a biotic fire climax. The secondary nature of both are due to previous cultivation. This data set concerns the productivity of the derived savanna woodland.
Prior to 1900, the Olokemeji area was subject to a bush fallow system of cultivation. This consisted of cutting down most of the smaller trees and shrubs and burning them, usually at the base of the larger trees. The land was cultivated (mainly to cassava, yams, and maize) for a few years, then abandoned as bush fallow. After several years the process was usually repeated. These practices destroyed and impoverished the natural vegetation and were responsible for the encroachment of the savanna into the forest zone. Thus, the savanna at Olokemeji is classified as a derived savanna woodland (modified Bailey ecoregion humid savanna, #414). The savanna is burned annually in January/February.
The dominant grassland species in the derived savanna are Andropogonaceous grasses (C4). Almost half the species encountered in the quadrats were grasses which averaged two species per quadrat. Andropogon schirensis, Monocymbium ceresiiforme, Andropogon tectorum and Schyzachyrium sanguineum were the most frequent grasses while Pandiaka heudelotii, Stylochiton warneckei, and Aframomum latifolium were the most frequent forbs found during the study. Small plants of Stereospermum kunthianum, Psorospermum febrifugum, and Parinari curatellifolia were also very frequent. The dominant woody species over 1-m high (canopy) on the savanna were Butyrospermum paradoxum subsp. parkii, Lophira lanceolata, and Pterocarpus erinaceus. One of the valuable species usually preserved during previous farming practice was Butyrospermum; this undoubtedly accounts for the high number of large trees of this species on the site.
The soil at the Olokemeji savanna site consists predominantly of a silty clay loam (0-5 cm) overlying a coarse sandy loam (5-20 cm). Below this depth, soils become more clayey and contain quartz stones and ironstones concretions. The soil carbon content is 2.8% OM (10-20 cm).
The climate at Olokemeji is markedly seasonal, consisting of wet and dry seasons. The mean annual rainfall recorded at Olokemeji is 1,232 mm. The wet season lasts from March until October, after which the dry season commences. There is usually a short dry season during August.
Please see Hopkins and Jenkin (1962) for more information on the physical features, climate, history, and vegetation of the Olokemeji Forest Reserve.
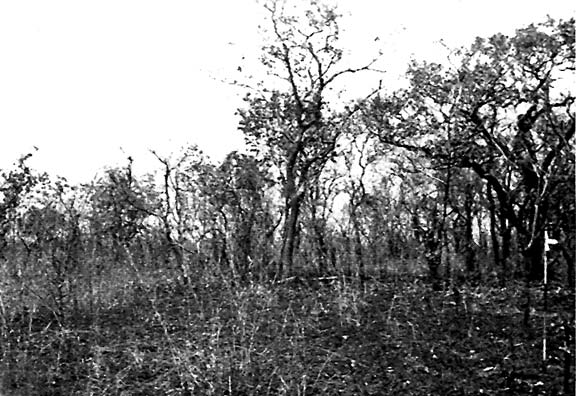
Figure 2. Approximate north-western view of the Olokemeji grassland site, Nigeria. (Butyrospermum paradoxum tree in center of picture in background; south-east corner of site marked by flagstaff on right of picture in foreground. Photograph taken 5th February 1957, four days after burning, mid-dry season, by Dr. B. Hopkins, Chichester, U.K.). Reproduced by kind permission of the Journal of Ecology and the British Ecological Society.
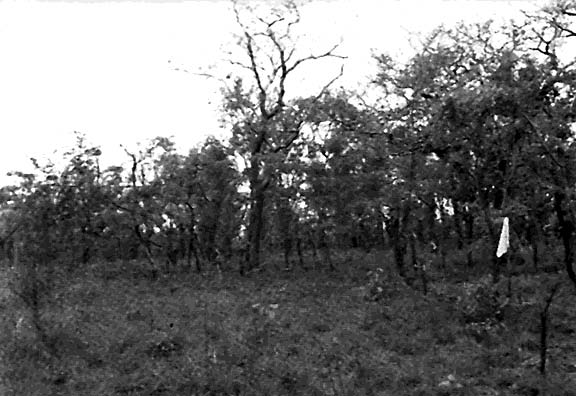
Figure 3. Approximate north-western view of the Olokemeji grassland site, Nigeria. (Butyrospermum paradoxum tree in center of picture in background; south-east corner of site marked by flagstaff on right of picture in foreground. Photograph taken 26th March 1957, about 53 days after burning, early rainy season - after 77-mm rainfall - by Dr. B. Hopkins, Chichester, U.K.). Reproduced by kind permission of the Journal of Ecology and the British Ecological Society.
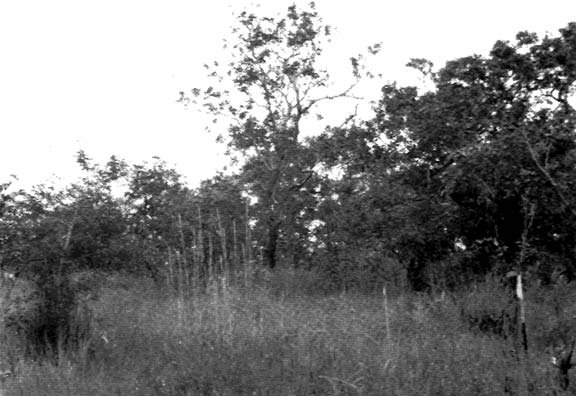
Figure 4. Approximate north-western view of the Olokemeji grassland site, Nigeria. (Butyrospermum paradoxum tree in center of picture in background; south-east corner of site marked by flagstaff on right of picture in foreground. Photograph taken 11th September 1957, towards end of rainy season, by Dr. B. Hopkins, Chichester, U.K.). Reproduced by kind permission of the Journal of Ecology and the British Ecological Society.
Methods
Twenty-five square quadrats of area 0.25 m2 were distributed in an approximately random manner over the Olokemeji site approximately every month from January 1956 to February 1958. Biomass measurements were also made at Olokemeji in September 1963 and November 1964, and at a nearby area on very similar plots in May 1963 and November 1964.
The living vegetation in ten of the 0.25-m2 quadrats was clipped just above ground level. Creeping and climbing plants were cut off at the borders of the quadrat. For woody plants under 1-m high, the current year's shoots were removed. These clippings were removed, dried at 105 degrees C, and weighed. The maximum vertical height of the herbs was recorded over ten of the quadrats. A contiguous grid of 1,600 quadrats, each 0.5 m2, was analyzed in a nearby area on similar plots to the southeast of the primary research area in May 1960 and December 1964. Data from this nearby area are labeled as treatment "burned2" in the NPP data file. See Hopkins (1968) for more details on study methods and results.
The leaf area index (LAI) was recorded on one occasion each for the herbaceous layer and the tree/shrub stratum (Hopkins, 1968). The LAI for the herb layer was determined on 29 September 1963 at the primary research site, at about the time that the highest dry weight is first reached, in order to determine the LAI value when at its maximum. It was determined by direct measurements on 1% of the grass leaves, 10% of the dictotyledon leaves, and all the non-grass monocotyledon leaves collected from twenty-five approximately random quadrats of area 0.25 m2. The following formulae were used to obtain the area of leaves (or leaflets) with an entire margin:
Grasses (and other monocotyledons): area = 0.905 length x width (Kemp 1960)
Dicotyledons: area = 0.667 length x width (Cain and Castro 1959)
The areas of leaves (or leaflets) where the margin was not entire or where the lamina was lobed were determined by tracing the outlines onto plain paper and weighing the shapes so described.
A 10-m2 area near the primary research site and of the same general physiognomy (chosen by eye and checked by measurements of tree basal areas) was chosen for the determination of tree and shrub LAI. All tree and shrub leaves on it were collected on 29 November 1964 and measured in the manner described above.
Monthly photographs were taken from the same camera position [at eye level (1.5 m) immediately southeast of the primary site] using both monochrome and color films. The series of color photographs gives an excellent indication of the seasonal changes taking place but it is not possible to reproduce them here. However, four of the series of monochrome photographs have been selected to show these changes (Figures 1-4 herein).
Phenology records were made of species observed to be flowering or fruiting on all visits to the site during the 10 years of this study (Hopkins, 1968).
In addition to data on above-ground production, information on burning temperatures (above 540 degrees C at ground level, estimated with heat-sensitive paints) and amount of matter consumed by fire (mean = 84% of herb layer) is available in the literature for a nearby area on very similar plots (Hopkins, 1965a).
Climate data
Climate data are available from a weather station at the grassland study site. The data were transcribed from literature/graphs by the principal investigator.
The climate data accompanying this NPP data set was compiled from daily observations of Tmax, Tmin, and precip amount.
For a given month, the maximum value of the daily Tmax for that month and the minimum value of the Tmin for that month is provided. For the year, the maximum value of the monthly Tmax is the annual Tmax and for the year the minimum value of the monthly Tmin values is the annual Tmin. Daily precipitation amount is summed to yield a monthly precipitation amount and the monthly precipitation is summed to provide an annual precipitation amount.
The multi-year mean monthly Tmax is the average of the Tmax values for that month for each year of the record. For example the mean monthly Tmax for April is the mean of each April’s Tmax for the observation period of record. Mean monthly Tmin and Mean monthly precip amount are calculated similarly.
Data Archive Center:
Contact for Data Center Access Information:
E-mail: uso@daac.ornl.gov
Telephone: +1 (865)
241-3952
7. References:
Hopkins, B. 1965a. Observations on savanna burning in the Olokemeji Forest Reserve, Nigeria. J. Applied Ecology 2: 367-381.
Hopkins, B. 1968. Vegetation of the Olokemeji Forest Reserve, Nigeria: V. The vegetation on the savanna site with special reference to its seasonal changes. J. Ecology 56: 97-115.
Hopkins, B., and R.N. Jenkin. 1962. Vegetation of the Olokemeji Forest Reserve, Nigeria: I. General features of the reserve and the research sites. J. Ecology 50(3): 559-598.
Olson, R.J., K.R. Johnson, D.L. Zheng, and J.M.O. Scurlock. 2001. Global and Regional Ecosystem Modeling: Databases of Model Drivers and Validation Measurements. ORNL Technical Memorandum TM-2001/196. Oak Ridge National Laboratory, Oak Ridge, Tennessee, U.S.A.
Additional Sources of Information:
Cain, S. A. and G. M. de O. Castro. 1959. Manual of Vegetation Analysis. New York.
Esser, G. 2013. NPP Multi-Biome: Global Osnabruck Data, 1937-1981. Data set. Available on-line [http://daac.ornl.gov] from Oak Ridge National Laboratory Distributed Active Archive Center, Oak Ridge, Tennessee, USA. doi:10.3334/ORNLDAAC/214
Hopkins, B. 1965b. Vegetation of the Olokemeji Forest Reserve, Nigeria: II. The climate with special reference to its seasonal changes. J. Ecology 53: 109-24.
Hopkins, B. 1965c. Vegetation of the Olokemeji Forest Reserve, Nigeria: III. The microclimates with special reference to their seasonal changes. J. Ecology 53: 125-38.
Hopkins, B. 1966. Vegetation of the Olokemeji Forest Reserve, Nigeria: IV. The litter and soil with special reference to their seasonal changes. J. Ecology 54: 687-707.
Hopkins, B. 1970. Vegetation of the Olokemeji Forest Reserve, Nigeria: VII. The plants on the savanna site with special reference to their seasonal growth. J. Ecology 58(3): 795-825.
Kemp, C.D. 1960. Methods of estimating the leaf area of grasses from linear measurements. Ann. Bot. 24: 491-9.
Olson, R.J., J.M.O. Scurlock, S.D. Prince, D.L. Zheng, and K.R. Johnson (eds.). 2013a. NPP Multi-Biome: Global Primary Production Data Initiative Products, R2. Data set. Available on-line [http://daac.ornl.gov] from the Oak Ridge National Laboratory Distributed Active Archive Center, Oak Ridge, Tennessee, USA. doi:10.3334/ORNLDAAC/617
Olson, R.J., J.M.O. Scurlock, S.D. Prince, D.L. Zheng, and K.R. Johnson (eds.). 2013b. NPP Multi-Biome: NPP and Driver Data for Ecosystem Model-Data Intercomparison, R2. Data set. Available on-line [http://daac.ornl.gov] from the Oak Ridge National Laboratory Distributed Active Archive Center, Oak Ridge, Tennessee, USA. doi:10.3334/ORNLDAAC/615
Scurlock, J.M.O., and R.J. Olson. 2002. Terrestrial net primary productivity - A brief history and a new worldwide database. Environ. Rev. 10(2): 91-109. doi:10.1139/a02-002
Scurlock, J.M.O., and R.J. Olson. 2013. NPP Multi-Biome: Grassland, Boreal Forest, and Tropical Forest Sites, 1939-1996, R1. Data set. Available on-line [http://daac.ornl.gov] from Oak Ridge National Laboratory Distributed Active Archive Center, Oak Ridge, Tennessee, USA. doi:10.3334/ORNLDAAC/653
Scurlock, J.M.O., K. Johnson, and R.J. Olson. 2002. Estimating net primary productivity from grassland biomass dynamics measurements. Global Change Biology 8(8): 736-753. DOI: 10.1046/j.1365-2486.2002.00512.x