Get Data
Summary:
This data set contains five data files in text format (.txt). Three files contain biomass dynamics data for a broad-leaved savanna located in the 800-hectare Nylsvley study site 200 km north of Johannesburg, South Africa. One net primary productivity (NPP) file contains monthly above-ground biomass data from harvests made between mid-October 1974 and mid-September 1977. A second NPP file contains three-year mean monthly values for above-ground, standing dead, and litter biomass. The third NPP file contains monthly below-ground living and dead biomass data from excavations made from August 1988 to November 1989.
Climate data are provided in the other two files. One file contains air temperature data measured at the study site (1975-1983). The other file contains rainfall data measured at a nearby farmhouse (1917-1995).
Above-ground net primary productivity (ANPP) measurements represent the sum of the increase in living, standing dead, and litter biomass for the herbaceous component of this wooded savanna. BNPP is the sum of the increase in below-ground live and dead biomass. A "best estimate" of total NPP (ANPP + BNPP) for herbaceous layer (482 g/m2/yr based on a synthesis of data from several studies at Nylsvley) is 51% of the total NPP (951 g/m2/yr) for herbaceous plus woody primary production combined. Another ANPP estimate, for grazable grasses and forbs in open areas between trees, was reported to be 76 g/m2/yr with grass production accounting for 80%. The Terrestrial Ecosystem Model (TEM) estimated TNPP at Nylsvley to be 440 gC/m2/yr.
The NPP data collection contains field measurements of biomass, estimated NPP, and climate data for terrestrial grassland, tropical forest, temperate forest, boreal forest, and tundra sites worldwide. Data were compiled from the published literature for intensively studied and well-documented individual field sites and from a number of previously compiled multi-site, multi-biome data sets of georeferenced NPP estimates. The principal compilation effort (Olson et al., 2001) was sponsored by the NASA Terrestrial Ecology Program. For more information, please visit the NPP web site at http://daac.ornl.gov/NPP/npp_home.html.
Revision Notes: Only the documentation for this data set has been modified. The data files have been checked for accuracy and are identical to those originally published in 1996.
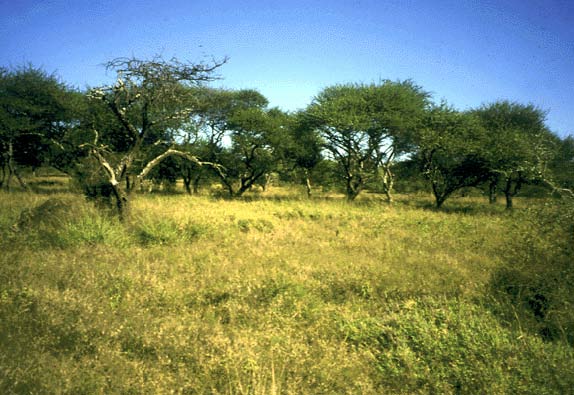
Figure 1. Typical view of fine-leaved savanna at the Nylsvley study site, South Africa. (Dominant trees are Acacia tortilis. Photograph taken 1997 by Dr. R.J. Scholes, CSIR, Pretoria, South Africa).
Data Citation:
Cite this data set as follows:
Scholes, R.J. 2015. NPP Grassland: Nylsvley, South Africa, 1974-1989, R1. Data set. Available on-line [http://daac.ornl.gov] from Oak Ridge National Laboratory Distributed Active Archive Center, Oak Ridge, Tennessee, USA. http://dx.doi.org/10.3334/ORNLDAAC/194
This data set was originally published as:
Scholes, R.J. 1997. NPP Grassland: Nylsvley, South Africa, 1974-1989. Data set. Available on-line [http://daac.ornl.gov] from Oak Ridge National Laboratory Distributed Active Archive Center, Oak Ridge, Tennessee, U.S.A. doi:10.3334/ORNLDAAC/194
Table of Contents:
- 1 Data Set Overview
- 2 Data Description
- 3 Applications and Derivation
- 4 Quality Assessment
- 5 Acquisition Materials and Methods
- 6 Data Access
- 7 References
1. Data Set Overview:
Project: Net Primary Productivity (NPP)
Productivity of a broad-leaved savanna, which includes a substantial grass component (i.e., 60-70% of cover), was monitored from 1974 through 1989 at the Nylsvley study site, under the South African Savanna Biome Programme.
The Nylsvley study site (24.65 S, 28.70 E, Elevation 1,100 m) is situated 200 km north of Johannesburg, near the town of Nylstroom. The 800-hectare savanna research area is part of a larger 3,120-hectare nature reserve.
Monthly above-ground biomass data are available for 1974-1977 (N.B.: southern hemisphere growing season) together with biomass and dead matter dynamics averaged over the same period. Monthly live/dead root dynamics data are available for 1988/89. Some of the data have been read from published graphs; therefore the least significant digit may be in error. Detailed data are also available in the literature on soils, hydrology, nutrients, vegetation types, plant physiology, carbon and nitrogen budgets, and the effect of burning and grazing on the Nylsvley study site.
The NPP measurement presented here is the sum of the increase in above-ground live, standing dead, and litter biomass and, separately, below-ground live and dead biomass for the herbaceous component of this wooded savanna. A "best estimate" of annual total NPP for the the herbaceous (grass) component of the Nylsvley woody savanna is given as 482 g/m2/yr based on a synthesis of ANPP + BNPP data from several studies at Nylsvley (Scholes, 1993). This estimate is 51% of a total NPP (951 g/m2/yr) for herbaceous and woody NPP combined. (N.B. Woody production estimates are not part of this data set.) Another estimate of ANPP, for the grazeable above-ground plant material of the grass layer (grasses + forbs) in open areas between trees, is reported to be 76 g/m2/yr (Grunow et al., 1980; Scholes and Walker, 1993; Scurlock and Olson, 2013). Grass production accounts for 60 g/m2/yr (Grunow et al., 1980; Olson et al., 2013a). The Grunow et al. (1980) smooth function calculation of ANPP may have substantially underestimated productivity at Nylsvley. The Terrestrial Ecosystem Model (TEM) estimated TNPP at Nylsvley to be 440 gC/m2/yr (Olson et al., 2013b). The three estimates do not agree because different calculation methods were used.
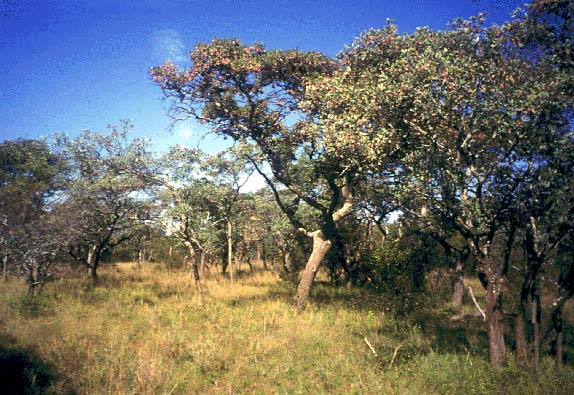
Figure 2. Typical view of broad-leaved savanna at the Nylsvley study site, South Africa. (Dominant trees are Burkea africana. Photograph taken 1997 by Dr. R.J. Scholes, CSIR, Pretoria, South Africa).
2. Data Description:
Spatial Coverage
Site: Nylsvley, South Africa
Site Boundaries: (All latitude and longitude given in decimal degrees)
| Site (Region) | Westernmost Longitude | Easternmost Longitude | Northernmost Latitude | Southernmost Latitude | Elevation (m) |
|---|---|---|---|---|---|
| Nylsvley, South Africa | 28.70 | 28.70 | -24.65 | -24.65 | 1,100 |
Spatial Resolution
The savanna research area is 800 hectares. Above-ground harvest plots included both 0.25-m2 and 0.5-m2 quadrats. Below-ground samples were 38-mm diameter x 50-cm deep cores.
Temporal Coverage
Above-ground biomass measurements were made from 1974/10/03 through 1977/09/17. Below-ground biomass measurements were made from 1988/08/29 through 1989/11/02. Three-year mean monthly above-ground biomass values are provided for the period 1974/75-1976/77. Temperature data are available from 1975/01/01 through 1983/09/30, and rainfall from 1917/01/01 through 1995/05/31.
Temporal Resolution
Above-ground biomass measurements were made at 3- and 6-week intervals in the ungrazed study area, and at 4- and 8-week intervals in the grazed study area. More frequent sampling occurred during the growing season in each treatment. Below-ground measurements were made monthly over a 15-month period. All biomass estimates are based on plant dry matter accumulation, expressed as g/m2.
Climate data are expressed as monthly and annual precipitation amount (mm) (1975-1983), monthly and annual mean precipitation amount (mm) (1917-1995 period), maximum/minimum average temperature for month or year (degrees C) (1975-1983), and monthly and annual mean maximum/minimum temperature (degrees C) (1975-1983).
Table 1. Data file descriptions
| FILE NAME | TEMPORAL COVERAGE | FILE CONTENTS |
|---|---|---|
| nls1_npp.txt | 1974/10/03 - 1977/09/17 | Seasonal above-ground biomass data for Nylsvley savanna |
| nls2_npp.txt | 1974/75 - 1976/77 | Three-year mean monthly above-ground biomass data for Nylsvley savanna |
| nls3_npp.txt | 1988/08/29 - 1989/11/02 | Seasonal below-ground biomass data for Nylsvley savanna |
| nls1_cli.txt | 1975/01/01 - 1983/09/30 | Monthly and annual temperature data from weather station at Nylsvley. |
| 1975/01/01 - 1983/12/31 | Monthly and annual precipitation data from farmhouse weather station near Nylsvley | |
| nls2_cli.txt | 1917/01/01 - 1995/05/31 | Monthly and annual precipitation data from weather station at farmhouse near Nylsvley |
NPP Data. Biomass estimates for the Nylsvley site are provided in three files. The data sets are ASCII files (.txt format). The first 18 lines are metadata; data records begin on line 19. The variable values are delimited by semicolons. All biomass units are in g/m2 (dry matter weight). There are no missing values.
Table 2. Column headings in data file nls1_npp.txt (seasonal above-ground biomass data)
| COLUMN HEADING | DEFINITION | UNITS |
|---|---|---|
| Site | Site where data were gathered (code refers to site identification) | text |
| Treatmt | Long term management of site (code refers to treatment described in metadata in data file) | |
| Year | Year in which data were collected | yyyy |
| Mn | Month in which data were collected | mm |
| Dy | Day on which data were collected | dd |
| Tyear | Date in decimal year (year plus the Julian date divided by 365) | numeric |
| AGbiomass | Above-ground biomass | g/m2 |
| AGb_SE | Standard error of the mean for above-ground live biomass |
Note: All data values are from Grunow et al. (1980).
Sample NPP Data Record
| Site;Treatmt;Year;Mn;Dy;Tyear;AGbiomass;AGb_SE [units g/m2] (SE = standard error of the mean) nls;lngtrm ;1974;10;03;1974.756; 36.0; 11.0 nls;lngtrm ;1974;11;24;1974.899; 32.0; 9.0 nls;lngtrm ;1974;11;13;1974.868; 41.0; 9.0 ... |
Table 3. Column headings in data file nls2_npp.txt (three-year mean monthly above-ground biomass data)
| COLUMN HEADING | DEFINITION | UNITS |
|---|---|---|
| Site | Site where data were gathered (code refers to site identification) | text |
| Treatmt | ANPP analysis method | |
| Mn | Month in which data were collected | mm |
| Dy | Day on which data were collected | dd |
| AGbiomass | Above-ground 3y-mean grazeable live biomass | g/m2 |
| Stdead | Above-ground 3y-mean standing dead biomass (total grazeable standing crop minus grazeable biomass) | |
| Litter | Above-ground 3y-mean grass litter biomass in open areas | |
| AGtotmatter | Total above-ground 3y-mean biomass (live + dead + litter) | |
| AGtotclip | Total above-ground 3y-mean grazeable standing crop plus stubble standing crop (shoot plus crown) |
Note: All data values are from Grunow et al. (1980).
Sample NPP Data Record
| Site;Treatmt;Mn;Dy;AGbiomass;Stdead;litter;AGtotmat;AGtotclip (shoot+crown) [units g/m2] nls;3y-mean ;10;15; 28.0; 127.0; 228.0; 383.0; 432.0 nls;3y-mean ;11;15; 39.0; 94.0; 283.0; 416.0; 446.0 nls;3y-mean ;12;15; 63.0; 123.0; 215.0; 401.0; 570.0 ... |
Table 4. Column headings in data file nls3_npp.txt (seasonal below-ground biomass data)
| COLUMN HEADING | DEFINITION | UNITS |
|---|---|---|
| Site | Site where data were gathered (code refers to site identification) | text |
| Treatmt | Long term management of site (code refers to treatment described in metadata in data file) | |
| Year | Year in which data were collected | yyyy |
| Mn | Month in which data were collected | mm |
| Dy | Day on which data were collected | dd |
| Tyear | Date in decimal year (year plus the Julian date divided by 365) | numeric |
| BGbiomass | Below-ground live biomass | g/m2 |
| BGdead | Below-ground dead biomass | |
| BGtotmatter | Total below-ground biomass (live + dead + litter) | |
| BGb_SE | Standard error of the mean for below-ground live biomass | |
| BGd_SE | Standard error of the mean for below-ground dead biomass |
Note: All data values are from Scholes and Walker (1993).
Sample NPP Data Record
| Site;Treatmt;Year;Mn;Dy;Tyear;BGbiomass;BGdead;BGtotmatter;BGb_SE;BGd_SE [units g/m2] (SE = standard error of the mean) nls;lngtrm ;1988;8;29;1988.663;140;107;247;45;39 nls;lngtrm ;1988;10;25;1988.819;110;32;142;32;13 nls;lngtrm ;1988;11;28;1988.912;123;68;191;58;13 |
Climate Data. Climate data for the Nylsvley sites are provided in two files. The data sets are ASCII files (.txt format). The first 18 lines are metadata; data records begin on line 19. The variable values are delimited by semicolons. The values -99.9 and -999.9 are used to denote missing values.
Sample Climate Data Record at Nylsvley (nls1_cli.txt)
| Site;Temp;Parm; Jan; Feb; Mar; Apr; May; Jun; Jul; Aug; Sep; Oct; Nov; Dec; Year nls ;mean;prec;156.2; 87.4; 73.1; 43.9; 7.4; 3.1; 0.6; 8.0; 19.6; 50.3;117.4; 98.9; 666.1 nls ;mean;tmax; 29.4; 28.9; 27.6; 26.1; 23.8; 21.0; 21.3; 24.0; 27.8; 28.7; 29.2; 29.4; 30.6 nls ;mean;tmin; 17.0; 16.6; 15.1; 11.7; 7.9; 4.5; 4.7; 8.1; 11.9; 13.3; 15.4; 16.3; 3.7 nls ;numb;prec; 9.0; 9.0; 9.0; 9.0; 9.0; 9.0; 9.0; 9.0; 9.0; 9.0; 9.0; 9.0; 9.0 nls ;numb;tmax; 8.0; 8.0; 8.0; 9.0; 9.0; 9.0; 9.0; 9.0; 9.0; 8.0; 8.0; 8.0; 9.0 nls ;numb;tmin; 8.0; 8.0; 8.0; 9.0; 9.0; 9.0; 9.0; 9.0; 9.0; 8.0; 8.0; 8.0; 9.0 nls ;stdv;prec; 77.0; 60.1; 47.6; 36.7; 10.7; 6.2; 1.5; 11.1; 21.4; 32.7; 77.7; 54.1; 93.1 nls ;stdv;tmax; 1.7; 2.0; 1.6; 1.2; 1.1; 0.7; 0.7; 1.7; 1.2; 1.4; 1.4; 1.1; 1.0 nls ;stdv;tmin; 0.6; 0.5; 0.3; 1.0; 1.4; 1.9; 1.5; 2.5; 1.0; 1.3; 0.5; 0.4; 0.8 nls ;1975;prec;205.5;155.0; 51.0; 94.0; 33.5; 6.0; 0.0; 0.0; 0.0; 22.0; 68.5;202.0; 837.5 nls ;1975;tmax;-99.9;-99.9;-99.9; 24.9; 24.1; 20.6; 21.7; 23.7; 28.6; 28.9; 29.3; 27.6; 29.3 nls ;1975;tmin;-99.9;-99.9;-99.9; 11.7; 8.2; 4.5; 3.3; 6.4; 11.4; 13.0; 15.5; 16.0; 3.3 ... Where, Temp (temporal) - specific year or long-term statistic: mean = mean based on all years numb = number of years stdv = standard deviation based on all years Parm (parameter): prec = precipitation for month or year (mm) tmax = mean maximum temperature for month or year (C) tmin = mean minimum temperature for month or year (C) |
Sample Climate Data Record at farmhouse near Nylsvley (nls2_cli.txt)
| Site;Temp;Parm; Jan; Feb; Mar; Apr; May; Jun; Jul; Aug; Sep; Oct; Nov; Dec; Year nls ;mean;prec; 107.8; 90.2; 76.0; 39.2; 12.8; 6.3; 4.5; 5.2; 15.1; 47.0; 100.6; 110.1; 621.4 nls ;numb;prec; 74.0; 75.0; 76.0; 77.0; 78.0; 77.0; 77.0; 76.0; 75.0; 77.0; 74.0; 74.0; 62.0 nls ;stdv;prec; 61.6; 61.3; 46.0; 31.3; 19.7; 13.3; 10.8; 10.8; 19.5; 30.4; 57.0; 54.3; 126.6 nls ;1917;prec;-999.9;-999.9;-999.9; 17.8; 53.6; 28.2; 0.0; 40.7; 9.6; 5.1; 207.2; 186.8; -999.9 nls ;1918;prec; 241.0; 119.0; 170.5; 44.5; 0.0; 0.0; 4.6; 19.1; 8.9; 33.2; 32.5; 78.3; 751.6 nls ;1919;prec; 208.6; 48.0; 70.1; 2.8; 0.0; 0.0; 0.0; 0.0; 5.3; 19.8; 148.5; 88.0; 591.1 … Where, Temp (temporal) - specific year or long-term statistic: mean = mean based on all years numb = number of years stdv = standard deviation based on all years Parm (parameter): prec = precipitation for month or year (mm) |
3. Data Application and Derivation:
The accumulation of biomass, or NPP, is the net gain of carbon by photosynthesis that remains after plant respiration. While there are many fates for this carbon, this data set accounts for above-ground live, standing dead, and litter biomass, and for below-ground live and dead biomass. These are considered the major components of NPP.
The grassland monthly biomass dynamics data for the Nylsvley site are provided for comparison with models and estimation of NPP. Climate data are provided for use in driving ecosystem/NPP models.
Savannas cover approximately half of the African land surface and one fifth of the land surface of the world. They are one of the most important, but least understood terrestrial ecosystems. They are the basis of the African livestock industry and the wildlife they support is of key importance to tourism. The Nylsvley area in South Africa is one of the most intensively studied savanna regions in the world and as such it is a key source of data and theory relating to this important tropical biome.
This study was undertaken as part of the South African Savanna Biome Programme which aimed to develop a unified vision of the ecology of the dry savanna and the understanding necessary to predict changes in ecosystem stability induced by both natural and man-made stresses. This data set is part of the program’s sixteen years of research at Nylsvley. The insights gained from studies at this African savanna site have relevance to savannas in other parts of Africa and the world.
4. Quality Assessment:
To place the productivity estimates of savanna at Nylsvley in perspective, they are compared with grasslands elsewhere (Grunow et al., 1980; Scholes and Walker, 1993). The grass layer productivity of the Nylsvley savanna estimated by Grunow et al. (1980) compares unfavorably with grasslands elsewhere, except in the case of the driest American grasslands. This may be partially an artifact of clipping height, however. The results at Nylsvley are based on potentially grazeable material above a variable stubble height and unharvested root crowns which contain much of the plant mass. Scholes and Walker (1993) consider total tree and grass layer productivity together which places their estimate at the dry and infertile end of the savanna spectrum. Primary production in the more fertile, fine-leaved savanna at Nylsvley is about 50% higher, with a smaller proportion of the production and biomass underground.
Sources of Error
Total NPP is given as a "best estimate". The value is derived from a synthesis of several studies conducted at Nylsvley, including Grunow et al. (1980) as well as others (Scholes and Walker, 1993).
Seasonal ANPP data have been read from published graphs; therefore the least significant digit may be in error.
Underestimation of ANPP by harvest techniques (Williamson, 1976) results from plant death during the clipping interval and other losses. In the present work (Grunow et al., 1980), a partial correction was attempted by adding an estimated increment of recent dead to the biomass, but this still ignores other losses and the generally large sampling errors attached to the difference methods.
The Grunow et al. (1980) smooth function calculation of ANPP may have substantially underestimated productivity at Nylsvley because it was based on an average biomass curve for the three seasons rather than on applying the method to each season independently and then averaging the three production estimates (Scholes and Walker, 1993).
The Scholes and Walker (1993) BNPP values may be underestimates, since some fine roots are inevitably lost during the washing and sorting process, and because it ignores root decay during the 5-month period between the trough and peak of root standing crops.
5. Data Acquisition Materials and Methods:
Site Information
The Nylsvley study site is located 200 km north of Johannesburg, South Africa, near the town of Nylstroom. The 800-hectare savanna research area is located within the larger 3,120-hectare Nylsvley Nature Reserve in the central part of the Transvaal at an elevation of 1,100 m. The site is nearly level. Fire is a crucial factor in the ecology of the savanna. At Nylsvley, the area is burned irregularly at approximately four year intervals.
The Nylsvley site is classified as a broad-leaved savanna (modified Bailey ecoregion savanna, #314). The overall vegetation type is also classified as Mixed Bushveld (Veld Type 18), and the vegetation of the study area as the Burkea Veld Variation [Veld Type 2d (Acocks, 1975)]. The vegetation is a mosaic of deciduous woodland and grassland communities, consisting mainly of large stands of broad leaved Burkea africana savanna interspersed with smaller stands of Acacia tortilis savanna. The dominant graminoids species in open areas between trees is Eragrostis pallens (C4). The other main species, mostly grasses, between trees in descending order of basal cover percentages are: Digitaria eriantha, Diheteropogon amplectens, Andropogon schirensis, Schizachyrium sanguineum, Justicia minima (a forbs), Setaria perennis, Aristida argentea, and Cyperus margaritaceous (a sedge). The dominant graminoids species under tree/shrub canopy is Digitaria eriantha.
Until the Nylsvley Nature Reserve was established (six months before the study commenced), the study site was grazed by cattle between January and April (middle to late growing season). Small populations of impala, Aepyceros melampus, and even smaller populations of greater kudu, Tragelaphus strepsiceros, migrating between veld types, grazed there too. The cattle were removed and part of the area, which had been grazed, was fenced to exclude game animals. Above-ground measurements were made in this "ungrazed" portion of the study site during 1974/75. In 1975/76 and 1976/77, further measurements were made in a paddock open to very light grazing by game (mainly impala) whenever they wished and light grazing by cattle during February and March. This site is described as "grazed". Very light grazing means sporadic grazing of a few hours duration by about 10 to 25 impala on a 40-acre paddock. Below-ground measurements were made over a 15 month period from August 1988 through November 1989.
The soils at Nylsvley are generally deep, sandy, and infertile. The soils overlay sandstone at between 55 and 145-cm depth. The main soil type is Ustoxic quartzipsamment (sand/silt/clay 0.85/0.10/0.05). Soil pH is 5.2. The soil carbon content is 6,784 g/m2 and the nitrogen content 306 g/m2.
Climate data are available from two weather stations. Temperature was monitored at a weather station located at the Nylsvley savanna site at an elevation of 1,100 m from January 1975 through September 1983. Rainfall was measured at a farmhouse, Mosdene, located 5-km from the study site from January 1917 through May 1995.
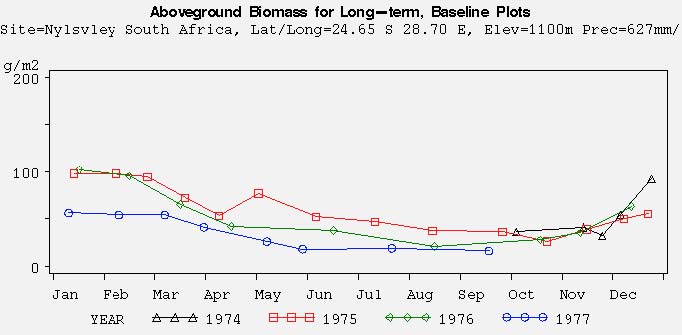
Figure 3. Above-ground biomass dynamics for each year of biomass data at the Nylsvley savanna site, South Africa. (nls_03.jpg)
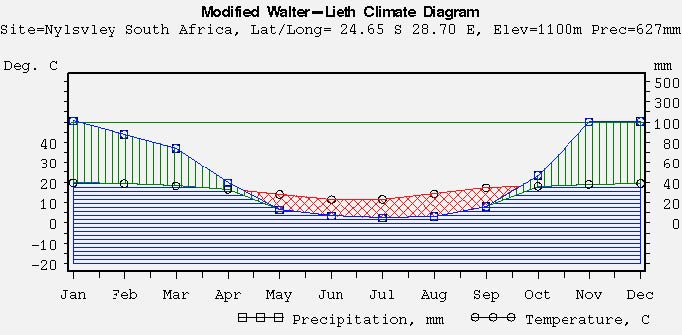
Figure 4. Modified Walter-Lieth climate diagram based upon mean temperature and precipitation data for the Nylsvley savanna site, South Africa. (criss-cross red shading, where present - period of relative drought; vertical green shading - period of relative humid season)
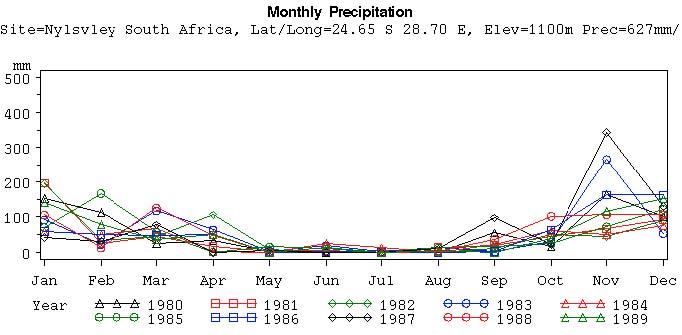
Figure 5. Monthly precipitation at the Nylsvley savanna site, South Africa.
Methods
Above-ground Biomass Sampling (Grunow et al., 1980).
The areas below tree canopy and the open areas between were sampled separately. In the open area of the ungrazed site, thirty 0.5-m2 quadrats were clipped at each harvest during 1974-1975. Harvests were at three week intervals during the growing season from October to April, and at six week intervals during the dry-season from May to September. The lightly grazed areas were sampled during 1975-1977 at four week intervals from October to April, and at eight week intervals from May to September. Thirty 0.5-m2 quadrats were taken from six open-topped exclosures, which were moved to a new position at each harvest, and forty further quadrats were taken adjacent to the exclosure at each harvest. Stubble and litter samples were taken from seventy 0.5-m2 quadrats in 1975/76 and 1976/77. All quadrat positions were chosen at random, and no quadrat was clipped more than once.
Two sampling methods were compared: conventional quadrats, and individual grass tussocks. Above-ground material of all plants with stems up to 1-cm diameter was harvested, but roots were not. The harvested plant material was fractionated in two ways: into "categories" and into "components". Categories are taxonomic groups such as grasses and forbs, or a particular grass species and other grasses. Five types of material (components) were recognized: live grazeable, dead grazeable, live stubble (material so near the base of a tussock that it is not easily grazeable), dead stubble, and litter. The height of the division between grazeable and stubble depended on the species and on the growth-form.
In the areas below tree canopy, the same plan was followed except that samples were taken only half as frequently, and half the quadrats (those below shrubs) were 0.25 m2.
Individual Plant Sampling (Grunow et al., 1980).
Three categories were sampled: the two most important grass species Eragrostis pallens and Digitaria eriantha, and the rest, grouped together as other grasses. For each category, there were the same number and frequency of samples as there were quadrat samples. The basal area of all individual plants clipped was traced on overhead projector film clamped on 30 x 30-cm x 4-cm high perspex tables placed over the clipped plants, and the area was measured by photoelectric planimeter or by weighing cut out photocopies. Biomass (live and dead) was expressed per unit area of tuft, and converted to biomass per unit area of ground by using estimates of basal cover.
Below-ground Biomass Sampling (Scholes and Walker, 1993).
Fine root production was estimated by sequential harvesting technique. The root standing crop estimates were determined monthly from forty 38-mm diameter cores taken to a depth of 50 cm. Samples were washed, sorted to living and dead components, and dried. The fine root masses were corrected for ash content and the proportion of roots below 50-cm depth.
Analysis of ANPP (Grunow et al., 1980).
Difference methods were used to determine the mean flow rate between components such as above-ground grazeable live biomass, standing dead biomass and litter. ANPP was calculated by integration of a growth rate curve, derived from a curve of live biomass during the year which was fitted to field harvest results using two opposing Gompertz functions representing growth and death. Growth rate and death rate were derived from these, and their difference gave the rate of change of biomass. These curves also give functions for instantaneous rates, and are useful for computer simulations.
Analysis of BNPP (Scholes and Walker, 1993).
Fine root production was estimated as the difference between the peak and trough root standing crops (Scholes, unpublished data).
Climate.
Temperature data were recorded at the study site and precipitation at a farmhouse 5-km away.
4. Data Access:
These data are available through the Oak Ridge National Laboratory (ORNL) Distributed Active Archive Center (DAAC).
Data Archive Center:
Contact for Data Center Access Information:
E-mail: uso@daac.ornl.gov
Telephone: +1 (865) 241-3952
7. References:
Grunow, J.O., H.T. Groeneveld, and S.H.C. du Toit. 1980. Above-ground dry matter dynamics of the grass layer of a South African tree savanna. J. Ecology 68: 877-879.
Olson, R.J., K.R. Johnson, D.L. Zheng, and J.M.O. Scurlock. 2001. Global and Regional Ecosystem Modeling: Databases of Model Drivers and Validation Measurements. ORNL Technical Memorandum TM-2001/196. Oak Ridge National Laboratory, Oak Ridge, Tennessee, U.S.A.
Scholes, R.J., and B. H. Walker. 1993. An African Savanna: synthesis of the Nylsvley study. Cambridge University Press. 306 pp.
Additional Sources of Information:
Acocks, J.P.H. 1975. Veld types of South Africa. Memoirs of the Botanical Survey of South Africa, No. 40. Botanical Research Institute, Private Bag XI0l, Pretoria 0001 South Africa.
Louw, A.J. 1968. Bemesting van natuurlike veld op rooileemgrond van die Springbokvlakte. II. Invloed van ammoniumsulfaat-en super fosfaatbemesting op lug droemateriaalopbrengs en die minerale-inhouddaarvan. South African Journal of Agricultural Science 11: 629-636.
Olson, R.J., J.M.O. Scurlock, S.D. Prince, D.L. Zheng, and K.R. Johnson (eds.). 2013a. NPP Multi-Biome: Global Primary Production Data Initiative Products, R2. Data set. Available on-line [http://daac.ornl.gov] from the Oak Ridge National Laboratory Distributed Active Archive Center, Oak Ridge, Tennessee, USA. doi:10.3334/ORNLDAAC/617
Olson, R.J., J.M.O. Scurlock, S.D. Prince, D.L. Zheng, and K.R. Johnson (eds.). 2013b. NPP Multi-Biome: NPP and Driver Data for Ecosystem Model-Data Intercomparison, R2. Data set. Available on-line [http://daac.ornl.gov] from the Oak Ridge National Laboratory Distributed Active Archive Center, Oak Ridge, Tennessee, USA. doi:10.3334/ORNLDAAC/615
Scurlock, J.M.O., and R.J. Olson. 2002. Terrestrial net primary productivity - A brief history and a new worldwide database. Environ. Rev. 10(2): 91-109. doi:10.1139/a02-002
Scurlock, J.M.O., and R.J. Olson. 2013. NPP Multi-Biome: Grassland, Boreal Forest, and Tropical Forest Sites, 1939-1996, R1. Data set. Available on-line [http://daac.ornl.gov] from Oak Ridge National Laboratory Distributed Active Archive Center, Oak Ridge, Tennessee, USA. doi:10.3334/ORNLDAAC/653
Scurlock, J.M.O., K. Johnson, and R.J. Olson. 2002. Estimating net primary productivity from grassland biomass dynamics measurements. Global Change Biology 8(8): 736-753. DOI: 10.1046/j.1365-2486.2002.00512.x
Williamson, P. 1976. Above-ground primary production of chalk grassland allowing for leaf death. J. Ecology 64: 1059-1075.