Documentation Revision Date: 2017-09-28
Data Set Version: 1
Summary
The ORNL DAAC Net Primary Production (NPP) data collection contains field measurements of biomass, estimated NPP, and climate data for terrestrial grassland, tropical forest, temperate forest, boreal forest, and tundra sites worldwide. Data were compiled from the published literature for intensively studied and well-documented individual field study areas and sites and from a number of previously compiled multi-site, multi-biome datasets of georeferenced NPP estimates. The principal data compilation effort (Olson et al., 2001) was sponsored by the NASA Terrestrial Ecology Program .
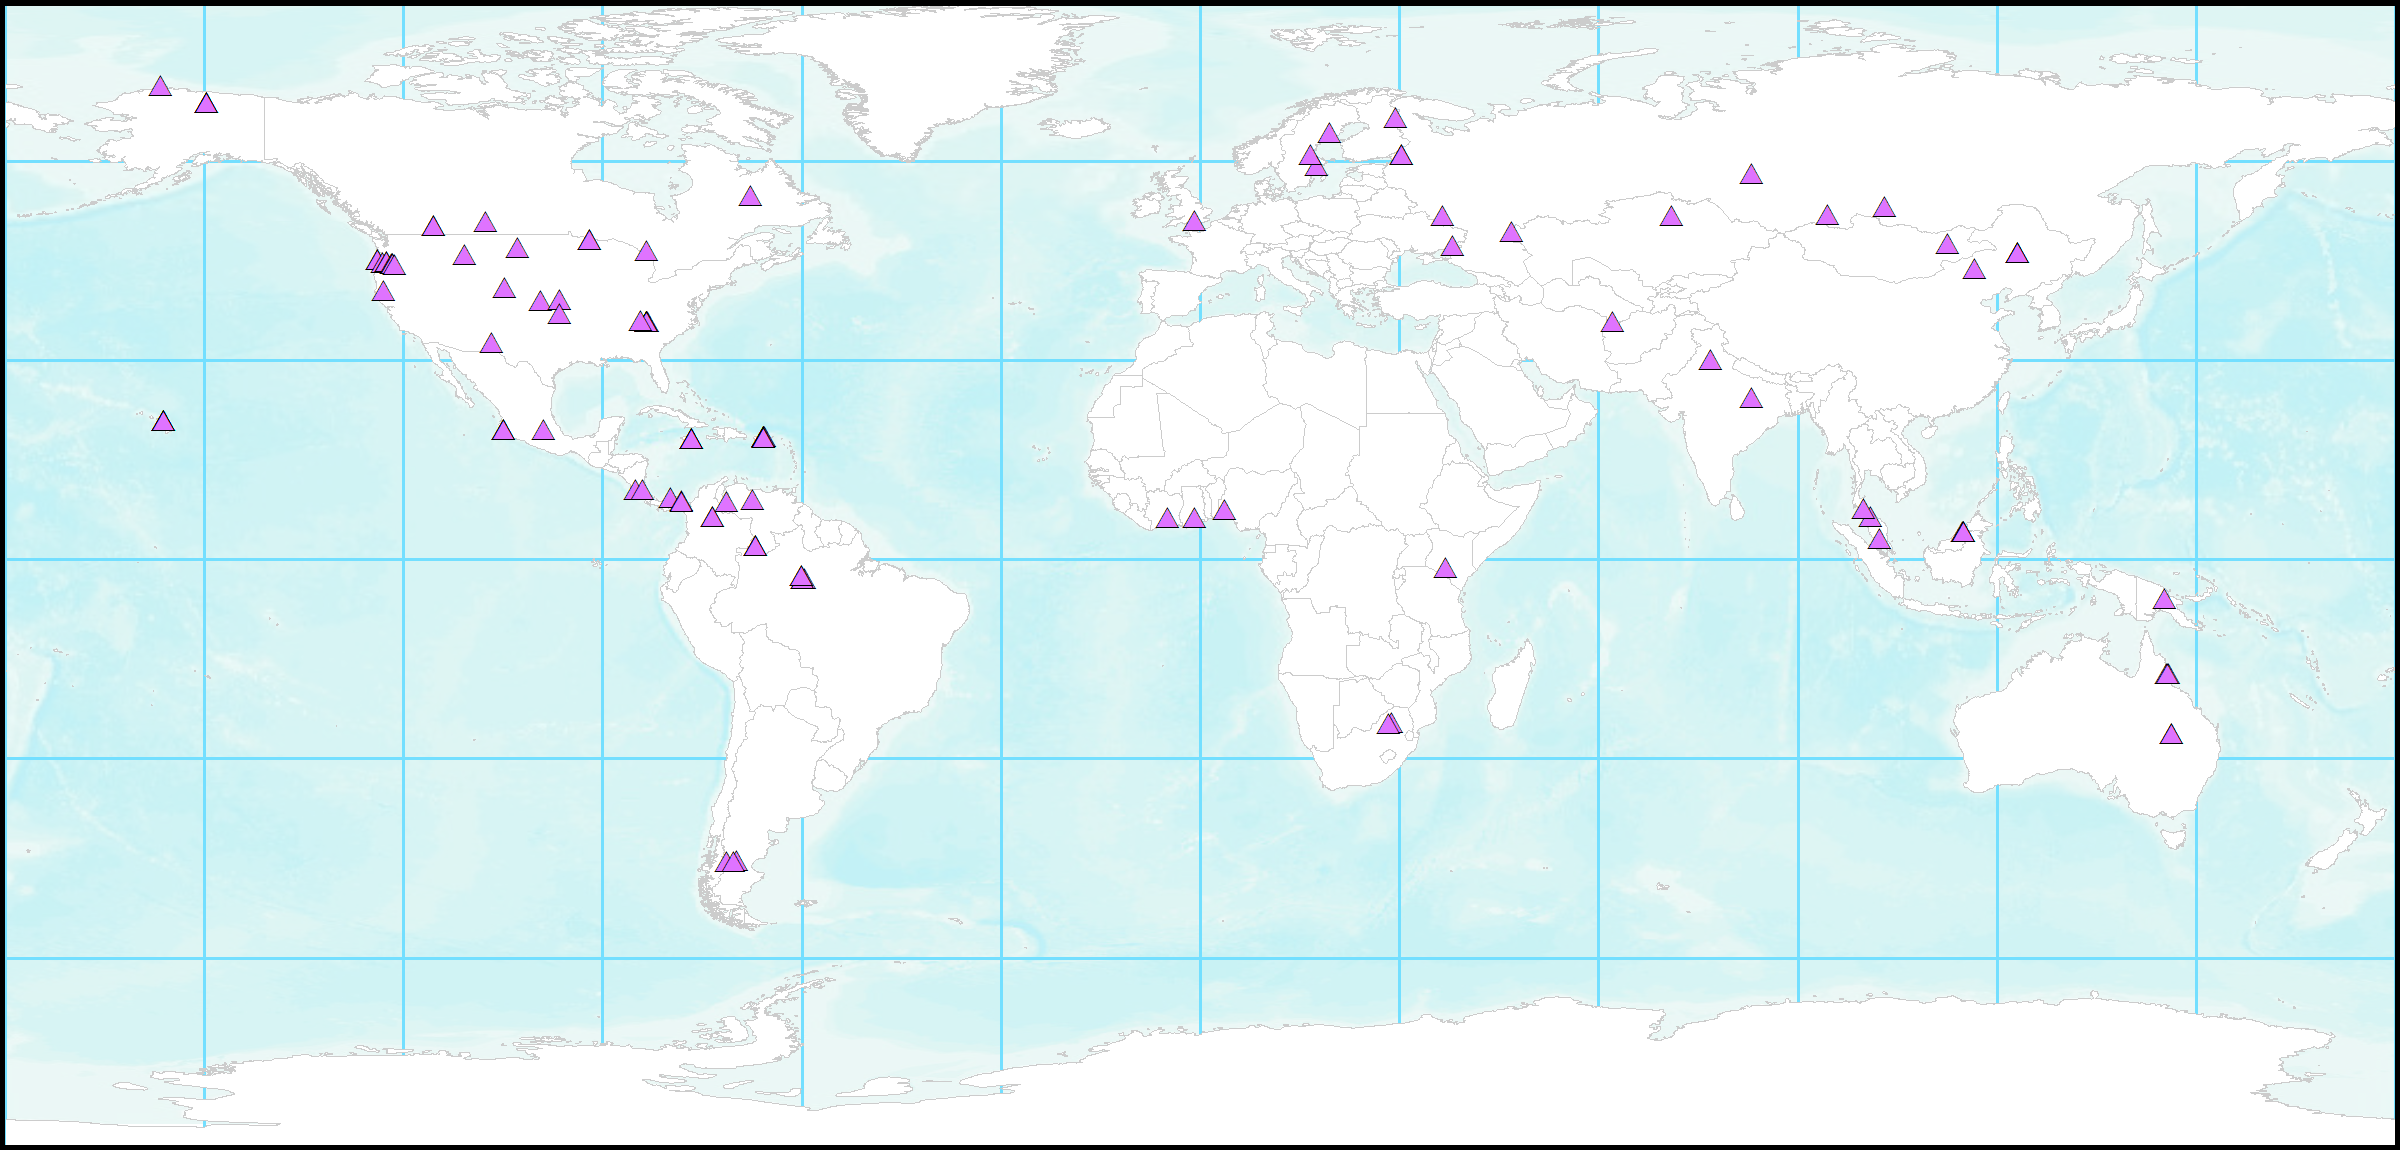
Figure 1. Locations of the 125 NPP Study Sites represented in this dataset.
Citation
Olson, R.J., J.M.O. Scurlock, T.R. Walker, L.A. Hook, C.N. Curtis, and R.B. Cook. 2017. NPP Multi-Biome: Summary Data from Intensive Studies at 125 Sites, 1936-2006. ORNL DAAC, Oak Ridge, Tennessee, USA. https://doi.org/10.3334/ORNLDAAC/1352
Table of Contents
- Data Set Overview
- Data Characteristics
- Application and Derivation
- Quality Assessment
- Data Acquisition, Materials, and Methods
- Data Access
- References
Data Set Overview
This data set, NPP Multi-Biome: Summary Data from Intensive Studies at 125 Sites, 1936-2006, contains a single shapefile that provides site-level summary statistics from 125 sites in five biomes: boreal forest, grassland, temperate forest, tropical forest, and tundra. The spatial coverage is global and spans the time period from 1936 through 2006. Study periods, and both spatial and temporal resolution vary by site. Data include georeferenced location, elevation, mean annual precipitation, mean annual minimum and maximum air temperature, dominant soil type, ecoregion type, dominant plant species, general vegetation types, annual mean or peak living above- and below-ground biomass, average annual above- and below-ground Net Primary Productivity (NPP), and reference information. Additionally study sampling period and intervals, plot management, and long-term site management history are also provided.
Project: Net Primary Productivity (NPP)
The ORNL DAAC Net Primary Production (NPP) data collection contains measurements of biomass and estimates of NPP for terrestrial study sites worldwide, compiled from field studies, published literature, and other extant data sources. The NPP field studies were carried out over a long time period by many investigators using a variety of methods. This data set aims to summarize the detailed data gathered from intensive study sites. Each of the 125 sites included in this data set is classified into one of five major terrestrial biomes (boreal forest, grassland, temperate forest, tropical forest, or tundra) according to Bailey (1989). These site-level data are also archived as individual data sets within the NPP data collection.
Related Data Sets:
There are 82 NPP datasets related to this product. The digital object identifier (DOI) associated with each NPP dataset is included as a reference field in the shapefile.
Data Characteristics
Spatial Coverage: Global
Spatial Resolution: Point
Temporal Coverage: 1938-01-01 through 2006-12-31
Temporal Resolution: Various depending on biome, study area, and investigation.
Study Area: (all latitudes and longitudes given in decimal degrees)
| Westernmost Longitude | Easternmost Longitude | Northernmost Latitude | Southernmost Latitude | |
|---|---|---|---|---|
|
Global |
-157.67 |
146.27 |
71.31 |
-45.68 |
Data File Information:
This data set provides a single data file, NPP_125_Study_Sites.zip, in shapefile format (.shp) packaged into a .zip file, containing site-level summary statistics and ancillary site information. Data parameters include georeferenced site location, elevation, mean annual precipitation, mean annual minimum and maximum air temperature, dominant soil type, ecoregion type, dominant plant species, general vegetation type, annual or peak living above- and below-ground biomass, and annual average above- and below-ground net primary production (ANPP and BNPP, respectively). Additional information includes study sampling period and intervals, study plot management, long-term site management history, and primary references. This data file was constructed from 67 detailed site-level NPP data sets archived in the ORNL DAAC NPP data collection.
Some combination of annual mean or peak live above-ground biomass estimates and/or seasonal biomass dynamics data is available for all sites. Many sites also have estimates of below-ground biomass and net production. Field measurements were carried out from 1936 through 2006 although temporal coverage and resolution vary by site. Biomass, NPP, biophysical and climate summary statistics were compiled from existing field measurements for 67 intensive terrestrial study areas, many including two or more sites that are differentiated by biological, geophysical and/or hydroclimatological features.
Table 1. Range of above- and below-ground biomass and NPP values for study and field sites by biome.
| Biome | Intensive Study Areas | Field Sites | AGB g/m2 | BGB g/m2 |
ANPP g/m2/yr | BNPP g/m2/yr |
|---|---|---|---|---|---|---|
|
Grassland |
35 |
37 |
35 - 1,974 |
110 - 4,304 |
35 - 2,407 |
60 - 1,745 |
|
Boreal Forest |
8 |
11 |
820 - 32,774 |
187 - 7,144 |
93 - 822 |
20 - 1,100 |
|
Temperate Forest |
4 |
20 |
1,080 - 443, 783 |
Not Available |
120 - 2,060 |
170 - 510 |
|
Tropical Forest |
18 |
50 |
3,375 - 65,000 |
687 - 15,262 |
370 - 2,820 |
13 - 966 |
|
Tundra |
2 |
5 |
78 - 3,272 |
400 - 1,000 |
37 - 475 |
100 - 300 |
Data File Description: NPP_125_Study_Sites.zip
Table 2. Attribute names, units, and description for the shapefile provided in this data set.
|
Attribute Name |
Units |
Definition |
|---|---|---|
|
site_name |
|
Name of the study site. |
|
site_id |
|
Short 3 or 4 character abbreviated site name assigned to each study site |
|
country |
|
Country name in which the study site is located. |
|
landmark |
|
City, county, and/or landmark close to the study site location. |
|
state |
|
State, providence and/or region in which the study site is located. |
|
lat |
decimal degrees |
Latitude of the study site (positive value = North latitude; negative value=South Latitude). |
|
long |
decimal degrees |
Longitude of the study site (positive values = East longitude; negative value = West longitude). |
|
elevation |
m |
Elevation above mean sea level expressed in meters. |
|
map_mm |
mm |
Mean annual precipitation amount in millimeters. |
|
meantmin_C |
degrees C |
Mean annual minimum air temperature in degrees Celsius. |
|
meantmax_C |
degrees C |
Mean annual maximum air temperature in degrees Celsius. |
|
biome |
|
Terrestrial biome defined by climate and dominant vegetation after Bailey (1989). |
|
soil_type |
|
Dominant soil type at the study site, based on FAO or USDA soil classifications. |
|
ecoregion |
|
Ecoregion type after Bailey (1989). |
|
species |
|
Dominant plant species or species association at the study site. |
|
vegetation |
|
General vegetation type, plant community structure at the study site based on dominant plant species or species association, biome, and climate zone as indicated in the primary literature. |
|
plot_mgmt |
|
Study plot management, site treatment or management during the sampling period (e.g., untreated=control or not treatment; ungrazed=exclosure preventing grazing during study period; unburned=not burned during the study period; etc.) |
|
mgmt_histo |
|
Long-term site management history, historical conditions at the study site with an indication of age of plan community, stage of ecological development, and long-term management practices. Supplemental information is provided where available, such as protection status, previous disturbance history (e.g., fire, flood, hurricane, logging) and length of time since disturbance. Undisturbed means no major disturbance is reported in the literature. |
|
agb_gm2 |
g/m2 |
Annual mean or peak living above-ground biomass in grams per meter squared, depending on biome. Grassland=peak; Forests=annual mean; Tundra=peak or total. |
|
bgb_gm2 |
g/m2 |
Annual mean or peak living below-ground biomass in grams per meter squared, depending on biome. Grassland=peak; Forests=annual mean; Tundra=peak or total. |
|
ANPP_gm2yr |
g/m2/yr |
Annual average above-ground net primary production in grams per meter squared per year. |
|
BNPP_gm2yr |
g/m2/yr |
Annual average below-ground net primary production in grams per meter squared per year. |
|
start_date |
yyyymmdd |
Year, month, and day when the study began. |
|
end_date |
yyyymmdd |
Year, month, and day when the study ended. |
|
s_interval |
|
Temporal resolution (interval of time between sample collections; often varies by parameter). For example "bi-weekly (litterfall)" means that litterfall traps were emptied at 2-week intervals. "10-day (biomass)" means that plant biomass was harvested or estimated every 10 days. |
|
s_period |
|
Temporal coverage in terms of seasons (e.g., growing season wet season; year-round, etc.,) |
|
m_period |
|
Months, years, or seasons when samples were not collected (e.g. Nov-Jan; 1973-2000; non-growing season; wet season; dry season; nr=not reported, etc.) Mission period often varies by parameter. |
|
reference |
|
Digital Object Identifier (DOI) of the data source at ORNL DAAC. |
Application and Derivation
This data set provides an overview and summary of study site attributes by biome extracted from 67 intensive studies, and represents an analysis that was formerly hosted on a series of web pages on the ORNL DAAC website, https://daac.ornl.gov .
The detailed site-level and multi-biome NPP datasets archived at the ORNL DAAC have been used extensively by other investigators since their initial publication in the late 1990s and early 2000s, and have been cited or referenced hundreds of times in peer-reviewed papers and model validation exercises. Global change modelers have used these datasets to develop and validate models of vegetation-soil-atmosphere interactions within the global carbon cycle and to help calibrate remote sensing of global vegetation (e.g. Hoffman et al. 2007, 2008; Luo et al., 2012; and Randerson et al. 2009).
Quality Assessment
The source datasets used to derive this summary product were updated during a documentation review process. The summarized values provided here were recalculated using a series of statistical routines, and validated against each source product to ensure accuracy.
Data Acquisition, Materials, and Methods
Site Information
Biomass, net primary productivity, and other site-level information for 125 globally distributed research sites were compiled from 82 archived dataset sources. Each site is located within one of five major terrestrial biomes: grassland, boreal forest, temperate forest, tropical forest, and Alaskan tundra. In addition to biophyscial and climatological data, there is a description of ecoregion classification, dominant plant species and general vegetation type for each study area in the biome summary data files. The representation of habitat types and plant communities within each biome is quite diverse. For example, grassland sites range in type from tropical to alpine and from humid to arid desert environments, and tropical forest representation ranges from lowland alluvial and riverine rainforests to lower and upper montane rainforests to cloud forests. Both deciduous and evergreen forests (and mixes thereof) were studied in the forested biomes.
The ecological condition of each study area is also noted in the data files based on study plot management, long-term site history, age of stand, and degree of disturbance, whether natural (e.g., wildfire, hurricane) or anthropogenic (e.g., logging, livestock grazing) as described in the primary literature. The majority of study areas (67%) were classified by principal investigators as being native, natural, mature, primary or topographic/climatic climax. The next highest percentage of sites (22%) were classified as semi-natural, sub-climax, secondary or other successional sere. Another ten sites (8%) were planted or derived (Table 3).
Table 3. Ecological Condition of Study Areas (Number of Sub-Sites and %), by Biome
|
Biome |
Native, Natural, Mature, Primary or Topographic/Climatic Climax (%) |
Semi-Natural, Sub-Climax, Secondary or Other Successional Sere (%) |
Planted or Derived (%) |
Altered or Disturbed (%) |
Not Reported (%) |
Total Number of Study Areas |
|---|---|---|---|---|---|---|
|
Grassland |
23 (59) |
6 (15) |
9 (23) |
1 (3) |
0 |
39 |
|
Boreal Forest |
1 (9) |
9 (82) |
1 (9) |
0 |
0 |
11 |
|
Temperate Forest |
15 (75) |
3 (15) |
0 |
0 |
2 (10) |
20 |
|
Tropical Forest |
40 (80) |
10 (20) |
0 |
0 |
0 |
50 |
|
Alaskan Tundra |
5 (100) |
0 |
0 |
0 |
0 |
5 |
|
Total |
84 (67) |
28 (22) |
10 (8) |
1 (1) |
2 (2) |
125 |
Most of the study areas (91%) received no manipulative treatment during the time of the study (i.e., untreated controls) (Table 4). A few untreated sites received infrequent light grazing, burning or fertilization but were classified by the principal investigators as being “untreated” with negligible impact. Many of the studies compared the results from untreated sites to findings from adjacent or nearby sites that were intentionally treated. Data for the intentionally treated sites are not included in this data set but are included in the detailed NPP collection, where available.
Table 4. Treatment Status of Study Areas during Study Period, by Biome
|
Biome |
Untreated (%) |
Untreated Other Than Light or Occasional Grazing or Mowing (%) |
Untreated Other Than Accidentally Burned or Burned Once Annually (%) |
Untreated Other Than Natural or Chemical Fertilization (%) |
Total Number of Study Areas |
|---|---|---|---|---|---|
|
Grassland |
30 (77) |
5 (13) |
4 (10) |
0 |
39 |
|
Boreal Forest |
11 (100) |
0 |
0 |
0 |
11 |
|
Temperate Forest |
17 (85) |
0 |
0 |
3 (15) |
20 |
|
Tropical Forest |
50 (100) |
0 |
0 |
0 |
50 |
|
Alaskan Tundra |
5 (100) |
0 |
0 |
0 |
5 |
|
Total |
113 (91) |
5 (4) |
4 (3) |
3 (2) |
125 |
Methods
Biomass measurements and productivity estimates are based on field methods obtained following standard peer-reviewed data acquisition and analysis procedures. The field methods vary somewhat from site to site (e.g., destructive versus non-destructive) and from biome to biome, but generally the methods allow for comparison of results within biomes. Detailed descriptions of site-specific data acquisition methods are provided in documentation prepared for each study site in the NPP Data Collection and in the cited literature.
Most of the studies at grassland sites used sampling procedures recommended by the Grassland Biome Project of the International Biological Program (IBP). Studies at the Alaskan tundra sites used similar methods. This involved harvesting above-ground biomass at regular intervals during the growing season and extracting below-ground biomass samples from soil cores or pits within the harvested plots or adjacent areas. Annual ANPP or shoot production was generally determined by the summation of peak or incremental biomass weights. Annual BNPP was generally based on total net root production.
Most of the studies in forest biomes used non-destructive sampling procedures to estimate above-ground biomass, growth and productivity although study designs varied among sites. Many studies used methods adopted by IBP or a combination of methods including field inventories, basal area and growth measurements, litterfall and large litter collection, tree mortality and herbivory measurements, litter decomposition, and allometric regression equations and/or multiplier indices derived from the literature. Some trees were sacrificed when sufficient species-specific regression data were not available. In these cases, destructive sampling was done after complete inventory and measurements were made at the primary site or executed at a nearby site of similar plant composition and age. In other cases, the entire study plot was harvested to obtain biomass measurements. Litterfall and large litter measurements were made at these plots before clear cutting. Change in biomass over that time was used to determine the productivity. At several sites, above-ground production was based solely on total annual litterfall, giving a minimum estimate of NPP. At a few sites, only biomass data are provided.
Below-ground biomass and production in forested areas were generally estimated based on amount and turnover of live and dead (1) fine root biomass in periodically sampled soil cores and (2) coarse root biomass measured by excavated trenches. The below-ground samples were either collected at the primary site or close by. Generally, there are fewer estimates of below-ground biomass and production for forested biomes than there are for above-ground components given sampling difficulties.
Data Access
These data are available through the Oak Ridge National Laboratory (ORNL) Distributed Active Archive Center (DAAC).
NPP Multi-Biome: Summary Data from Intensive Studies at 125 Sites, 1936-2006
Contact for Data Center Access Information:
- E-mail: uso@daac.ornl.gov
- Telephone: +1 (865) 241-3952
References
Bailey, R.G. 1989. Explanatory Supplement to Ecoregions Map of the Continents. Environmental Conservation 16 (04): 307-309 doi:10.1017/S0376892900009711
Hoffman, F.M., C.C. Covey, I.Y. Fung, J.T. Randerson, P.E. Thornton, Y.H. Lee, N.A. Rosenbloom , R.C. Stockli, S.W. Running, D.E. Bernholdt and D.N. Williams. 2007. Results from the Carbon-Land Model Intercomparison Project (C-LAMP) and Availability of the Data on the Earth System Grid (ESG). Journal of Physics: Conference Series (Vol. 78, No. 1, p. 012026). IOP Publishing. doi:10.1088/1742-6596/78/1/012026
Hoffman, F.M., J.T. Randerson, I.Y. Fung, P.E. Thornton, Y.H. Lee, C.C. Covey, G.B. Bonan and S.W. Running. 2008. The Carbon-Land Model Intercomparison Project (C-LAMP): A Protocol and Evaluation Metrics for Global Terrestrial Biogeochemistry Models (Doctoral dissertation, International Environmental Modelling and Software Society).
Luo, Y.Q., J.T. Randerson, G. Abramowitz, C. Bacour, E. Blyth, N. Carvalhais, P. Ciais, D. Dalmonech, J.B. Fisher, R. Fisher, P. Friedlingstein, K. Hibbard, F. Hoffman, D. Huntzinger, C. D. Jones, C. Koven, D. Lawrence, D.J. Li, M. Mahecha, S.L. Niu, R. Norby, S.L. Piao, X. Qi, P. Peylin, I. C. Prentice, W. Riley, M. Reichstein, C. Schwalm, Y.P. Wang, J.Y. Xia, S. Zaehle and X.H. Zhou. 2012. A Framework for Benchmarking Land Models. Biogeosciences 9: 3857–3874. doi:10.5194/bg-9-3857-2012
Olson, R.J., K.R. Johnson, D.L. Zheng, and J.M.O. Scurlock. 2001. Global and Regional Ecosystem Modeling: Databases of Model Drivers and Validation Measurements. ORNL Technical Memorandum TM-2001/196. Oak Ridge National Laboratory, Oak Ridge, Tennessee, USA.
Randerson, J.T., F.M. Hoffman, P.E. Thornton, N.M. Mahowald, K. Lindsay, Y.H. Lee, C.D. Nevison, S.C . Doney, G. Bonan, R. Stockli, C. Covey, S.W. Runningi and I.Y. Fung. 2009. Systematic Assessment of Terrestrial Biogeochemistry in Coupled Climate–Carbon Models. Global Change Biology 15(10): 2462-2484. doi: 10.1111/j.1365-2486.2009.01912.x