Get Data
Summary:
This data set contains one data file (.csv format) that provides net primary productivity (NPP) estimates for 34 grasslands, 14 tropical forests, and 5 boreal forest sites distributed worldwide. The NPP data were compiled from published literature. In addition to above- and below-ground NPP, and total NPP estimates, the file includes site name and location, biome type, mean annual precipitation, and mean annual temperature, where available.
Aboveground net primary production (ANPP), ranged from 35 to 2,320 g/m2/year, belowground net primary production (BNPP) ranged from 20 to 1,832 g/m2/year, and total net primary production (TNPP) ranged from 182 to 3,538 g/m2/year.
Revision Notes: This data file has been revised to add a negative sign to south latitude and west longitude decimal degree coordinates, and the compass direction (N, S, E, W) for coordinates has been removed. NPP data for Vindhyan, India; Atherton, Australia; John Crow Ridge, Jamaica; and La Selva, Costa Rica, have been revised to correct previously reported values. Additional data references for Kuusamo, Finland, and La Selva, Costa Rica, have been added. Please see the Data Set Revisions section of this document for detailed information.
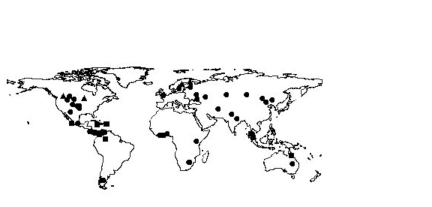
Figure 1. Distribution of 53 NPP sites, circle grasslands, triangle boreal forest, box tropical forest.
Additional Documentation
The NPP data collection contains field measurements of biomass, estimated NPP, and climate data for terrestrial grassland, tropical forest, temperate forest, boreal forest, and tundra sites worldwide. Data were compiled from the published literature for intensively studied and well-documented individual field sites and from a number of previously compiled multi-site, multi-biome data sets of georeferenced NPP estimates. The principal compilation effort (Olson et al., 2001) was sponsored by the NASA Terrestrial Ecology Program. For more information, please visit the NPP web site at http://daac.ornl.gov/NPP/npp_home.html.
Related Data Access Links:
Additional site ancillary data for seven of the multi-biome "intensive" sites are available on the FLUXNET (flux tower) project web site: http://fluxnet.ornl.gov/. These include four grasslands sites Xilingol, China; Konza, Kansas; Shortandy, Kazakhstan; and Tuva, Russia. The tropical forest sites are La Selva, Costa Rica, and Chamela, Mexico. The boreal forest site, Flakaliden, Sweden, is also included in FLUXNET. Investigators at these sites have collected data on site vegetation, soil, hydrologic, and meteorological characteristics.
Additional data for Konza can be accessed through the ORNL DAAC Spatial Data Access Tool (SDAT) as granules of the BIGFOOT Collection. SDAT is an Open Geospatial Consortium (OGC)-compliant tool that provides a web interface to visualize and download user-selected projection, resolution, format, band, interpolation method, time period, and spatial extent. GeoTIFF formatted data files are provided:
- Bigfoot Leaf Area Index Surfaces for North and South American Sites, 2000-2003
- Bigfoot Land Cover Surfaces for North and South American Sites, 2000-2003
- Bigfoot Leaf Area Index Surfaces for North and South American Sites, 2000-2003
There are individual NPP data sets for each of the "intensive" study sites archived at ORNL DAAC [http://daac.ornl.gov/NPP/npp_home.html]. The individual data files contain additional biogeophysical data and information about the sites. NPP data for many of the "intensive" sites are also reported in DeAngelis et al. (1997), Esser (1998), and Olson et al. (2012a, b).
Data Citation:
Cite this data set as follows:
Scurlock, J.M.O., and R.J. Olson. 2013. NPP Multi-Biome: Grassland, Boreal Forest, and Tropical Forest Sites, 1939-1996, R1. Data set. Available on-line [http://daac.ornl.gov] from Oak Ridge National Laboratory Distributed Active Archive Center, Oak Ridge, Tennessee, USA. doi:10.3334/ORNLDAAC/653
This data set was originally published as:
Scurlock, J.M.O., and R.J. Olson. 2003. NPP Multi-Biome: Grassland, Boreal Forest, and Tropical Forest Sites, 1939-1996. Data set. Available on-line [http://daac.ornl.gov] from Oak Ridge National Laboratory Distributed Active Archive Center, Oak Ridge, Tennessee, U.S.A.
Table of Contents:
- 1 Data Set Overview
- 2 Data Description
- 3 Applications and Derivation
- 4 Quality Assessment
- 5 Acquisition Materials and Methods
- 6 Data Access
- 7 References
- 8 Data Set Revision Information
1. Data Set Overview:
Project: Net Primary Production (NPP)
This data set contains one file (.csv format). NPP estimates were compiled from the literature for 34 grasslands, 14 tropical forest sites, and 5 boreal forest sites. The NPP estimates and associated site climate and biophysical characteristics were reviewed and documented to compile this data set and to produce an overview synthesis paper (Scurlock and Olson, 2002). This data set contains the data published in Appendix A Table A.1 of Scurlock and Olson (2002) with revisions described in Section 8 of this document.
Of the 53 sites, 52 sites have ANPP data and 29 have data for below-ground biomass or biomass dynamics. The earliest NPP data are from 1939, and the most recent, from 1996; the number of years of data for each site ranges from 1 to 51. Eighteen (18) sites have data for more than one “treatment” (fertilized or irrigated plots, different soil types, stand ages, etc.). ANPP ranged from 35 to 2,320 g/m2/year, BNPP ranged from 20 to 1,832 g/m2/year, and TNPP ranged from 182 to 3,538 g/m2/year (Table 1).
Table 1. Distribution by biome of the intensive NPP study sites in this data set and mean productivity of each biome as reported in this data set
| Biome | C3 grassland1 | C4 grassland | Boreal forest | Tropical forest | Total |
|---|---|---|---|---|---|
| Number of sites | 18 | 16 | 5 | 14 | 53 |
| Mean ANPP | 293 | 668 | 438 | 1,295 (n=13) | 666 (n=52 |
| Range | 35-774 | 76-1,706 | 198-690 | 682-2,320 | 35-2,320 |
| Mean BNPP | 926 (n=7) | 739 (n=11) | 275 (n=4) | 632 (n=7) | 686 (n=29) |
| Range | 60-1,745 | 147-1,832 | 20-500 | 260-1,117 | 20-1,832 |
| Mean TNPP | 1,283 | 1,462 (n=11) | 696 (n=4) | 2,048 (n=8) | 1,484 (n=30) |
| Range | 182-2,474 | 295-3,538 | 291-1,190 | 1,206-2,780 | 182-3,538 |
Notes: ANPP =above-ground net primary productivity, BNPP = below-ground net primary productivity, TNPP =total net primary productivity. All NPP estimates are based on plant dry matter accumulation, expressed as g/m2/year (dry matter weight). Number of study sites in range is given (n = 7) when this is less than the total number of sites for the biome. 1Includes one shrub-steppe site. Source: Updated from Scurlock and Olson (2002) based on values in this revised data set.
There are individual NPP data sets for each of the "intensive" study sites archived at ORNL DAAC [http://daac.ornl.gov/NPP/npp_home.html]. The individual data files contain additional biogeophysical data and information about the sites. NPP data for many of the "intensive" sites are also reported in DeAngelis et al. (1997), Esser (1998), and Olson et al. (2012a, b).
2. Data Description:
This data set contains one data file (comma-separated-value format) that provides NPP estimates and ancillary data for 34 grasslands, 14 tropical forest sites, and 5 boreal forest sites distributed worldwide.
Spatial Coverage
Site: Global (point)
Site Boundaries: (All latitude and longitude given in decimal degrees)
| Site (Region) | Westernmost Longitude | Easternmost Longitude | Northernmost Latitude | Southernmost Latitude |
|---|---|---|---|---|
| Global | (point)-115.5 | 146.27 | 66.37 | -45.6 |
Site Information
The data set contains NPP and summary climate data for 53 “intensive” study sites (34 grasslands, 14 tropical forests, and 5 boreal forests). Criteria for selecting “intensive” study sites included the availability of complete and consistent information on NPP or at least partial NPP (components such as litterfall or biomass increment), together with biomass (standing crop of live matter). Site-description metadata, such as latitude, longitude, and elevation, were considered essential for linking the data to model-driving climate variables (which may be interpolated from actual measurement stations to the NPP study sites). Information on vegetation type (biome), soil type, and land-use history was also a prerequisite for inclusion of a study site in the compilation. At least one reference was required from the peer-reviewed literature, although exceptions were occasionally made when the data were well-known in the research community (e.g., unpublished data from the Matador IBP grassland site, Canada).
Spatial Resolution
The boreal forest study plots were between 0.09 and 0.25 ha in size. The tropical forest study plots were between 0.0025 and 4.4 ha in size. The C3 grassland study plots were between 0.0025 and 0.7 ha in size. The C4 grassland study plots were between 0.06 and 0.25 ha in size.
Temporal Coverage
NPP and climate measurements cover the period 1939/01/01 through 1996/12/31.
Temporal Resolution
Generally one month for grasslands to one year for forests.
All NPP estimates are based on plant dry matter accumulation, expressed as g/m2/year (dry matter weight). Climate data are expressed as mean annual precipitation amounts (mm) and mean annual temperature (C).
Data File Information
Table 2. Data file in this data set archive
| FILE NAME | TEMPORAL COVERAGE | FILE CONTENTS |
|---|---|---|
| NPP_Multibiome_EnvReview_Table_A1_R1.csv | 1939/01/01-1996/12/31 | NPP and climate data for 34 grasslands, 14 tropical forest sites, and 5 boreal forest sites |
| NPP_Multibiome_References_by_Biome.pdf | 1939/01/01-1996/12/31 | References cited in “NPP_Multibiome_EnvReview_Table_A1_R1.csv” organized by biome |
NPP Data. NPP estimates are provided in one file (.csv format). The variable values are delimited by commas. The value -9999 is used to denote missing values. All NPP units are in g/m2/year (dry matter weight).
Table 3. Column headings in the NPP file NPP_Multibiome_EnvReview_Table_A1_R1.csv
| COLUMN HEADING | DEFINITION | UNITS |
|---|---|---|
| Code | Text code for site where data were gathered | Text |
| Sitename | Name of "intensive" study site | |
| Country | Country where site is located | |
| Latitude | Latitude of site | Decimal degrees |
| Longitude | Longitude of site | |
| Biome type | Biome description | Text |
| Mean annual precipitation | Mean annual precipitation at or near the site | mm |
| Mean annual temperature | Mean annual temperature at or near the site | C |
| ANPP | Above-ground net primary productivity | g/m2/year |
| BNPP | Below-ground net primary productivity | |
| TNPP | Total net primary productivity | |
| Reference | Published source of NPP data (See Reference section below for the list of publications) | Text |
Sample NPP Data Record
| Code, Sitename, Country, Latitude, Longitude, Biome type, Mean annual precipitation (mm), Mean annual temperature (C), ANPP (g/m2/year,) BNPP (g/m2/year), TNPP (g/m2/year), Reference cnl, Canal Flats, Canada, 50.20, -115.50, boreal forest, 630, 1.4, 690, 500, 1190, Comeau P.G., and J.P. Kimmins (1989) flk, Flakaliden, Sweden, 64.12, 19.45, boreal forest, 600, 4, 198, 93, 291, Bergh, J., S. Linder, T. Lundmark, and B. Elfving (1999) ... |
Companion File <NPP_Multibiome_References_by_Biome.pdf>
This file provides references cited in “NPP_Multibiome_EnvReview_Table_A1_R1.csv” organized by biome.
3. Data Application and Derivation:
Consistent data on terrestrial NPP are needed to constrain model estimates of carbon fluxes and hence to refine understanding of ecosystem responses to climate change. NPP field data also provide a range of values from diverse land cover types with which to compare satellite-based estimates. Most previously available data were only partial estimates of NPP (Scurlock et al., 1999).
This NPP database may be used for a variety of applications within the global carbon cycle research community: to re-examine worldwide patterns of NPP, to parameterize and evaluate global ecosystem models, and to calibrate and evaluate models driven by remotely sensed data. In addition, the NPP data play a role in the NASA EOS Validation program and are also suitable for addressing a variety of regional ecological problems.
The NPP data in this data set were compiled for the Global Primary Production Data Initiative (GPPDI) (Olson et al., 2012a; Prince et al., 1995). One of the first steps of GPPDI was to identify existing NPP field data sets and the associated environmental data (climate, soils, etc.) which might be needed to drive or parameterize NPP models, and to make them available online through data centers such as the NASA-funded ORNL DAAC.
The generation of this "benchmark" NPP data set, comprising both intensively documented study sites and also more extensive pre-existing data collections, was also a key resource in the Ecosystem Model-Data lntercomparison (EMDI) process (Olson et al., 2012b) to compare terrestrial carbon cycle models with field data, enabling the refinement of both the models and the data sets and an improved understanding of environmental controls on carbon allocation and carbon fluxes at various scales (Hibbard 2000).
This process of data resynthesis has added value to the original published information from the literature as well as providing a single point of access to data from many sites (Michener et al., 1997; Scurlock et al., 2002).
4. Quality Assessment:
Quality assurance included cross-checking the NPP records against other compilations of NPP data, eliminating duplicates or documenting multiple treatments at one study site, mapping the points in geographical space to confirm they coincided with the landforms, and checking data ranges for outlying values. The NPP data were provided or discovered in a variety of forms, ranging from tabulated computer text files to graphs from publications or theses. In addition, original authors or their successors were consulted to seek additional information, data updates and corrections, and permissions.
In common with many types of ecological and environmental data, criteria for “consistency” included the use of common systems of names (e.g., species, vegetation classes), units of measure, and place names. Conversion or translation was needed in many cases. Geographical coordinates were expressed as decimal degrees. In some cases, geospatial data (latitude, longitude, elevation) had to be reconstructed from maps, determining the location of an NPP study site from descriptions of its distance from the nearest town or other landmark.
Temporal resolution was a further aspect of data consistency. Exact dates of field sampling were rarely provided, although sampling intervals (weeks or months) were often specified for grasslands and year of measurement for forests. As far as possible, the date (day, month, year; or Julian date) of the NPP measurements was assigned as originally described in the literature or interpolated by digitizing published graphs. However, it must be realized that one "harvest interval" in the field may have been spread out over several days of field work and that different components (such as shoots and roots) may have been sampled on different dates.
Scurlock et al. (2002) examined various methods for estimating NPP from grassland biomass measurements for 31 sites. While that analysis demonstrated a potential bias of NPP estimates depending on which method was used, the grassland NPP estimates presented here rely primarily on the published estimates of NPP.
The statistics reported in this data set fall within the range of values reported for the 720 NPP records in the extensive Osnabrock data set (Esser 1998) and are comparable to those for the IBP Woodlands Data Set (DeAngelis et al., 1981, 1997). It was also instructive to compare this present data compilation with the NPP ranges reported a generation ago by Lieth (1975), commonly described as the "Lieth and Whittaker" synthesis (Lieth and Whittaker 1975), and still frequently cited. While the values in this data set fall within Lieth's typical ranges (considered representative for 1950), the mean values reported here for total NPP of grasslands are more than twice as high. The possible underestimation of grassland NPP by the International Biological Program has been discussed previously (Long et al., 1989; Scurlock and Hall 1998).
Sources of Error
See documentation for the individual NPP data set for each of the "intensive" study sites archived at ORNL DAAC [http://daac.ornl.gov/NPP/npp_home.html].
5. Data Acquisition Materials and Methods:
NPP Data. The data compilation process involved (l) identifying and prioritizing existing study sites and sources of NPP data (in consultation with the ecophysiological field research community); (2) acquiring the data for the priority sites, together with accompanying descriptive material (documentation); (3) performing quality assurance checks, reformatting the data and documentation, and entering them into the database;, and then (4) seeking review and authorization for these data before making them publicly available.
Criteria for selecting intensive study sites included the availability of complete and consistent information on NPP or at least partial NPP (components such as litterfall or biomass increment), together with biomass (standing crop of live matter). Site-description metadata, such as latitude, longitude, and elevation, were considered essential for linking the data to model-driving climate variables (which may be interpolated from actual measurement stations to the NPP study sites). Information on vegetation type (biome), soil type, and land-use history was also a prerequisite for inclusion of a study site in the compilation. At least one reference was required from the peer-reviewed literature, although exceptions were occasionally made where the data were well known in the research community (e.g., unpublished data from the Matador IBP grassland site, Canada).
Climate Data. Mean annual average temperature and mean annual precipitation data were compiled from the literature source containing the NPP data, when available. In addition, or when no climate data were published, monthly climate data were compiled for each study site to provide 5-100 years of record (precipitation, mean monthly maximum temperature, mean monthly minimum temperature). If possible, these data were obtained from the original literature or the original authors. Alternatively, the climate data were obtained from the nearest weather station (<10 km distant, and at similar elevation) available from existing collections such as the NOAA National Climatic Data Center (NCDC), Asheville, NC, USA or the Carbon Dioxide Information and Analysis Center (CDIAC), Oak Ridge National Laboratory, Oak Ridge, TN, USA. In some cases, annual mean climatic values were generated from the monthly data, which are available for individual sites on the ORNL DAAC NPP web site [http://daac.ornl.gov/NPP/npp_home.html].
6. Data Access:
These data are available through the Oak Ridge National Laboratory (ORNL) Distributed Active Archive Center (DAAC).
Data Archive Center:
Contact for Data Center Access Information:
E-mail: uso@daac.ornl.gov
Telephone: +1 (865) 241-3952
7. References:
DeAngelis, D.L., Gardner, R.H., and Shugart, H.H. 1981. Productivity of forest ecosystems studied during the IBP: the woodlands data set, pp. 567-672. IN: Reichle, D.E. (ed.). Dynamics of Forest Ecosystems. IBP 23. Cambridge University Press, Cambridge, U.K.
DeAngelis, D.L., R.H. Gardner, and H.H. Shugart. 1997. NPP Multi-Biome: Global IBP Woodlands Data, 1955-1975. Data set. Available on-line [http://daac.ornl.gov] from Oak Ridge National Laboratory Distributed Active Archive Center, Oak Ridge, Tennessee, U.S.A. doi:10.3334/ORNLDAAC/198
Esser, G. 1998. NPP Multi-Biome: Global Osnabrück Data, 1937-1981. Data set. Available on-line [http://daac.ornl.gov] from Oak Ridge National Laboratory Distributed Active Archive Center, Oak Ridge, Tennessee, U.S.A. doi:10.3334/ORNLDAAC/214
Esser, G. 1991. Osnabruck Biosphere Model: structure, construction, results, pp. 679-709. IN: Esser, G., and D. Overdieck (eds.). Modem Ecology: Basic and Applied Aspects. Elsevier, Amsterdam and London.
Hibbard, K. 2000. EMDI update. Research GAIM (Newsletter of the Global Analysis, Interpretation and Modeling task force). Vol. 4, No. 1. GAIM Project Office, University of New Hampshire, Durham, N.H., U.S.A.
Lieth, H.F.H. 1975. Primary production of the major vegetation units of the world, pp. 203-215. IN: Lieth, H., and R.H. Whittaker (EDS.). Primary Productivity of the Biosphere. Ecological Studies 14. Springer-Verlag, New York and Berlin. 339 p.
Lieth, H, and Whittaker, R.H. (eds). 1975. Primary Productivity of the Biosphere. Ecological Studies 14. Springer-Verlag, New York and Berlin, 339 p.
Long, S.P., E. Garcia Moya, S.K. Imbamba, A. Kamnalrut, A., M.T.F Piedade, J.M.O. Scurlock,Y.K. Shen, and D.O. Hall. 1989. Primary productivity of natural grass ecosystems of the tropics: a reassessment. Plant Soil 1l5: 155-166.
Michener, W.K., J.W. Brunt, J.J. Helly, T.B. Kirchner, and S.G. Stafford. 1997. Nongeospatial metadata for the ecological sciences. Ecol. Appl. 7: 330-342.
Olson, R. J., K.R. Johnson, D.L. Zheng, and J.M.O. Scurlock. 2001. Global and Regional Ecosystem Modeling: Databases of Model Drivers and Validation Measurements. ORNL Technical Memorandum TM-2001/196. Oak Ridge National Laboratory, Oak Ridge, Tennessee, U.S.A.
Olson, R.J., J.M.O. Scurlock, S.D. Prince, D.L. Zheng, and K.R. Johnson (eds.). 2012a. NPP Multi-Biome: Global Primary Production Data Initiative Products, R2. Data set. Available on-line [http://daac.ornl.gov] from the Oak Ridge National Laboratory Distributed Active Archive Center, Oak Ridge, Tennessee, U.S.A. doi:10.3334/ORNLDAAC/617
Olson, R.J., J.M.O. Scurlock, S.D. Prince, D.L. Zheng, and K.R. Johnson (eds.). 2012b. NPP Multi-Biome: NPP and Driver Data for Ecosystem Model-Data Intercomparison, R2. Data set. Available on-line [http://daac.ornl.gov] from the Oak Ridge National Laboratory Distributed Active Archive Center, Oak Ridge, Tennessee, U.S.A. doi:10.3334/ORNLDAAC/615
Prince, S.D., R.J. Olson, G. Dedieu, G. Esser, and W. Crame. 1995. Global Primary Production Data Initiative Project Description. IGBP-DIS Working Paper No. 12, International Geosphere-Biosphere Programme Data and Information System, Toulouse, France. 38 p.
Scurlock, J.M.O., and D.O. Hall. 1998. The global carbon sink: a grassland perspective. Global Change Biol. 4: 229-233.
Scurlock, J.M.O., and R.J. Olson. 2002. Terrestrial net primary productivity - A brief history and a new worldwide database. Environmental Reviews 10(2): 91-109.
Scurlock, J.M.O., W. Cramer, R.J. Olson, W.J. Parton, and S.D. Prince. 1999. Terrestrial NPP: towards a consistent data set for global model evaluation. Ecol. Appl. 9(3): 913-919.
Scurlock, J.M.O., R.L. Olson, R.A. McCord, and W.K Michener. 2002. Environmental data banks: archiving ecological data and information, pp. 248-259. IN: Munn, E. (ed.). Encyclopedia of Global Environmental Change. Vol. 2: The Earth System: Biological and Ecological Dimensions of Global Environmental Change, Ecosystems section. Mooney, H., and J. Canadell (eds.). John Wiley, Chichester, Sussex, U.K.
Data Sources Cited in the NPP Data File:
Abrams, M.D., A.K. Knapp, and L.C. Hulbert. 1986. A ten year record of above-ground biomass in a Kansas tallgrass prairie: effects of fire and topographic position. American J. Botany 73: 1509-1515.
Bergh, J., S. Linder, T. Lundmark, and B. Elfving. 1999. The effect of water and nutrient availability on the productivity of Norway spruce in northern and southern Sweden. Forest Ecology and Management 119: 51-62.
Bertiller, M.B. 1984. Specific primary productivity dynamics on arid ecosystems: a case study in Patagonia, Argentina. Acta Oecologica/Oecologia Generalis 5: 365-381.
Chave, J., R. Condit, S. Lao, J. P. Caspersen, R. B. Foster, and S. P. Hubbell. 2003. Spatial and temporal variation of biomass in a tropical forest: results from a large census plot in Panama. Journal of Ecology 91: 240-252.
Christie, E. K. 1978. Ecosystem processes in semi-arid grasslands. I. Primary production and water use of two communities possessing different photosynthetic pathways. Australian J. Agricultural Research 29: 773-787.
Comeau P. G. and J. P. Kimmins. 1989. Above-ground and below-ground biomass and production of lodgepole pine on sites with differing soil-moisture regimes. Canadian J. Forest Research 19: 447-454.
Condit, R., S. P. Hubbell, and R. B. Foster. 1995. Mortality rates of 205 neotropical tree and shrub species and the impact of a severe drought. Ecological Monographs 65: 419-439.
Coupland, R.T. 1973. Producers: I. Dynamics of Aboveground Standing Crop. Technical Report No. 27, Matador Project, Canadian Committee for the International Biological Program, University of Saskatchewan, Saskatoon.
Daubenmire, R. 1972. Standing crops and primary production in savanna derived from semi-deciduous forest in Costa Rica. Botanical Gazette 133: 395-401.
DeAngelis, D.L., R.H. Gardner, and H.H. Shugart. 1981. Productivity of forest ecosystems studied during the IBP: the woodlands data set (Oulu/Kuusamo site, p. 582). In: Reichle, D.E., ed. Dynamic Properties of Forest Ecosystems, IBP 23. Cambridge University Press, Cambridge. 683 pp.
Defosse, G. E., M. B. Bertiller, and J. O. Ares. 1990. Above-ground phytomass dynamics in a grassland steppe of Patagonia, Argentina. J. Range Management 43, 157-160.
Donaldson, C. H., G. Rootman, and D. Grossman. 1984. Long-term nitrogen and phosphorus application to veld. Journal of the Grassland Society of Southern Africa 1(2): 27-32.
Fassbender, H.W., and U. Grimm. 1981. Ciclos bioquimicos en un ecosistema forestal de los Andes Occidentales de Venezuela. II. Produccion y descomposicion de los residuos vegetales. Turrialba 31: 39-47.
Folster, H., G. de las Salas, and P. Khanna. 1976. A tropical evergreen forest site with perched water table, Magdalena valley, Colombia: biomass and bioelement inventory of primary and secondary vegetation. Oecologia Plantarum 11: 297-320.
Garcia-Moya, E., and P. Montanez C. 1992. Saline grassland near Mexico City, pp. 70-99. In: Long, S.P., M.B. Jones and M.J. Roberts (eds.). Primary Productivity of Grass Ecosystems of the Tropics and Subtropics. Chapman and Hall, London.
Gilmanova, T.G., W.J. Parton, and D.S. Ojima. 1997. Testing the ‘CENTURY’ ecosystem level model on data sets from eight grassland sites in the former USSR representing a wide climatic/soil gradient. Ecological Modelling 96(1–3): 191–210.
Golley, F.B., J.T. McGinnis, R.G. Clements, G.I. Child, and M.J. Duever. 1975. Mineral Cycling in a Tropical Moist Forest Ecosystem. University of Georgia Press, Athens. 248 pp.
Hall, F.G., K.F. Huemmrich, D.E. Strebel, S.J. Goetz, J.E. Nickeson, and K.D. Woods. 1992. Biophysical, Morphological, Canopy Optical Property, and Productivity Data From the Superior National Forest. NASA Technical Memorandum 104568. Goddard Space Flight Center, National Aeronautics and Space Administration. Greenbelt, Maryland, U.S.A.
Havas, P., and E. Kubin. 1983. Structure, growth and organic matter content in the vegetation cover of an old spruce forest in northern Finland. Annales Botanici Fennici 20, 115-149.
Hopkins, B. 1968. Vegetation of the Olokemeji Forest Reserve, Nigeria: V. The vegetation on the savanna site with special reference to its seasonal changes. J. Ecology 56: 97-115.
John, D.M. 1973. Accumulation and decay of litter and net production of forest in tropical West Africa. Oikos 24: 430-435.
Jordan, C.F. (ed.). 1989. An Amazonian Rain Forest: Structure and Function of a Nutrient-stressed Ecosystem and the Impact of Slash-and-Burn Agriculture. UNESCO-MAB/Parthenon, Carnforth, UK. 176 pp.
Kamnalrut, A., and J.P. Evenson. 1992. Monsoon grassland in Thailand, pp. 100-126. In: Long, S.P., M.B. Jones and M.J. Roberts (eds.). Primary Productivity of Grass Ecosystems of the Tropics and Subtropics. Chapman and Hall, London.
Kinyamario, J.I. and S.K. Imbamba (1992) Savanna at Nairobi National Park, Nairobi, pp. 25-69. In: Long, S.P., M.B. Jones and M.J. Roberts (eds.). Primary Productivity of Grass Ecosystems of the Tropics and Subtropics. Chapman and Hall, London.
Kira, T. 1978. Primary productivity of Pasoh Forest - a synthesis. Malaysian Nature Journal 30: 291-297.
Kira T., and T. Shidei. 1967. Primary production and turnover of organic matter in different forest ecosystems of the western Pacific. Japanese Journal of Ecology 17: 70-87.
Kira, T., H. Ogawa, K. Yoda, and K. Ogino. 1964. Primary production by a tropical rain forest of Southern Thailand. Botanical Magazine Tokyo 77: 428-429.
Lauenroth, W.K. and O.E. Sala. 1992. Long-term forage production of North American shortgrass steppe. Ecological Applications 2: 397-403.
Lugo, A.E. 1992. Comparison of tropical tree plantations with secondary forests of similar age. Ecological Monographs 62: 1-41.
Martinez-Yrizar, A., J.M. Maass, L.A. Perez-Jimenez, and J. Sarukhan. 1996. Net primary productivity of a tropical deciduous forest ecosystem in western Mexico. Journal of Tropical Ecology 12: 169-175.
McDade, L.A., K.S. Bawa, H.A. Hespenheide, and G.S. Hartshorn (eds.). 1994. La Selva: Ecology and Natural History of a Neotropical Rain Forest. University of Chicago Press. 486 pp.
Menaut, J-C. and J. Cesar. 1979. Structure and primary productivity of Lamto savannas, Ivory Coast. Ecology 60: 1197-1210.
Pandey, C.B., and J S. Singh. 1992. Rainfall and grazing effects on net primary production in a tropical savanna, India. Ecology 73: 2007-2021.
Persson, T. (ed.). 1980. Structure and Function of Northern Coniferous Forests: An Ecosystem Study. Ecological Bulletins (Stockholm), No. 32. 609 pp.
San Jose, J.J., and Y.E. Medina. 1976. Organic matter production in the Trachypogon savanna at Calabozo, Venezuela. Tropical Ecology 17: 113-124.
Scholes, R.J., and B.H. Walker. 1993. An African Savanna: synthesis of the Nylsvley study. Cambridge University Press. 306 pp.
Singh, J.S., and P.S. Yadava. 1974. Seasonal variation in composition, plant biomass and net primary productivity of a tropical grassland at Kurukshetra, India. Ecological Monographs, 44: 351-376.
Sims, P.L., and J.S. Singh. 1978. The structure and function of ten western North American grasslands. III. Net primary production, turnover and efficiencies of energy capture and water use. Journal of Ecology 66: 573-597.
Sims, P.L., J.S. Singh and W.K. Lauenroth. 1978. The structure and function of ten western North American grasslands. I. Abiotic and vegetational characteristics. Journal of Ecology 66, 251-285.
Stocker, G. C., W. A. Thompson, A. K. Irvine, J. D. Fitzsimon, and P. R. Thomas. 1995. Annual patterns of litterfall in a lowland and tableland rainforest in tropical Australia. Biotropica 27: 412-420.
Tanner, E.V.J. 1980. Studies on the biomass and productivity in a series of montane rain forests of Jamaica. Journal of Ecology 68: 573-588.
Togtohyn, C. 1996. Net primary production for Tumentsogt (Mongolia) grassland site dataset. In Togtohyn, Chuluun and D.S. Ojima (eds.). Simulation Studies of Grazing in the Mongolian Steppe. Proceedings of the Fifth International Rangeland Congress (Vol. 1). Society of Range Management, Denver, CO, USA.
Vitousek, P.M. 1984. Litterfall, nutrient cycling, and nutrient limitation in tropical forests. Ecology 65: 285-298.
Wallentinus, H.G. 1973. Above-ground primary production of a Juncetum gerardi on a Baltic sea-shore meadow. Oikos 24: 200-219.
Weaver, P. L. 1996. Forest productivity in the Cinnamon Bay Watershed, St. John, U.S. Virgin Islands. Caribbean Journal of Science 32: 89-98.
Weaver, P. L. 2006. A Summary of 20 Years of Forest Monitoring in Cinnamon Bay Watershed, St. John, U.S. Virgin Islands. United States Department of Agriculture, Forest Service, International Institute of Tropical Forestry, General Technical Report IITF-34.
Williamson, P. 1976. Above-ground primary production of chalk grassland allowing for leaf death. Journal of Ecology 64: 1059-1075.
Xiao, X.M., D. Chen, Y.M. Peng, X.Y. Cui, and D.S. Ojima. 1996. Observation and modeling of plant biomass of meadow steppe in Tumugi, Xingan league, Inner Mongolia, China. Vegetatio 127(2): 191-201.
Xiao X., W. Yifeng, J. Shu, D.S. Ojima and C.D. Bonham. 1995. Interannual variation in the climate and aboveground biomass of Leymus chinense steppe and Stipa grandis steppe in the Xilin river basin, Inner Mongolia, China. Journal of Arid Environments 31: 283-299.
8. Data Set Revisions:
Revision Summary:
This data file has been revised to add a negative sign to south latitude and west longitude decimal degree coordinates and removed the compass direction (N, S, E, W) for coordinates. NPP data for Vindhyan, India; Atherton, Australia; John Crow Ridge, Jamaica; and La Selva, Costa Rica have been revised to correct previously reported values. Additional data references for Kuusamo, Finland and La Selva, Costa Rica have been added.
Data File Changes (all units are g/m2/yr)
Notes:
All units are g/m2/yr.
The column heading "Uncorrected" refers to the file NPP_Multibiome_Env-Review_Table_A1.xls.
The column heading "Corrected" refers to the file NPP_Multibiome_Env-Review_Table_A1_R1.csv.
| Site | Parameter* | Uncorrected | Corrected | Source |
|---|---|---|---|---|
| Vindhyan, India | BNPP | 1,237 | 619 | Pandey and Singh (1992) |
| TNPP | 1,775 | 1,157 | ||
| Atherton, Australia | ANPP | 984 | 1,103.1 | Stocker et al. (1995) |
| Barro Colorado, Panama | ANPP | 1,320 | 1,800 | Chave et al. (2003) |
| John Crow Ridge, Jamaica | ANPP | 956 | 987.3 | Tanner (1980) |
| La Selva, Costa Rica | ANPP | 950 | 850 | McDade et al. (1994) |
| TNPP | 1,850 | 1,750 |
* = See data set Guide document for parameter definitions.
Data User Action: If you downloaded the referenced data set from the ORNL DAAC on-line archive before July 15, 2013, you should download it again from the ORNL DAAC.
Revision History:
Original Citation:
Scurlock, J.M.O., and R.J. Olson. 2003. NPP Multi-Biome: Grassland, Boreal Forest, and Tropical Forest Sites, 1939-1996. Data set. Available on-line [http://daac.ornl.gov] from Oak Ridge National Laboratory Distributed Active Archive Center, Oak Ridge, Tennessee, U.S.A.