Get Data
Summary:
This data set contains one net primary productivity (NPP) data file and three climate data files (.txt format) for a fully closed tropical rainforest in the Khao Chong Reserve (7.58 N 99.8 E) in southern Thailand. The Reserve comprises 500 ha of well-preserved rainforest considered typical of the region, although maximum tree height (36 m) and biodiversity were less than in Malaysian forests.
Net primary productivity (NPP) was estimated as the sum of annual net above-and below-ground biomass increase plus extrapolated annual litterfall and tree mortality. Biomass increment for trees > 4.5 cm diameter at breast height (DBH) was monitored between 1962 to 1965, and daily litterfall was measured for one month in 1962. Total NPP was estimated at 2,860 g/m2/year. This value includes a possible over-estimate of litterfall (2,330 g/m2/year) plus above-ground woody biomass increment and turnover as mortality combined (489 g/m2/year) plus below-ground woody biomass increment (41 g/m2/year). Fine root turnover and herbivory were not included in these estimates. Allometric relationships for estimating above-ground biomass were checked by destructive harvest. Leaf area index was relatively high at 11.4-12.3 m2/m2.
Long-term climate data for Khao Chong are available from weather stations at Songkhla, Thailand (7.2 N 100.6 E) and Trang, Thailand (7.52 N 99.62 E). Depending on station location and temporal coverage, mean annual temperature is 27.2-27.4 C and mean annual precipitation is between 1,928 and 2,696 mm.
Revision Notes: Only the documentation for this data set has been modified. The data files have been checked for accuracy and are identical to those originally published in 1998.
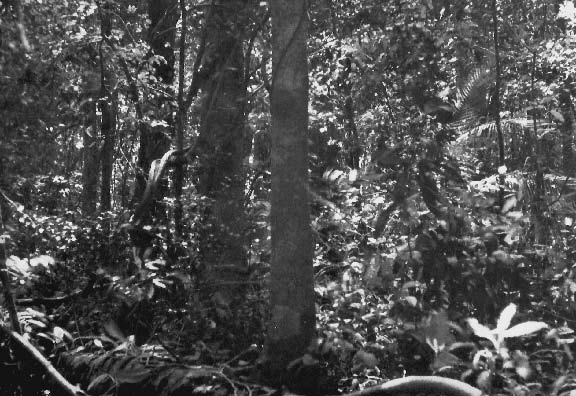
Figure 1. Eye-level view of interior of Stand 4 (fully closed tropical rain forest) at Khao Chong Nature Reserve. (Note the dense undergrowth of woody plants, thick stems of woody lianas and a decaying log on the ground. A rattan plant with feather-like leaves is on the left. Photograph taken January 1962 by Dr. K. Yoda, Osaka City University, Japan). Reproduced by kind permission of Prof. Tatuo Kira and Prof. Husato Ogawa.
Additional Documentation:
The NPP data collection contains field measurements of biomass, estimated NPP, and climate data for terrestrial grassland, tropical forest, boreal forest, and tundra sites worldwide. Data were compiled from the published literature for intensively studied and well-documented individual field sites and from a number of previously compiled multi-site, multi-biome data sets of georeferenced NPP estimates. The principal compilation effort (Olson et al., 2001) was sponsored by the NASA Terrestrial Ecology Program. For more information, please visit the NPP web site at http://daac.ornl.gov/NPP/npp_home.html.
Data Citation:
Cite this data set as follows:
Kira, T. 2013. NPP Tropical Forest: Khao Chong, Thailand, 1962-1965, R1. Data set. Available on-line [http://daac.ornl.gov] from Oak Ridge National Laboratory Distributed Active Archive Center, Oak Ridge, Tennessee, USA. doi:10.3334/ORNLDAAC/217
Kira, T. 1998. NPP Tropical Forest: Khao Chong, Thailand, 1962-1965. Data set. Available on-line [http://daac.ornl.gov] from Oak Ridge National Laboratory Distributed Active Archive Center, Oak Ridge, Tennessee, U.S.A.
Table of Contents:
- 1 Data Set Overview
- 2 Data Description
- 3 Applications and Derivation
- 4 Quality Assessment
- 5 Acquisition Materials and Methods
- 6 Data Access
- 7 References
1. Data Set Overview:
Project: Net Primary Productivity (NPP)
The NPP measurement for a fully closed tropical rainforest in the Khao Chong Nature Reserve is the sum of annual net above- and below-ground woody biomass increase + extrapolated annual litterfall + tree mortality.
This study was conducted under the auspices of the Joint Thai-Japanese Biological Expedition to South-East Asia. The Khao Chong Nature Reserve (7.58 N 99.8 E) is comprised of some 500 ha of well-preserved rainforest on the west slope of the Malay Peninsula's central granitic range in southern Thailand, about 22 km west of the town of Trang. The forest is considered typical of the region, although maximum tree height (36 m) and biodiversity are less than in Malaysian forests, probably owing to the effects of short dry season in winter and of the sandy texture of soil of granitic origin.
Biomass increment within a 40-m x 40-m study area for all trees greater than 4.5-cm DBH (diameter at breast height, 130 cm) was monitored between 1962 to 1965, and daily litterfall was measured for one month in 1962. Allometric relationships for estimating biomass of various components were checked by destructive harvesting of a plot 10 m x 40 m.
Climate data come from weather stations near the study site. Mean annual temperature is 27.2-27.4 C, and mean annual precipitation is between 1,928 and 2,696 mm, depending on location of weather station and temporal coverage of climatic data. Only three months (January - March) receive less than 100-mm precipitation.
Biomass data are available for stems, branches, roots, and leaves for February 1962, July 1963, and March 1965 and accumulated litter on the forest floor from January 13, 1962 to February 24, 1962. Leaf area index is relatively high at 11.4 m2/m2 (or 12.3 m2/m2 including ground cover). NPP of the forest was estimated at 2,860 g/m2/year. This value includes a possible over-estimate of litterfall (2,330 g/m2/year) plus above-ground woody biomass increment and turnover as mortality combined (489 g/m2/year) plus below-ground woody biomass increment (41 g/m2/year) (Kira et al., 1964; 1967). Fine root turnover and grazing were not included in the above estimates.
ANPP, BNPP, and TNPP values reported in Esser (1998), Scurlock and Olson (2012), Olson et al. (2013a, b), and Clark et al. (2001a, 2013) differ from values presented herein due to different calculation methods (Table 1).
Table 1. ANPP, BNPP, and TNPP values reported by various published data sources
| File Name or Description | Data Source(s) | Sub-Site | ANPP | BNPP | TNPP |
|---|---|---|---|---|---|
| gC/m2/year | |||||
| khc_npp.txt | Kira et al. (1964, 1967)1 | khc Stand 4/5 | 1,410 | 21 | 1,430 |
| ods_xls.csv | Esser (1998) based on Kira and Shidei (1967) | 750 (Stand 4/5) | 1,462 | 28 | 1,489 |
| NPP_Multibiome_EnvReview _Table_A1_R1.csv | Scurlock and Olson (2012) based on Kira et al. (1964) | khc (Stand 4/5) | NA | NA | 1,125 |
| GPPDI_ClassA_NPP_162_R2.csv | Olson et al. (2013a); Clark et al. (2001a)2 based on Kira et al. (1964) | Class A 46 (MI 47) (Stand 4/5) | 987 | 691 | 1,678 |
| EMDI_ClassA_NPP_81_R2.csv | Olson et al. (2013b); Clark et al. (2001a)2 based on Kira et al. (1964) | Class A 46 (Stand 4/5) | 987 | 691 | 1,678 |
| Table 1 in Clark et al. (2001a) | Clark et al. (2001a)2 based on Kira et al. (1964) | Khaochong | 990 | 200-1,180 (av 690) | 1,180-2,170 (av 1,675) |
| tropfornpp.csv | Clark et al. (2013)3 based on Kira et al. (1967) | Thailand-Khao Chong | 1,471 | NA | NA |
Notes: NA = Not available. MI = Measurement ID number.
The differences in NPP values reported in this table are mainly due to differences in calculation methods, as explained in these notes. Please consult original references for details.
Revised data sets (R1, R2, etc) are accompanied by ORNL DAAC Data Set Change Information files. Please see the corresponding documentation for reasons why the data values were revised.
1For this table, NPP data from the original data source were converted from grams of dry weight per meter square per year to grams of carbon per meter square per year using a conversion factor of 0.5. NPP was estimated as the sum of annual net increase in above and below-ground biomass + extrapolated annual litterfall + tree mortality.
2Clark et al. (2001a) used a different approach to calculate NPP values. ANPP was calculated by summing reported above-ground biomass increment + reported fine litterfall + estimated losses to consumers + estimated VOC emissions. BNPP was calculated by summing 0.2 x estimated ANPP for a low BNPP estimate + 1.2 x estimated ANPP for a high BNPP estimate. TNPP was calculated as the range between the low and high values of ANPP + BNPP. Average BNPP and TNPP estimates were also calculated. See Clark et al. (2001a) for a discussion of calculation methods, including how unmeasured components of ANPP were estimated and the basis for setting bounds on BNPP.
3Based on litterfall + branchfall + above-ground biomass increment in Clark et al. (2001b) using a carbon conversion factor of 0.5.
2. Data Description:
Spatial Coverage
Site: Khao Chong, Thailand
Site Boundaries: (All latitude and longitude given in decimal degrees)
| Site (Region) | Westernmost Longitude | Easternmost Longitude | Northernmost Latitude | Southernmost Latitude | Elevation (m) |
|---|---|---|---|---|---|
| Khao Chong, Thailand | 99.8 | 99.8 | 7.58 | 7.58 | NA |
Spatial Resolution
The study areas (Stand 4 and 5) were 40-m x 40-m each. Data are the average of the two plots. Clear-felling of trees to determine allometric equations occurred in a 10 m x 40 m sub-plot in Stand 4. Litterfall was collected in a 0.9 m x 12 m sub-plots in both stands.
Temporal Coverage
In January and February of 1962, the census of dbh and height was taken of all trees over 4.5 cm dbh in two sample plots (Stand 4 and 5). Allometric relationships for estimating biomass of various components were checked by destructive harvest of Stand 4 in February 1962. Non-destructive biomass measurements were made in Stand 5 on February 4, 1962, July 21, 1963, and March 30, 1965. Annual increment of the total tree biomass on Stand 5 was calculated from the difference between the estimations.
Litter accumulation was monitored from January 13, 1962 to February 9, 1962 (Stand 4) and February 9 to 24, 1962 (Stand 5). LAI was measured at Stand 4 on February 4, 1962 before clear-felling was completed.
Climate data are available from four time periods: 1956/01/01 through 1961/12/31 (mean); 1981/01/01 through 1990/10/30 (average temperature); 1958/01/01 through 1976/12/31 (precipitation amount); and 1951/01/01 through 1990/12/31 (minimum/maximum temperature; precipitation amount).
Temporal Resolution
Biomass harvest was made once at Stand 4, and biomass increment measurements were made on three occasions at Stand 5. Litterfall was measured daily in Stand 4 and 5. LAI was measured once.
All NPP estimates are based on plant dry matter accumulation, expressed as g/m2/year (dry matter weight).
Climate data are expressed as monthly and annual precipitation amounts (mm), monthly and annual average temperature (C), and monthly and annual average maximum/minimum temperature (C). Monthly and annual climatic means are provided for the 1951-1990 period (minimum/maximum temperature; precipitation) and 1956-1961 (precipitation).
Data File Information
Table 2. Data files in this data set archive
| FILE NAME | TEMPORAL COVERAGE | FILE CONTENTS |
|---|---|---|
| khc_npp.txt | 1962/02/04-1965/03/30 | Above- and below ground biomass, litter accumulation, LAI, and NPP data for a fully closed tropical rainforest at Khao Chong, Thailand |
| khc1_cli.txt | 1956/01/01-1961/12/31 | Mean precipitation amount over 6 years from weather station near Khao Chong, Thailand |
| khc2_cli.txt | 1958/01/01-1990/10/30 | Monthly and annual climate data from weather station at Trang, Thailand about 22 km from the Khao Chong study site |
| khc3_cli.txt | 1951/01/01-1990/12/31 | Mean monthly and annual climate data from weather station at Songkhla, Thailand near the Khao Chong study site |
NPP Data
NPP estimates for the Khao Chongsite are provided in one text file (.txt) (Table 1). The variable values are delimited by semicolons. The first 18 lines are metadata; data records begin on line 19. The value -999.9 is used to denote missing values. Biomass and NPP units are in g/m2 and g/m2/year (dry matter weight), respectively.
Table 3. Column headings in NPP file
| Column Heading | Description | Units |
|---|---|---|
| Site | Site where data were gathered (code refers to site identification) | Text |
| Treatmt | Subsite(s) where data were gathered | Text |
| Year | Year in which data were collected | Numeric |
| Month | Month in which data were collected | |
| Day | Day on which data were collected | |
| parameter | Parameters measured (see definitions in Table 4) | Text |
| amount | Data values | Numeric |
| units | Unit of measure | Text |
Table 4. Parameter definitions in NPP file
| Parameter | Description | Units | Source |
|---|---|---|---|
| leaves | Leaf biomass1 | g/m2 | Table 12; Table 43 |
| branches | Branch biomass1 | ||
| trunks | Trunk biomass1 | ||
| newrecruits | Biomass of trees newly recruited during period | g/m2 | Table 43 |
| AGtotdead | Biomass of trees which died between sampling periods | ||
| Undstory | Understory biomass | g/m2 | Table 12 |
| Totroots | Root biomass1 | g/m2 | Table 12; Table 43 |
| leaflitter | Leaf litter accumulation between sampling periods | g/m2 | Table 53 |
| branchlitter | Branch litter accumulation between sampling periods | ||
| otherlitter | Other litter accumulation between sampling periods | ||
| Totlitter | Total litter accumulation between sampling periods | ||
| LAI_trees | Leaf area index of trees > 4.5 cm DBH (live minus dead tree LAI) | m2/m2 | Table 43 |
| LAI | Leaf area index, including ground vegetation | m2/m2 | Table 12; Kira et al. (1967) |
| ANPP | Estimated litter accumulation + above-ground woody biomass increment + mortality | g/m2/year | Kira et al. (1967) |
| BNPP | Estimated below-ground woody biomass increment | ||
| NPP | Estimated total net primary production | Sum of above from Kira et al. (1967) |
Notes:
11963 and 1965 data are based on annual rate of biomass increase from the initial 1962 measurement.
2Kira et al. (1964). 3Kira et al. (1967).
Sample NPP Data Record
| Site; Treatmt; Year; Month; Day;
parameter; amount; units khc; Stand4/5; 1962; 2; 4; leaves; 820; g/m2 khc; Stand4/5; 1963; 7; 21; leaves; 833; g/m2 khc; Stand4/5; 1965; 3; 30; leaves; 859; g/m2 khc; Stand4/5; 1962; 2; 4; branches; 8000; g/m2 khc; Stand4/5; 1963; 7; 21; branches; 8203; g/m2 khc; Stand4/5; 1965; 3; 30; branches; 8544; g/m2 khc; Stand4/5; 1962; 2; 4; trunks; 21600; g/m2 khc; Stand4/5; 1963; 7; 21; trunks; 21080; g/m2 khc; Stand4/5; 1965; 3; 30; trunks; 21913; g/m2 ... |
Climate Data. The climate data set is a text file (.txt format). The first 18 lines are metadata; data records begin on line 19. The variable values are delimited by semicolons. The value -999.99 is used to denote missing values.
Sample Climate Data Record <khc1_cli.txt>
| parameter year Jan Feb Mar Apr May June
July Aug Sept Oct Nov Dec Total prec mean 72.0 34.0 70.0 144.0 259.0 227.0 259.0 302.0 403.0 355.0 325.0 246.0 2696.0 Where, prec = precipitation for month or year (mm) mean = mean over 6 years (1956-1961) reported in table |
Sample Climate Data Record <khc2_cli.txt>
| parameter year Jan Feb Mar Apr May June
July Aug Sept Oct Nov Dec Total/Avg parameter year Jan Feb Mar Apr May June July Aug Sept Oct Nov Dec Total/Avg tavg men1 26.7 27.6 28.7 29.0 28.0 27.7 27.2 27.4 27.0 27.1 26.8 26.4 27.4 prec men2 60.1 28.4 48.8 100.1 263.2 246.5 256.7 266.8 343.7 291.9 249.9 119.2 2275.3 tavg 1981 26.10 27.80 28.80 28.80 28.30 28.00 27.30 28.00 27.10 27.30 26.30 25.80 27.5 tavg 1982 26.50 27.30 28.80 28.50 28.10 27.80 26.80 27.30 27.10 27.10 27.30 26.51 27.4 tavg 1983 27.50 28.00 28.80 29.50 28.60 28.00 27.50 27.10 27.10 27.10 26.80 26.30 27.7 tavg 1984 26.10 27.30 28.10 28.30 27.80 26.80 26.80 27.50 27.00 26.80 27.00 26.10 27.1 tavg 1985 26.30 27.80 27.80 28.30 27.60 27.30 26.50 26.80 26.50 26.50 26.30 26.11 27.0 tavg 1986 25.80 27.10 28.50 29.10 27.60 27.60 27.30 27.60 26.50 26.60 26.50 26.61 27.2 tavg 1987 26.60 26.80 29.00 29.80 28.00 28.30 27.80 27.30 27.60 27.60 27.00 26.10 27.7 tavg 1988 27.10 28.80 29.30 29.60 28.10 27.60 27.30 27.50 26.80 27.00 26.10 26.00 27.6 tavg 1989 27.10 26.10 28.00 27.61 27.30 27.10 26.50 26.31 26.51 26.60 28.00 27.82 27.1 tavg 1990 27.80 29.30 29.80 30.00 28.80 28.50 28.00 28.60 27.50 28.10-999.99-999.99 -999.9 prec 1958 16.00 1.00 32.00 46.00 328.00 487.00 181.00 290.00 189.00 443.00 267.00 2.00 2282.0 prec 1959 41.00 0.00 82.00 97.00 165.00 101.00 421.00 311.00 264.00 202.00 290.00 147.00 2121.0 prec 1960 12.00 21.00 79.00 95.00 333.00 235.00 287.00 222.00 339.00 168.00 293.00 58.00 2142.0 prec 1961 71.00 90.00 62.00 124.00 220.00 170.00 183.00 230.00 326.00 306.00 168.00 132.00 2082.0 prec 1962 20.00 16.00 54.00 267.00 207.00 144.00 232.00 255.00 527.00 425.00 196.00 146.00 2489.0 prec 1963 35.00 0.00 3.00 3.00 185.00 255.00 145.00 286.00 438.00 369.00 246.00 70.00 2035.0 … Where, prec = precipitation for month or year (mm) tavg = average temperature for month or year (C) men1 = mean for complete years 1981-1990 men2 = mean for complete years 1958-1976 |
Sample Climate Data Record <khc3_cli.txt>
| Site;Temp;Parm; Jan; Feb; Mar; Apr; May;
Jun; Jul; Aug; Sep; Oct; Nov; Dec; Year sng;mean;prec; 97.26; 39.29; 40.43; 70.47; 126.00; 100.84; 104.47; 103.21; 130.77; 282.00; 529.41; 428.31;1928.38 sng;mean;tmax; 29.54; 30.52; 31.33; 32.66; 33.17; 32.62; 32.63; 32.70; 32.13; 31.01; 29.77; 29.27; 31.48 sng;mean;tmin; 23.98; 23.86; 24.11; 24.32; 24.29; 24.28; 23.75; 23.82; 23.79; 23.79; 23.65; 23.71; 23.95 sng;numb;prec; 38.00; 36.00; 37.00; 39.00; 40.00; 38.00; 38.00; 39.00; 39.00; 40.00; 37.00; 36.00; 40.00 sng;numb;tmax; 38.00; 38.00; 36.00; 40.00; 40.00; 38.00; 37.00; 39.00; 40.00; 40.00; 37.00; 36.00; 40.00 sng;numb;tmin; 38.00; 38.00; 36.00; 40.00; 40.00; 38.00; 37.00; 39.00; 40.00; 40.00; 37.00; 36.00; 40.00 sng;stdv;prec; 104.38; 39.50; 43.40; 56.06; 61.61; 44.50; 48.92; 59.12; 57.41; 115.48; 232.54; 236.60; 508.53 sng;stdv;tmax; 0.60; 0.59; 0.46; 0.49; 0.38; 0.49; 0.45; 0.50; 0.34; 0.33; 0.48; 0.61; 0.31 sng;stdv;tmin; 0.60; 0.59; 0.46; 0.49; 0.38; 0.49; 0.45; 0.50; 0.34; 0.33; 0.48; 0.61; 0.29 sng;1951;prec; 106.00; 24.00; 9.00; 50.00; 237.00; 20.00; 166.00; 156.00; 157.00; 222.00; 515.00; 617.00;2279.00 sng;1951;tmax; 29.38; 29.73; 31.01; 32.57; 32.94; 32.27; 31.84; 32.44; 31.77; 31.01; 29.76; 29.48; 31.18 sng;1951;tmin; 23.82; 23.07; 23.79; 24.23; 24.06; 23.93; 22.96; 23.56; 23.43; 23.79; 23.64; 23.92; 23.68 … Where, Temp (temporal) - specific year or long-term statistic: mean = mean based on all years numb = number of years stdv = standard deviation based on all years Parm (parameter): prec = precipitation for month or year (mm) tmax = mean maximum temperature for month or year (C) tmin = mean minimum temperature for month or year (C) |
3. Data Application and Derivation:
The accumulation of biomass, or NPP, is the net gain of carbon by photosynthesis that remains after plant respiration. While there are many fates for this carbon, this data set accounts for annual net biomass increase + extrapolated annual litterfall + turnover as tree mortality.
This study was undertaken to examine the physiognomy, structure, and productivity of a typical Southeast Asian rainforest.
The tropical forest biomass dynamics data for the Khao Chong site are provided for comparison with models and estimation of NPP. Climate data are provided for use in driving ecosystem/NPP models.
4. Quality Assessment:
Only a very limited number of production estimates for tropical rainforest communities were available at the time of this study. Kira (1967) compares the results for Khao Chong to several estimates of hardwood forest production obtained using more or less similar procedures.
Sources of Error
Information not available.
5. Data Acquisition Materials and Methods:
Site Information
Khao Chong is a well-preserved rainforest located on the west slope of the central granitic range of the Malay Peninsula of Thailand. The structure and physiognomy of the forest are described in detail by Ogawa et al. (1965). Although somewhat inferior to equatorial rainforests of Malaysia in tree size (maximum height of dominants 35-40 m) and in floristic diversity (98 species of trees and woody climbers over 4.5 cm dbh per 0.32 ha), its physiognomic features are quite typical of a tropical rainforest with its multi-layered structure, absence of seasonal aspects, development of plank-buttresses, and abundance of woody lianas. The leaf area index (12.3 m2/m2 including ground vegetation) suggests a high level of productivity.
Only trees over 4.5-cm DBH are treated in this data set. The amount of smaller saplings and ground vegetation in the tropical rainforest at Khao Chong is no more than 1-2 % of the total biomass of the community.
In 2000, the Khao Chong Forest Dynamics Plot was initiated under the direction of Sarayudh Bunyavejchewin of the Thai Royal Forest Department and the Smithsonian Tropical Research Institute. The field crew, led by graduates from Kasetsart University, completed the census of the first 16 ha in 2001 and completed the total 24-ha census in 2003. The plot encompasses a valley that extends up the side of steep granite and includes ridge forest dominated by massive trees of Dipterocarpus costatus. The field data are not yet available and thus are not included in this data set.
A forest phenology study monitoring ~1,300 mature trees of ~250 species in and around the study plot has been ongoing since 2001. Khao Chong forest phenology appears to coincide with the "general flowering" events that occur to the south of peninsular Malaysia. The field data are not yet available and thus are not included in this data set.
Other recent ongoing studies include a study of seedling recruitment of seven dominant species of Dipterocarpaceae in the forest and a study of seasonality of biomass dynamics in the forest.
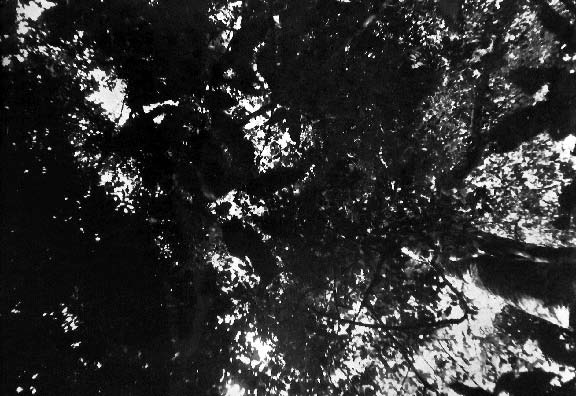
Figure 2. Fish-eye photograph of canopy of Stand 4 (fully closed tropical rain forest) at Khao Chong Forest Reserve. (The leaf area index of this stand was estimated at 12.3. The large-leaved tree in the center is Croton sp. Plao Lintin, one of the most important among understory trees. Photograph taken January 1962 by Dr. K. Yoda, Osaka City University, Japan). Reproduced by kind permission of Prof. Tatuo Kira and Prof. Husato Ogawa.
Increment of Tree Biomass
Allometric relationships for estimating biomass of various components were checked by destructive harvesting of a plot 10 m x 40 m. In an undisturbed stand (Stand 5), all trees larger than 4.5-cm DBH were mapped, numbered, and marked at a height of 130-cm above the ground (breast height) on February 3-4, 1962. DBH of every trunk was measured with a diameter tape. The census was repeated on July 21, 1963 and March 30, 1965 using the same diameter tape. The interval between the first and the second census was 533 days and that between the second and third census was 618 days. Records of dbh increments over a total of 1,151 days (3.15 years) were thus obtained, and enabled the trends in biomass change to be calculated by the method described in Kira (1967). The net increase of biomass in a specified period was largely determined by the balance between growth of living trees and the death of some individuals, since only a few small trees attained 4.5-cm DBH during each period. Herbivory and loss of live roots were not measured.
Litterfall
The amount of litterfall was measured daily in a 0.9 m x 12 m plot from January 13 to February 9, 1962 (Stand 4). Total accumulation of litter in the trap was also recorded from February 9 to 24, 1962 (Stand 5). Litter was separated into leaf, branch, and other minor components (including bark, fruit, flower, etc) and weighed. Annual amount of litterfall was estimated by multiplying the daily average rate by 365.
Climate
Meteorological data are available from weather stations located on-site, in the town of Trang, Thailand (7.52 N 99.62 E, about 22 km from Khao Chong), and at nearby Songkhla, Thailand (7.2 N 100.6 E).
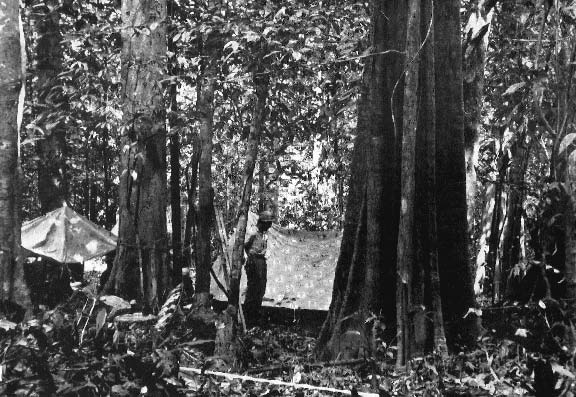
Figure 3. Interior of Stand 4 (fully closed tropical rain forest) at Khao Chong Forest Reserve after clearing of undergrowth (plants under 4.5 cm dbh). (The thickest trunk in the center is Alstonia spathulata. Near the right side of the picture is a buttressed Ficus. Two large stems to the left are Eugenia clarkeana [right] and Harpullia cupanoides [left]. Photograph taken 13th January 1962 by Dr. K. Yoda, Osaka City University, Japan). Reproduced by kind permission of Prof. Tatuo Kira and Prof. Husato Ogawa.
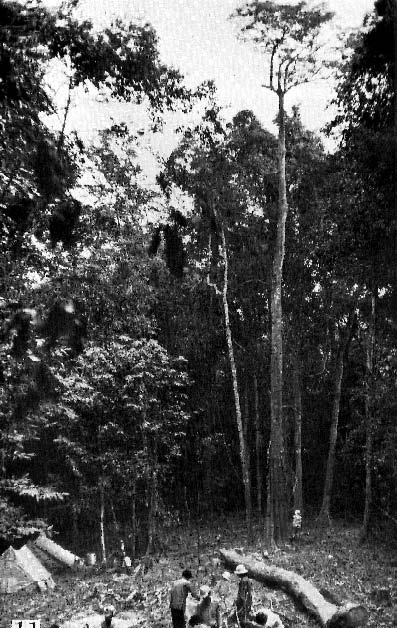
Figure 4. Profile of Stand 4 (fully closed tropical rain forest) at Khao Chong Forest Reserve, exposed on one side of the clear-felled plot, 10 m x 40 m. (The tallest tree in the center is Alstonia spathulata, 35.5 m in height. Photograph taken 25th January 1962 by Dr. K. Yoda, Osaka City University, Japan). Reproduced by kind permission of Prof. Tatuo Kira and Prof. Husato Ogawa.
6. Data Access:
These data are available through the Oak Ridge National Laboratory (ORNL) Distributed Active Archive Center (DAAC).
Data Archive Center:
Contact for Data Center Access Information:
E-mail: uso@daac.ornl.gov
Telephone: +1 (865) 241-3952
7. References:
Kira T., and T. Shidei. 1967. Primary production and turnover of organic matter in different forest ecosystems of the western Pacific. Japanese Journal of Ecology 17:70-87.
Kira, T., H. Ogawa, K. Yoda, and K. Ogino. 1964. Primary production by a tropical rain forest of Southern Thailand. Botanical Magazine Tokyo 77: 428-429.
Kira, T., H. Ogawa, K. Yoda, and K. Ogino. 1967. Comparative ecological studies on three main types of forest vegetation in Thailand. IV. Dry matter production, with special reference to the Khao Chong rain forest. In: Nature and Life in Southeast Asia Vol. V (T. Kira and K. Iwata, eds.) pp. 149-174.
Olson, R.J., K.R. Johnson, D.L. Zheng, and J.M.O. Scurlock. 2001. Global and Regional Ecosystem Modeling: Databases of Model Drivers and Validation Measurements. ORNL Technical Memorandum TM-2001/196. Oak Ridge National Laboratory, Oak Ridge, Tennessee, U.S.A.
Additional Sources of Information:
Clark, D.A., S. Brown, D.W. Kicklighter, J Q. Chambers, J R. Thomlinson, J. Ni, and E. A. Holland. 2001a. Net primary production in tropical forests: an evaluation and synthesis of existing field data. Ecological Applications, 11(2): 371-384.
Clark, D.A., S. Brown, D.W. Kicklighter, J.Q. Chambers, J.R. Thomlinson, J. Ni, and E.A. Holland. 2013. NPP Tropical Forest: Consistent Worldwide Site Estimates, 1967-1999. Data set. Available on-line [http://daac.ornl.gov] from the Oak Ridge National Laboratory Distributed Active Archive Center, Oak Ridge, Tennessee, USA. doi:10.3334/ORNLDAAC/616
Ogawa, H., K. Yoda, K. Ogino, and T. Kira. 1965. Comparative ecological studies on three main types of forest vegetation in Thailand. II. Plant biomass. In: Nature and Life in Southeast Asia Vol. I (T. Kira and K. Iwata, eds.) pp. 49-80.
Olson, R.J., J.M.O. Scurlock, S.D. Prince, D.L. Zheng, and K.R. Johnson (eds.). 2013a. NPP Multi-Biome: Global Primary Production Data Initiative Products, R2. Data set. Available on-line [http://daac.ornl.gov] from the Oak Ridge National Laboratory Distributed Active Archive Center, Oak Ridge, Tennessee, USA. doi:10.3334/ORNLDAAC/617
Olson, R.J., J.M.O. Scurlock, S.D. Prince, D.L. Zheng, and K.R. Johnson (eds.). 2013b. NPP Multi-Biome: NPP and Driver Data for Ecosystem Model-Data Intercomparison, R2. Data set. Available on-line [http://daac.ornl.gov] from the Oak Ridge National Laboratory Distributed Active Archive Center, Oak Ridge, Tennessee, USA. doi:10.3334/ORNLDAAC/615
Scurlock, J.M.O., and R.J. Olson. 2002. Terrestrial net primary productivity - A brief history and a new worldwide database. Environ. Rev. 10(2): 91-109. doi:10.1139/a02-002
Scurlock, J.M.O., and R.J. Olson. 2012. NPP Multi-Biome: Grassland, Boreal Forest, and Tropical Forest Sites, 1939-1996, R1. Data set. Available on-line [http://daac.ornl.gov] from Oak Ridge National Laboratory Distributed Active Archive Center, Oak Ridge, Tennessee, USA. doi:10.3334/ORNLDAAC/653