Get Data
Summary:
This data set contains three ASCII files (.txt format). Two files contain above- and below-ground biomass and productivity data for a desert grassland in the Jornada Experimental Range, New Mexico, one file for an ungrazed treatment and the other for a light to moderately grazed treatment. The study site (32.60 N, -106.85 W, Elevation 1,350 m) is located in the Basin and Range geomorphic province at the northernmost extent of the Chihuahuan Desert, near the city of Las Cruces, New Mexico, about 60-km northwest of El Paso, Texas. The third file contains climate data for the period 1954-1992 obtained from a weather station located near the study site (32.62 N, -106.73 W, Elevation 1,300 m).
Dynamics of above-and below-ground plant biomass were monitored at roughly 2-week intervals during the growing season from 1970 to 1972. Data on above-ground live biomass, recent and old dead matter, and root-crown biomass are available for one to two replications of grazed and "ungrazed" (relatively undisturbed) treatments. Total below-ground biomass was also sampled. Data were collected as part of a coordinated study over 1-3 years at ten grassland sites of the central and western United States, under the US GrasslandBiome Project of the International Biological Program (IBP).
Annual above-ground net primary production (ANPP) was estimated, conservatively, by summing peak biomass of individual species, and annual below-ground net primary production (BNPP) estimated as the sum of positive increments in total root biomass.
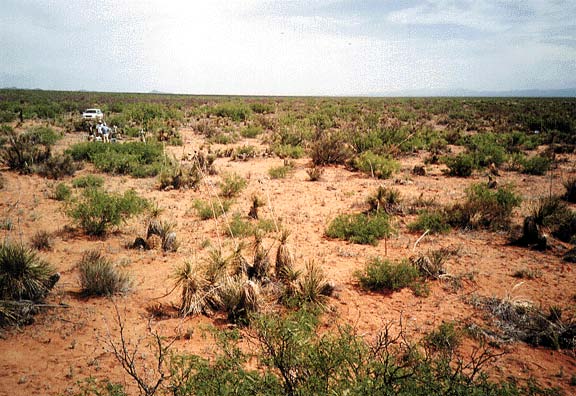
Figure 1. View of the Jornada site, New Mexico, USA, pictured during the NASA EOS Prototype Validation (PROVE) experiment (Photograph of grass/shrub transitional area taken May 1997 by J.M.O. Scurlock).
Revision Notes:Only the documentation for this data set has been modified. The files have been checked for accuracy and are identical to those originally published in 1998.
Additional Documentation
The Net Primary Productivity (NPP) data collection contains field measurements of biomass, estimated NPP, and climate data for terrestrial grassland, tropical forest, temperate forest, boreal forest, and tundra sites worldwide. Data were compiled from the published literature for intensively studied and well-documented individual field sites and from a number of previously compiled multi-site, multi-biome data sets of georeferenced NPP estimates. The principal compilation effort (Olson et al., 2001a) was sponsored by NASA’s Terrestrial Ecology Program. For more information, please visit the NPP web site at http://daac.ornl.gov/NPP/npp_home.html.
Data Citation:
Cite this data set as follows:
Pieper, R.D. 2014. NPP Grassland: Jornada, USA, 1970-1972, R1. Data set. Available on-line [http://daac.ornl.gov] from Oak Ridge National Laboratory Distributed Active Archive Center, Oak Ridge, Tennessee, USA. doi:10.3334/ORNLDAAC/209
This data set was originally published as:
Pieper, R.D. 1998. NPP Grassland: Jornada, USA, 1970-1972.
Data set. Available on-line [http://daac.ornl.gov] from Oak Ridge National
Laboratory Distributed Active Archive Center, Oak Ridge, Tennessee, U.S.A.
Table of Contents:
- 1 Data Set Overview
- 2 Data Description
- 3 Applications and Derivation
- 4 Quality Assessment
- 5 Acquisition Materials and Methods
- 6 Data Access
- 7 References
1. Data Set Overview:
Project: Net Primary Productivity (NPP)
Productivity of a desert grassland was monitored at the Jornada Experimental Range, New Mexico, from 1970 to 1972. Dynamics of above-and below-ground plant biomass were monitored at roughly 2-week intervals during the growing season. Data on above-ground live biomass, recent and old dead matter, and root-crown biomass are available for one to two replications of grazed and "ungrazed" (relatively undisturbed) treatments. Total below-ground biomass was also sampled.
Annual above-ground net primary production (ANPP) was estimated, conservatively, by summing peak biomass of individual species, and annual below-ground net primary production (BNPP) estimated as the sum of positive increments in total root biomass.
Table 1. Annual above-ground net primary production at Jornada, 1970-1972 (g/m2/year)
| YEAR | UNGRAZED | GRAZED |
|---|---|---|
| 1970 | 134 | 97 |
| 1971 | 125 | 51 |
| 1972 | 186 | 180 |
Source: Sims and Singh (1978b), Table 2, p. 578. ANPP for the ungrazed grassland (average of three years) is also reported in Esser (2013) and in Scurlock and Olson (2013).
Table 2. Annual below-ground net primary production at Jornada, 1970-1972 (g/m2/year)
| YEAR | UNGRAZED | GRAZED |
|---|---|---|
| 1970 | 91 | 130 |
| 1971 | 254 | 182 |
| 1972 | 96 | 57 |
Source: Sims and Singh (1978b), Table 2, p. 578. BNPP for the ungrazed grassland (average of three years) is also reported in Esser (2013) and in Scurlock and Olson (2013).
Note: Productivity values are also reported Olson et al. (2013a; b), but do not agree with the values given above because different calculation methods and conversion factors were used.
Climate data are available from a weather station located near the study site (32.62 N, -106.73 W, Elevation 1,300 m) for the period 1954-1992. Climate is characterized by sunshine, wide diurnal temperature range, low humidity, and extremely variable precipitation. About half the annual rainfall typically occurs in brief, local, but intense, convective thundershowers during the July to September monsoon season. Winter precipitation (derived from the Pacific Ocean) is more variable than summer, but is more effective in wetting the soil profile.
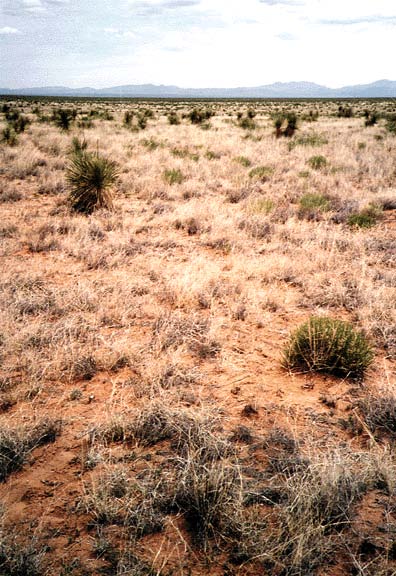
Figure 2. General view of grassland area at the Jornada study site, New Mexico, USA
(Photograph taken May 1997 by J.M.O. Scurlock).
2. Data Description:
Spatial Coverage
Site: Jornada, New Mexico, USA
Site Boundaries: (All latitude and longitude given in decimal degrees)
| Site (Region) | Westernmost Longitude | Easternmost Longitude | Northernmost Latitude | Southernmost Latitude | Elevation (m) |
|---|---|---|---|---|---|
| Jornada, New Mexico, USA | -106.85 | -106.85 | 32.60 | 32.60 | 1,350 |
Spatial Resolution
Harvest plots (quadrats) of two different sizes were used: 0.5 m2 and 2.0 m2.
Temporal Coverage
Biomass measurements were made from 1970/07/14 through 1972/10/28. Climate data are available from 1954/01/01 through 1992/12/31.
Temporal Resolution
Biomass measurements were made at roughly 2-week intervals during the growing season. All NPP estimates are based on plant dry matter accumulation, expressed as g/m2/year. Climate data are expressed as monthly and annual precipitation amounts (mm) and monthly and annual average maximum/minimum temperature (degrees C). Monthly and annual climatic means are provided for the 1954-1992 period.
Data File Information
Table 3. Data files and descriptions
| FILE NAME | TEMPORAL COVERAGE | FILE CONTENTS |
|---|---|---|
| jrn1_npp.txt | 1970/07/14 - 1972/10/21 | Above- and below-ground biomass and NPP data for the ungrazed grassland at Jornada, USA |
| jrn2_npp.txt | 1970/07/15 - 1972/10/28 | Above- and below-ground biomass and NPP data for the grazed grassland at Jornada, USA |
| jrn_cli.txt | 1954/01/01 - 1992/12/31 | Monthly and annual climate data from weather station at Jornada, USA |
NPP Data. Biomass estimates for the Jornada site are in two files, one for each treatment (Table 3). The data sets are ASCII files (.txt format). The first 18 lines are metadata; data records begin on line 19. The variable values are delimited by semicolons. The values -9, -99, -99.9, and -999.9 are used to denote missing values. All NPP units are in g/m2/year (dry matter weight). Below-ground depth is reported in cm.
Table 4. Column headings in NPP files
| COLUMN HEADINGS | DEFINITION | UNITS |
|---|---|---|
| Site | Site where data were gathered (code refers to site identification) | Text |
| Treatmt | Long term management of site (code refers to treatment described in metadata in data file) | |
| Year | Year in which data were collected | Numeric |
| Mo | Month in which data were collected | |
| Dy | Day on which data were collected | |
| Jdate | Date in Julian year | |
| Tyear | Date in decimal year (year plus the Julian date divided by 365) | |
| nrep | Number of replicates | |
| nplots | Number of sampling plots | |
| AGbiomass | Mean above-ground standing crop of living biomass; each value is the mean of two replicates | g/m2 |
| AGbm_SE | Standard error for above-ground living biomass measurement | |
| Olddead | Mean above-ground stnding crop of old dead biomass (i.e., carry-over material from the previous year); each value is the mean of two replicates | |
| Oldd_SE | Standard error for above-ground old dead biomass measurement | |
| Newdead | Mean above-ground standing crop of new dead biomass (i.e., material produced and senesced during the current growing season); each value is the mean of two replicates | |
| Newd_SE | Standard error for above-ground new dead biomass measurement | |
| AGTotclip | Mean total above-ground standing crop biomass (living + dead); each value is the mean of two replicates | |
| Total_SE | Standard error for total above-ground biomass measurement | |
| BGtop30 | Mean below-ground standing crop biomass in top 30 cm sample; each value is the mean of two replicates | |
| BGtotal | Mean total below-ground stnding crop biomass; each value is the mean of two replicates | |
| BGdepth | Maximum below-ground sampling depth | cm |
Note: All values are from Sims et al. (1978), Appendix III.
Sample NPP Data Record <jrn1_npp>
| Site;Treatmnt;Year;Mo;Dy;Jdate;Tyear;nrep;nplots;AGbiomass;AGbm_SE;Olddead;Oldd_SE;Newdead; Newd_SE;Crown;Crown_SE;AGTotclip;Totcl_SE;nrep_BG;nplot_BG;BGtop30;BGtotal;BGdepth jrn;ungrazed;1970;07;14;195;1970.534; 2; 32; 76.6; 16.3; 0.2; 0.2; 0.0; 0.0; 0.0; 0.0; 76.8; 16.4; 1; 20; 187.9; 187.9; 30.0 jrn;ungrazed;1970;07;30;211;1970.578; 2; 32; 72.8; 19.0; 3.0; 1.3; 0.0; 0.0; 0.0; 0.0; 75.8; 18.8; 1; 20; 272.2; 272.2; 30.0 jrn;ungrazed;1970;08;10;222;1970.608; 2; 32; 85.7; 16.3; 0.0; 0.1; 0.0; 0.0; 0.0; 0.0; 85.7; 16.3; 1; 20; 203.2; 203.2; 30.0 .. |
Sample NPP Data Record <jrn2_npp>
| Site;Treatmnt;Year;Mo;Dy;Jdate;Tyear;nrep;nplots;AGbiomass;AGbm_SE;Olddead;Oldd_SE;Newdead; Newd_SE;Crown;Crown_SE;AGTotclip;Totcl_SE;nrep_BG;nplot_BG;BGtop30;BGtotal;BGdepth jjrn;rcntgrzd;1970;07;15;196;1970.537; 2; 32; 18.4; 3.4; 5.6; 3.0; 0.0; 0.0; 0.0; 0.0; 24.0; 4.1; 1; 20; 194.3; 194.3; 30.0 jrn;rcntgrzd;1970;07;31;212;1970.581; 1; 32; 37.3; 8.8; 0.2; 0.1; 0.0; 0.0; 0.0; 0.0; 37.5; 8.7; 1; 20; 146.5; 146.5; 30.0 jrn;rcntgrzd;1970;08;10;222;1970.608; 2; 32; 74.1; 24.0; 0.0; 0.0; 0.0; 0.0; 0.0; 0.0; 74.1; 24.0; 1; 20; 229.3; 229.3; 30.0 .. |
Climate Data. The climate data set is an ASCII file (.txt format). The first 18 lines are metadata; data records begin on line 19. The variable values are delimited by semicolons. There are no missing values.
| COLUMN HEADINGS | DEFINITION |
|---|---|
| Site | Unique 3-character code for each site based on the first three consonants in the site name (e.g., jrn for Jornada) |
| Temp (Temporal) |
Indicates whether the values in that row are either long-term (i.e, mulit-year) or annual data for the specified parameter. For multi-year, the values are: mean=mean values (monthly and annual) calculated for the years of data as noted in the documentation numb=number of years of data included in a reported mean value stdv=standard deviation of a mean value Annual data: 19XX=monthly and annual parameter values for the specified year (e.g., 1972) |
| Parm | Parameter, indicates the meteorological data reported in that row. prec-total precipitation for the month or year tmax=maximum temperature for the month or year reported in degrees C tmin=minimum temperature for the month or year reported in degrees C |
|
Description of specific Temp and Parm data values: Long-term data: site;mean;prec; Multi-year mean of total precipitation for each month [Jan, Feb, Mar, …, Dec] and mean of total annual precipitation across all years [Year] (mm) site;mean;tmax; Multi-year mean of maximum temperature for each month [Jan, Feb, Mar, …, Dec] and mean of annual maximum temperature across all years [Year] (C) site;mean;tmin; Multi-year mean of minimum temperature for each month [Jan, Feb, Mar, …, Dec] and mean of annual minimum temperature across all years [Year] (C) … site; numb and stdv; repeat for prec, tmax, and tmin; Annual data: site;19XX;prec; Total precipitation for each month [Jan, Feb, Mar,.....Dec] and total precipitation for the year 19XX [Year] (mm) site;19XX;tmax; Maximum temperature for each month [Jan, Feb, Mar,.....Dec] and maximum for the year 19XX [Year] (C) site;19XX;tmin; Minimum temperature for each month [Jan, Feb, Mar,.....Dec] and minimum for the year 19XX [Year] (C) … site;19XX;(prec, tmax, and tmin); repeat for reported years. Annual data missing value note: If a monthly parm value is missing, the parm value for [Year] is also set to missing (-999.9). |
Sample Climate Data Record
| Site;Temp; Parm; Jan; Feb; Mar; Apr; May; June; July; Aug; Sept; Oct; Nov; Dec; Year jrn; prec; mean; 12.80; 8.90; 7.70; 5.10; 10.10; 15.40; 48.70; 59.90; 35.00; 25.20; 12.60; 20.60; 262.00 jrn; tmax; mean; 13.80; 16.58; 20.33; 25.14; 29.61; 34.71; 35.17; 33.49; 30.53; 25.54; 18.95; 13.90; 35.17 jrn; tmin; mean; -6.37; -4.24; -1.21; 2.89; 7.35; 12.71; 16.62; 15.54; 11.30; 4.37; -2.68; -6.17; -6.37 jrn; prec; numb; 39; 39; 39; 39; 39; 39; 39; 39; 39; 39; 39; 39; 39 jrn; tmax; numb; 39; 39; 39; 39; 39; 39; 39; 39; 39; 39; 39; 39; 39 jrn; tmin; numb; 39; 39; 39; 39; 39; 39; 39; 39; 39; 39; 39; 39; 39 jrn; prec; stdv; 10.20; 8.10; 9.80; 6.60; 15.90; 18.40; 29.40; 38.00; 28.60; 22.50; 17.20; 21.40; 89.90 jrn; tmax; stdv; 1.84; 1.67; 1.94; 1.73; 1.50; 1.45; 1.45; 1.37; 1.50; 1.78; 1.85; 1.91; 1.16 jrn; tmin; stdv; 2.23; 2.15; 1.77; 1.71; 1.53; 1.67; 1.32; 1.40; 1.90; 2.19; 2.21; 2.05; 1.75 jrn; 1954; prec; 0.00; 16.80; 7.10; 7.90; 0.00; 13.50; 20.30; 1.80; 0.00; 10.70; 0.00; 0.80; 78.90 jrn; 1954; tmax; 16.11; 20.56; 20.56; 28.33; 30.00; 35.00; 36.11; 33.89; 32.78; 26.67; 21.11; 15.56; 36.11 jrn; 1954; tmin; -5.56; -3.89; -0.56; 7.22; 11.11; 14.44; 17.78; 17.22; 15.00; 8.89; -1.67; -5.00; -5.56 .. Where, Temp (temporal) - specific year or long-term statistic: mean = mean based on all years numb = number of years stdv = standard deviation based on all years Parm (parameter): prec = precipitation for month or year (mm) tmax = mean maximum temperature for month or year (C) tmin = mean minimum temperature for month or year (C) |
3. Data Application and Derivation:
Grassland monthly biomass dynamics data for the Jornada site are provided for comparison with models and estimation of NPP. Climate data are provided for use in driving ecosystem/NPP models.
Data at Jornada were collected as part of a coordinated study over 1-3 years at ten grassland sites of the central and western United States, under the US Grassland Biome Project of the International Biological Program (IBP). The aim of the US/IBP Grassland Biome program was to study the whole US Grassland system, particularly the seasonal biomass and energy dynamics of grasslands across multiple trophic levels (Sims et al., 1978). The ten sites for which net primary productivity (NPP) data are reported encompassed six major grassland types, ranging from latitude 30 to 48 N and longitude -96 to -123 W, and from 390 m to 2,340 m in elevation. Mean annual precipitation for the ten sites ranged from 228 mm to 930 mm, and mean annual temperature from 2.7 degrees C to 15.2 degrees C.
4. Quality Assessment:
Under the US Grassland Biome Project, above- and below-ground net productivity at the participating grassland sites was measured and calculated using comparable methods.
Sources of Error
Annual ANPP determined by the summation of peak live weights of individual species, as in this study, can yield a conservative estimate because material produced, senesced and detached before the peak live weight of a given species occurs is unaccounted for. The presence of different growth forms in the variety of vegetation types grasslands complicates the study of crowns and estimation of crown biomass production. Difficulties and inaccuracies involved in the estimation of root production arise primarily because of insufficient information on the periods of greatest root growth and decomposition, and the unaccounted losses of organic root secretions, sloughing of root hairs, root caps, and cortical layers, translocation of organic material to the soil and to the fungal components of mycorrhizal roots, death and decay of fine roots, and consumption of fine roots by soil. Estimates of root production should therefore be viewed with the constraints imposed by the procedures used.
5. Data Acquisition Materials and Methods:
Site Information
The Jornada study site (32.60 N, -106.85 W, Elevation 1,350 m) is situated in the Basin and Range geomorphic province at the northernmost extent of the Chihuahuan Desert, near the city of Las Cruces, New Mexico, about 60-km northwest of El Paso, Texas. NPP data were collected as part of a coordinated study over 1-3 years at ten grassland sites of the central and western United States, under the US Grassland Biome Project of the International Biological Program (IBP).
Jornada is classified as a desert grassland (modified Bailey ecoregion temperate sub-tropical semi-desert, #321) and is dominated mainly by perennial species of warm-season plants. Over the past 100 years, various factors including over-grazing and fire suppression have resulted in large areas of former black grama grassland being replaced by shrubland communities dominated by creosotebush, mesquite, and tarbush. This produces a patchy distribution of soil nutrients, with nutrient-rich areas under shrub canopies and soil resources lost from adjacent inter-shrub spaces by wind and water erosion, although there appears to be little change in NPP.
The dominant graminoid species in the Jornada study areas continues to be the black grama Bouteloua eriopoda. Opuntia spp. cacti are also found in abundance on the Jornada site. Prosopsis juliflora (mesquite) and Yucca elata are widely-dispersed species. The annual Salsola kali (prickly saltwort) is also a significant contributor to biomass, especially on the recently grazed treatment. The number of recorded vegetation species in this study was 107.
The experimental design at Jornada included two treatments: ungrazed and grazed grasslands. The ungrazed treatment area was relatively undisturbed, but unenclosed. It had been lightly grazed by large herbivores in the past, but without significant vegetation changes occurring (Lewis, 1971). The grazed treatment refers to grazing during the previous growing seasons, since no domestic animals were allowed on the areas sampled during the sampling periods. Grazing at both Jornada treatment sites in the recent past was measured as light to moderate grazing intensities. The markedly poorer range condition on the grazed treatment (50% of the current species-composition of vegetation biomass in comparison to the potential of the community) compared to the ungrazed treatment (86% of potential) was probably the result of differences in the distribution of grazing in the early 1920s.
Field research is continuing on a variety of habitat types under the Jornada Long-Term Ecological Research (LTER) project, within the 26,000-hectare New Mexico State University Research Center and the adjacent 78,000-hectare US Department of Agriculture Jornada Experimental Range (where the Jornada IBP Grassland Biome site is located).
Soil type in the Jornada study areas was loamy fine sand Aridisol. These soils are typical of the arid zones where precipitation is generally not sufficient to promote annual leaching. As a result, these soils are often characterized by accumulations of carbonates within the profile. The shallow caliche layer found at Jornada may be relevant to root development and vegetation characteristics at the site.
Climate data are available from a weather station located near the study site (32.62 N, -106.73 W, Elevation 1,300 m). The grassland is characterized by a climate which shows distinct wet and dry seasonal patterns, with wide diurnal temperature range, low humidity, and extremely variable precipitation. The length of thermal potential growing season (defined as the number of consecutive days with a 15-day running-mean air temperature at or above 4.4 degrees C) at Jornada averaged 316 days over the study period, beginning as early as mid-January. About half the annual rainfall typically occurs in brief, local, but intense, convective thundershowers during the July to September monsoon season. Winter precipitation (derived from the Pacific Ocean) is more variable than summer, but is more effective in wetting the soil profile.
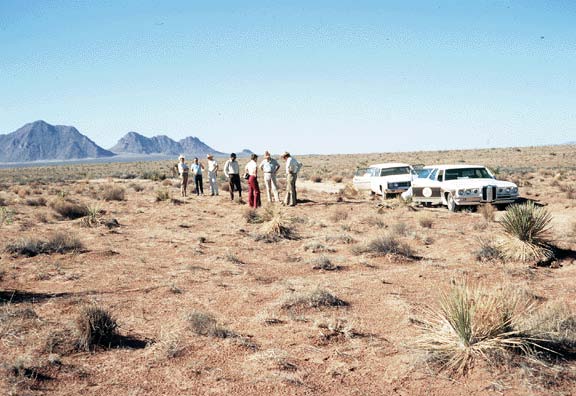
Figure 3. General view of the Jornada IBP grassland site, New Mexico, USA (Photograph taken June/July 1971).
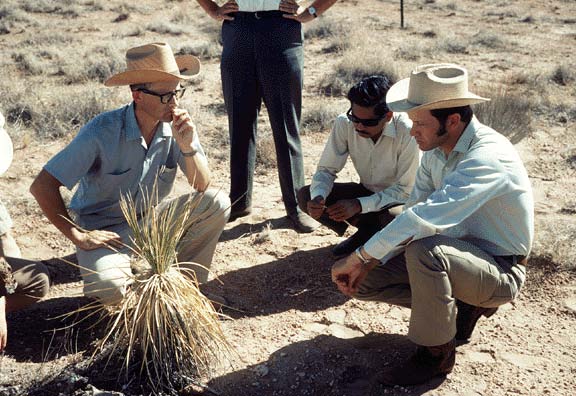
Figure 4. IBP scientists discussing field work at the Jornada IBP grassland site, New Mexico,
USA. (Left to right: Rex Pieper, Biome Site Coordinator; Jai Singh; George Van Dyne, Director, US/IBP
Grassland Biome Programme. Photograph taken June/July 1971).
Methods
Intra-seasonal dynamics of the various above- and below-ground primary producer compartments were studied at Jornada. The experimental design at Jornada included a relatively ungrazed treatment and a recently grazed treatment, with one or two replications of each treatment and 32 to 40 study plots per replication, depending on the sampling date. Structural characteristics studied included quantities of warm-season plants at each plot, and magnitude and seasonality of primary producer compartments. These latter measurements included seasonal above-ground live biomass, above-ground dead matter (recent plus old dead), total above-ground standing crop (living + dead + crown biomass), below-ground biomass by depth (root), and total below-ground biomass. Litter decomposition and below-ground root turnover were also separately measured but the data are not included in this data set.
Above-ground biomass was measured by the harvest technique, over successive 2-week intervals during the growing season. Harvest plots were 0.5 m2 and 2.0 m2 in size. The aerial plant material was clipped from harvest plots at the soil surface. Above-ground plant biomass was separated into several compartments, including perennial live, current (annual) live, recent dead, and old dead. Recent and old dead were primarily determined on the basis of color and the experience of the field and laboratory workers; recent dead was the material produced and senesced during the current growing season, while old dead was carry-over material from the previous year. Live and dead compartment material was further separated by species. Standing dead material was further separated into old and recent dead by species. Litter material was hand-picked from the harvest plots (surface sand at Jornada made vacuum device operation difficult). All material was oven-dried at c. 60 degrees C. Aerial materials were presented on a dry matter basis while litter weights were converted to an ash-free basis. Perennial and current live were summed to obtain total live material, and likewise recent dead and old dead were summed to give total dead material.
Below-ground biomass was sampled within the harvested plots to a depth sufficient to include at least 90% of the root mass. At Jornada, the sampling was limited to 0-30 cm because of the limiting depth of the soil profile (i.e., shallow caliche layer). Soil cores were obtained by hydraulic coring. Soil cores containing root samples were separated into 10-cm increments, and the increments washed over a 32-mesh screen. In 1971 and 1972, an additional fine screen was used during the washing process. Root material obtained was dried at c. 60 degrees C, weighed, and then ashed.
During 1970 and 1971, root crowns were collected from the soil-root cores. Root crowns are the unelongated internodes at the bases of plants; these organs are more abundant in grass plants than in most forbs or shrubs. During 1972, root crowns were sampled across the entire plot with the above-ground herbage. Further details for specific sampling procedures for Jornada appear in Pieper et al. (1971; 1972), Pieper and Herbel (1974), and Sims et al. (1978).
Intra-seasonal biomass dynamics data are provided in this data set. Annual ANPP or shoot production was determined by the summation of peak live weights of individual species (including crown biomass). Net root production was estimated from the summation of the significant positive increases in root biomass by depth. Annual BNPP was estimated as the sum of total root biomass. Data analysis and results are discussed by Sims and Singh (1978b).
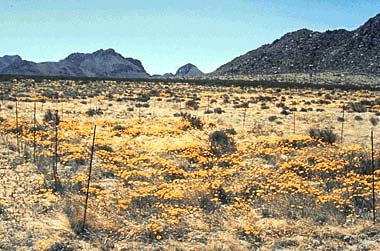
Figure 5. Nitrogen treatment plot (inside fence) at the Jornada site, New Mexico, USA. (Photo
taken March/April by Jerry F. Franklin; reproduced by kind permission of the US LTER Network
Office).
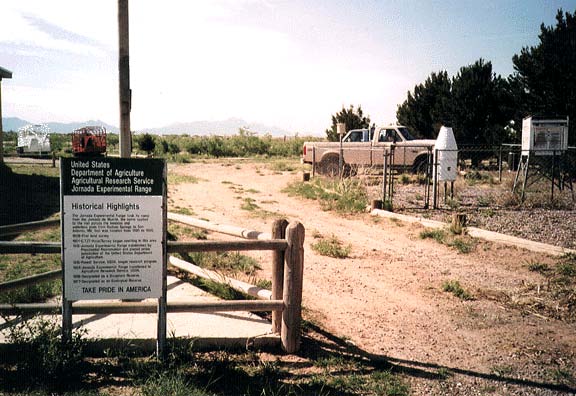
Figure 6. Headquarters facilities and weather station at the Jornada study site, New Mexico, USA (Photograph taken May 1997 by J.M.O. Scurlock).
Climate data
Climate data are available from a weather station at the grassland study site. The data were transcribed from literature/graphs by the principal investigator.
The climate data accompanying this NPP data set was compiled from daily observations of Tmax, Tmin, and precip amount.
For a given month, the maximum value of the daily Tmax for that month and the minimum value of the Tmin for that month is provided. For the year, the maximum value of the monthly Tmax is the annual Tmax and for the year the minimum value of the monthly Tmin values is the annual Tmin. Daily precipitation amount is summed to yield a monthly precipitation amount and the monthly precipitation is summed to provide an annual precipitation amount.
The multi-year mean monthly Tmax is the average of the Tmax values for that month for each year of the record. For example the mean monthly Tmax for April is the mean of each April’s Tmax for the observation period of record. Mean monthly Tmin and Mean monthly precip amount are calculated similarly.
6. Data Access:
This data is available through the Oak Ridge National Laboratory (ORNL) Distributed Active Archive Center (DAAC).
Data Archive Center:
Contact for Data Center Access Information:
E-mail: uso@daac.ornl.gov
Telephone: +1 (865) 241-3952
7. References:
Olson, R.J., K.R. Johnson, D.L. Zheng, and J.M.O. Scurlock. 2001. Global and Regional Ecosystem Modeling: Databases of Model Drivers and Validation Measurements. ORNL Technical Memorandum TM-2001/196. Oak Ridge National Laboratory, Oak Ridge, Tennessee, U.S.A.
Pieper, R.D., M. Connaughton, and R. Fitzenrider. 1971. Preliminary report on sampling of primary producers, invertebrates, and decomposers on the Jornada Site, 1970. US/IBP Grassland Biome Technical Report No. 105. Colorado State University, Fort Collins, Colorado.
Pieper, R.D., M. Ellstrom, E. Staffeldt, and R. Raitt. 1972. Primary producers, invertebrates, birds, and decomposers on the Jornada Site, 1971. US/IBP Grassland Biome Technical Report No. 200. Colorado State University, Fort Collins, Colorado.
Pieper, R.D, and C.H. Herbel. 1974. Primary production on the Jornada Site for 1972. US/IBP Grassland Biome Technical Report No. 249. Colorado State University, Fort Collins, Colorado.
Sims, P. L., J. S. Singh, and W. K. Lauenroth. 1978. The structure and function of ten western North American grasslands. I. Abiotic and vegetational characteristics. Journal of Ecology 66: 251-285.
Additional Sources of Information:
Esser, G. 2013. NPP Multi-Biome: Global Osnabruck Data, 1937-1981. Data set. Available on-line [http://daac.ornl.gov] from Oak Ridge National Laboratory Distributed Active Archive Center, Oak Ridge, Tennessee, USA. doi:10.3334/ORNLDAAC/214
Lewis, J.K. 1971. Grassland biome: a synthesis of structure and function, 1970, pp. 317-87. In: N.R. French (ed.). Preliminary Analysis of Structure and Function in Grasslands. Range Science Department Science Series No. 10. Colorado State University, Fort Collins, Colorado.
Olson, R.J., J.M.O. Scurlock, S.D. Prince, D.L. Zheng, and K.R. Johnson (eds.). 2013a. NPP Multi-Biome: Global Primary Production Data Initiative Products, R2. Data set. Available on-line [http://daac.ornl.gov] from the Oak Ridge National Laboratory Distributed Active Archive Center, Oak Ridge, Tennessee, USA. doi:10.3334/ORNLDAAC/617
Olson, R.J., J.M.O. Scurlock, S.D. Prince, D.L. Zheng, and K.R. Johnson (eds.). 2013b. NPP Multi-Biome: NPP and Driver Data for Ecosystem Model-Data Intercomparison, R2. Data set. Available on-line [http://daac.ornl.gov] from the Oak Ridge National Laboratory Distributed Active Archive Center, Oak Ridge, Tennessee, USA. doi:10.3334/ORNLDAAC/615
Scurlock, J.M.O., and R.J. Olson. 2002. Terrestrial net primary productivity - A brief history and a new worldwide database. Environ. Rev. 10(2): 91-109. doi:10.1139/a02-002
Scurlock, J.M.O., and R.J. Olson. 2013. NPP Multi-Biome: Grassland, Boreal Forest, and Tropical Forest Sites, 1939-1996, R1. Data set. Available on-line [http://daac.ornl.gov] from Oak Ridge National Laboratory Distributed Active Archive Center, Oak Ridge, Tennessee, USA. doi:10.3334/ORNLDAAC/653
Scurlock, J.M.O., K. Johnson, and R.J. Olson. 2002. Estimating net primary productivity from grassland biomass dynamics measurements. Global Change Biology 8(8): 736-753. DOI: 10.1046/j.1365-2486.2002.00512.x
Sims, P.L,. and J.S. Singh. 1978a. The structure and function of ten western North American grasslands. II. Intra-seasonal dynamics in primary producer compartments. Journal of Ecology 66: 547-572.
Sims, P.L., and J.S. Singh. 1978b. The structure and function of ten western North American grasslands. III. Net primary production, turnover and efficiencies of energy capture and water use. Journal of Ecology 66: 573-597.