Get Data
Summary:
This data set contains a single data file (.csv format) that provides gridded values of net primary productivity (NPP) for cropland in eight counties in the central United States for the year 1992 and estimates of interannual cropland NPP in Iowa for years from 1982 through 1996. The data file also includes climate, soil texture, and land cover data for each 0.5 degree grid cell.
The magnitude and interannual variation in NPP was estimated using crop area and yield data from the U.S. Department of Agriculture, National Agricultural Statistics Service (NASS). The major harvested commodities were corn, soybean, sorghum, sunflower, oats, barley, wheat, and hay. Total NPP estimates include both above- and below-ground components.
County-level NPP in 1992 ranged from 195 to 760 gC/m2/year. The area of highest NPP, ranging from 650 to 760 gC/m2/year, was found in a band extending across Iowa, through northern Illinois, Indiana, and southwestern Ohio. Areas of moderate NPP, from 550 to 650 gC/m2/year, occurred mostly in Michigan and Wisconsin, while large areas of low NPP, from 200 to 550 gC/m2/year, occurred in North Dakota, southern Illinois, and Minnesota. The area of highest production was also the area with the largest proportion of land sown with corn and soybean. NPP for counties in Iowa varied among years (1982-1996) by a factor of 2, with the lowest NPP in 1983 (which had an unusually wet spring), in 1988 (which was a drought year), and in 1993 (which experienced floods).
Revision Notes: The documentation for this data set has been modified, and the data files have been reformatted. The data files have been checked for accuracy and the contents are identical to those originally published in 2001.
Additional Documentation
The Net Primary Productivity (NPP) data collection contains field measurements of biomass, estimated NPP, and climate data for terrestrial grassland, tropical forest, temperate forest, boreal forest, and tundra sites worldwide. Data were compiled from the published literature for intensively studied and well-documented individual field sites and from a number of previously compiled multi-site, multi-biome data sets of georeferenced NPP estimates. The principal compilation effort (Olson et al., 2001a) was sponsored by the NASA Terrestrial Ecology Program. For more information, please visit the NPP web site at http://daac.ornl.gov/NPP/npp_home.html.
Data Citation:
Cite this data set as follows:
Prince, S.D., J. Haskett, M. Steininger, H. Strand, and R. Wright. 2013. NPP Cropland: Gridded Data for the Central USA , 1982-1996, R1. Data set. Available on-line [http://daac.ornl.gov] from the Oak Ridge National Laboratory Distributed Active Archive Center, Oak Ridge, Tennessee, USA doi:10.3334/ORNLDAAC/612
This data set was originally published as:
Prince, S.D., J. Haskett, M. Steininger, H. Strand, and R. Wright. 2001. NPP Cropland: Gridded Data for the Central USA , 1982-1996. Data set. Available on-line [http://daac.ornl.gov] from the Oak Ridge National Laboratory Distributed Active Archive Center, Oak Ridge, Tennessee, USA
Table of Contents:
- 1 Data Set Overview
- 2 Data Description
- 3 Applications and Derivation
- 4 Quality Assessment
- 5 Acquisition Materials and Methods
- 6 Data Access
- 7 References
1. Data Set Overview:
Project: Net Primary Production (NPP)
This study estimated cropland net primary production through the use of harvested crop yields converted to dry mass and calculation of the remaining biological yield using simple, widely reported harvest indices and root to shoot biomass ratios for below-ground allocations. Total seasonal NPP consisted of all carbon sinks in the cropland, including not only harvested yield (e.g., corn grains, soybean seeds, silage) but also non-economic components (leaves, stems, roots, exudates, and other sinks) that are shed or otherwise lost (Clark et al., 2001).
The comma-separated-value data file provides gridded values of net primary productivity (NPP) for cropland in eight counties in the central United States for the year 1992 and estimates of interannual cropland NPP in Iowa for years from 1982 through 1996. The data file also includes climate data; proportion of land cover in crops, forest, and other land cover types; proportion cropland cover planted in corn and soybeans; and soil texture proportion in each 0.5 degree grid cell.
The Midwestern United States was selected as the study area because most of the counties in these states are sown with a few well-studied crops and because consistent harvest yield statistics are available for all counties. Furthermore, counties in these states are large, typically 10–30% of one latitude x longitude square degree; also they are regularly shaped, and thus approach the resolution of grid cells typically used in global primary production and climate models.
The study included areas of harvested corn, soybean, sorghum, sunflower, oats, barley, wheat, and hay in Illinois, Indiana, Iowa, Michigan, Minnesota, North Dakota, Ohio, and Wisconsin for the year 1992. Among these states, Iowa had the highest crop cover, most of which was corn and soybean. In 24 of Iowa’s 99 counties, cropland exceeded 80% of the total land area. The study also included estimates of interannual NPP in Iowa for years from 1982 through 1996. This period included a range of climatic conditions, including two El Nino˜ Southern Oscillation (ENSO) years, a drought year, and a flood year. The spatiotemporal patterns of NPP from these regions allowed comparison with the results of NPP models for different climatic conditions in one year, and for a 15-yr time series, for four large areas in one part of the region.
NPP values in Prince et al. (2001) are reported in megagrams/hectare/year (Figures 1 and 2). In this data set and in Olson et al. (2012), the gridded data were converted to grams of carbon/square meter/year using a conversion factor of 0.5 carbon content equivalent. County-level NPP in 1992 ranged from 195 to 760 gC/m2/year. The area of highest NPP, ranging from 650 to 760 gC/m2/year, was found in a band extending across Iowa, through northern Illinois, Indiana, and southwestern Ohio. Areas of moderate NPP, from 550 to 650 gC/m2/year, occurred mostly in Michigan and Wisconsin, while large areas of low NPP, from 200 to 550 gC/m2/year, occurred in North Dakota, southern Illinois, and Minnesota. The area of highest production was also the area with the largest proportion of land sown with corn and soybean. NPP for counties in Iowa varied among years (1982-1996) by a factor of 2, with the lowest NPP in 1983 (which had an unusually wet spring), in 1988 (which was a drought year), and in 1993 (which experienced floods). A sensitivity analysis, conducted by varying harvest index and root:shoot ratio by 10–50%, indicated that the limit of accuracy of the method is ~50 gC/m2/year.
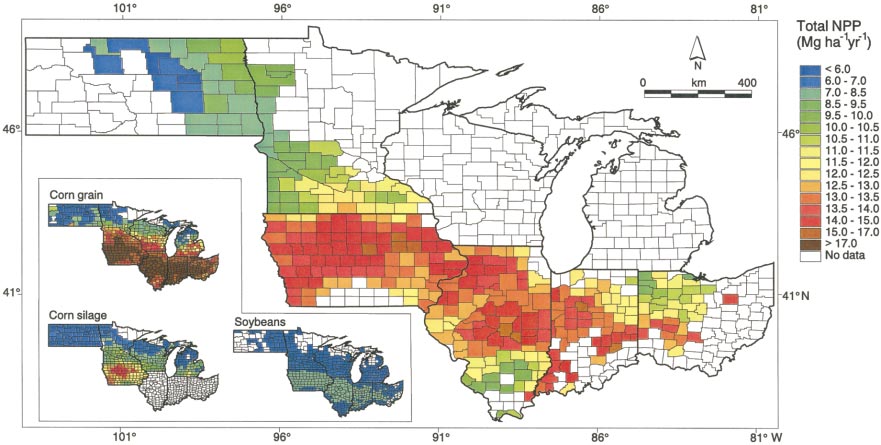
Figure 1. Total annual net primary production (NPP) in 1992 for U.S. Midwest counties, estimated from National Agricultural Statistics Service (NASS) harvest yield and literature values of crop harvest index and below-ground allocation. Counties shown in white have either >10% forest cover or <50% reported crop cover; no NPP estimates were calculated for these counties. This threshold was not applied to the small inset maps. Source: Prince et al. (2001).
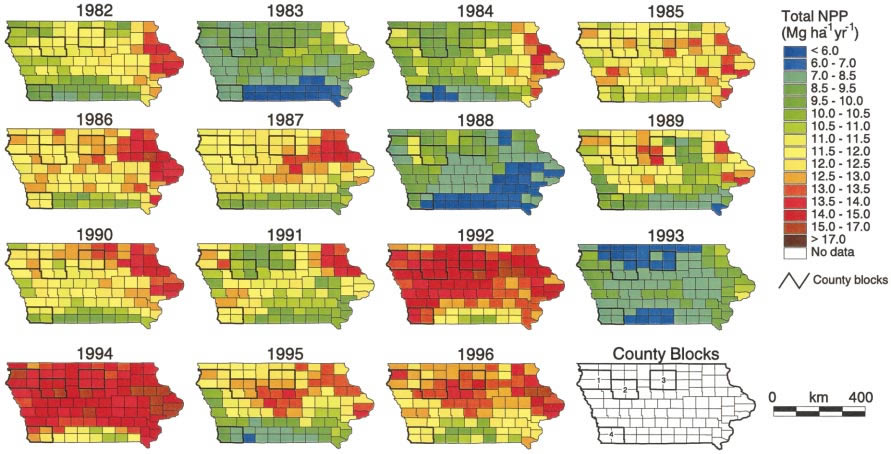
Figure 2. Annual NPP for 1982–1996 for counties in Iowa. The four blocks, of four counties each, used for the 15-yr time sequence are marked with bold lines. Source: Prince et al. (2001).
2. Data Description:
Spatial Coverage
Site: Midwestern United States
| Site (Region) | Westernmost Longitude | Easternmost Longitude | Northernmost Latitude | Southernmost Latitude | Elevation (m) |
|---|---|---|---|---|---|
| Midwestern United States | -99.75 | -83.25 | 48.75 | 38.25 | 127-547 |
Site Information
The study included areas of harvested corn, soybean, sorghum, sunflower, oats, barley, wheat, and hay in Illinois, Indiana, Iowa, Michigan, Minnesota, North Dakota, Ohio, and Wisconsin. These states were selected because >50% of the land area in the majority of the counties was sown with crops for which investigators could obtain estimates of harvest index and below-ground allocation.
Total cropland NPP was estimated for all counties in the study area. Counties in which woodland area exceeded 10% of total county area (e.g.., in northern Wisconsin and Minnesota) were excluded from the analysis. Counties in which <50% of the county area was accounted for by the included crops were also excluded from the analysis.
In Iowa, four blocks of land in contrasting climatic regions of the state were selected for comparisons with coarse resolution, gridded model results. Each block consisted of four neighboring counties to make a total area of approximately two-thirds of 1degree longitude x 1degree latitude. See Prince et al. (2001) for these results.
Spatial Resolution
0.5-degree grid cells
Temporal Coverage
Total cropland and woodland NPP was estimated for all counties in the study area for the year 1992. For Iowa, NPP was estimated for each of the years from 1982 through 1996. The mean NPP for Iowa for the 15-year period 1982-1996 is also provided.
Temporal Resolution
Annual. Total NPP estimates are expressed on an annual basis in gC/m2/yr.
Data File Information
Table 1. Data file in this data set archive
| FILE NAME | TEMPORAL COVERAGE | FILE CONTENTS |
|---|---|---|
| crop_npp.csv | 1982/01/01 - 1996/12/31 | Gridded cropland NPP estimates for the Midwestern United States |
NPP Data. All of the NPP estimates for the U.S. midwestern states are in one comma-separated-value file (Table 1). The file contains total NPP estimates for each 0.5 degree grid cell of cropland in the Midwest United States for 1992 and 15-year mean and individual year NPP for the state of Iowa along with additional grid information (Table 2). The first 18 lines are metadata; data records begin on line 19.The value -99 is used to denote missing values.
Table 2. Column headings in NPP file
| COLUMN HEADING | DEFINITION | UNITS | SOURCE |
|---|---|---|---|
| lat | Latitude of 0.5 degree cell centroid | decimal degrees | Prince et al. (2001) |
| lon | Longitude of 0.5 degree cell centroid | ||
| totnpp | Total NPP | gC/m2/yr | |
| elev | Elevation | m | Global Land One-kilometer Base Elevation (GLOBE) Digital Elevation Model, Version 1.0 (Hastings et al. 1999) |
| ele_std | Standard deviation of elevation in a 0.5 cell | m | |
| ait_t | Mean annual air temperature (1901-1995) | C | New et al. (1999; 2000) |
| ppt | Total annual precipitation (1901-1995) | mm | |
| sand | Proportion of sand in soil | percent | Zobler (1986) |
| silt | Proportion of silt in soil | ||
| clay | Proportion of clay in soil | ||
| crop | Cropland cover | percent | National Agricultural Statistics Service (NASS, 1998) |
| corn | Proportion of cropland planted in corn | ||
| soybean | Proportion of cropland planted in soybeans | ||
| forest | Forest land cover | ||
| other_cover | Other land cover | ||
| biome | Biome type | text | ORNL |
| methods | Methods used in developing NPP values | text | National Agricultural Statistics Service (NASS) |
| year(s) | Years in which NPP values were calculated | numeric | Prince et al. (2001) |
| source | Primary author for NPP values | text | |
| type | Cell | text | |
| id | Unique ID number for each record (1-155 for Midwest in 1992, 156-220 for Iowa, followed by the mean of 1982-96 in Iowa AND each individual year for 1982-1996) | numeric | ORNL |
Notes:
(1) A more complete and extensive data set of NPP for 0.5-degree grid cells, representing major biome types worldwide, is available from the ORNL DAAC.
See NPP Multi-Biome: Gridded Estimates for Selected Regions Worldwide, 1989-2001, R[evision]2 (Zheng et al., 2003).
(2) "corn" is the sum of corn for grain and corn for silage. (3) corn cover + soybean cover does NOT necessarily = crop cover. (4) crop cover + forest cover does NOT necessarily = 100%. (5) -99 = no data.
Sample Data Record
| lat lon totnpp elev ele_std air_t ppt sand silt clay crop corn soy-bean forest other_cover biome methods year(s) source type id 38.25 -89.75 494 138.3 13.6 14.1 907 37 33 30 64 18 25 6 30 crop NASS inventory/allometric 1992 prince cell 1 |
3. Data Application and Derivation:
Data for cropland in the Midwestern United States are provided for comparison with models and estimation of NPP.
This study contributes to the International Geosphere–Biosphere (IGBP) Data Information System (DIS) Global Primary Production Data Initiative (GPPDI), a project that provides field observations of NPP for a set of sites for comparison with the results of global ecosystem models (Prince et al., 1995; Olson et al., 1996, 2001, 2012; Scurlock et al., 1999; Cramer et al., 2001). The data also contribute to a more complete and extensive data set of NPP estimates for 0.5-degree grid cells, representing major biome types worldwide, available from the ORNL DAAC. See NPP Multi-Biome: Gridded Estimates for Selected Regions Worldwide, 1989-2001, R[evision]2 (Zheng et al., 2003).
The spatial and temporal patterns of NPP from the U.S. Midwest regions allow comparison with the results of NPP models for different climatic conditions in one year (1992) and for a 15-yr time series for four large areas of Iowa which included a range of climatic conditions, including two El Nino˜ Southern Oscillation (ENSO) years, a drought year, and a flood year.
Agricultural landscapes are an important addition to the GPPDI data set, since they provide examples of human modified landscapes to complement the more widely quoted values for less managed ecosystems. Croplands also enable more accurate estimates of NPP than are possible in more heterogeneous, natural ecosystems since they are often dominated by a few well-studied crops, and in some areas, agricultural yield statistics provide field observations for very large areal samples of harvested yield, often over many years. Ecosystem models that estimate NPP with global coverage depend on gridded data sets with a resolution generally in the 0.5-1.0 degree range. Whereas models may have been tested with data and NPP observations at points, the application to grid cells requires explicit validation in the spatial domain (Scurlock et al., 1999; Cramer et al., 2001), not least because the results depend on the validity of the gridded forcing variables which are estimated from sparse networks of point values (e.g., meteorological stations). NPP estimates from models that use remotely sensed data are intrinsically spatial, and the field estimates of NPP that are appropriate for comparison with these coarse resolution model results are for large grid cells. Agricultural yield data collected in large, uniform cropped regions may, therefore, be particularly appropriate for this purpose (Malmstrom et al., 1997).
4. Quality Assessment:
The approach taken in this study provided reliable, field-based estimates of large area NPP in the Midwestern United States. The total range of NPP estimated in this study (239-760 gC/m2/yr) is consistent with the estimates of cropland NPP reported by Whittaker and Likens (1975). In this study, differences in NPP which approach 50 gC/m2/yr should be treated with caution since the error analysis indicated they may be caused by errors or biases in harvest index (HI).
Sources of Error
Gaps in data reporting may have caused some errors. Some crop fields are not reported, especially if the crop has failed. The crop may be plowed under and not reported in area or yield statistics despite the primary production that was realized in part of the growing season. Furthermore, production in grazing lands is difficult to measure since the reported yield is likely to be in the form of animal production. In addition, animal grazing can have a large effect on root:shoot ratio in pastures.
The root:shoot ratio is probably the least well specified parameter used in this study. Quantifying root mass is extremely difficult and time consuming; methods are not standardized, and thus it is difficult to determine a regionally applicable value. Errors are likely to arise when significant production is lost to above- or below-ground senescence and detachment before harvest. Normal sampling errors also occur, but these are likely to be more severe for below-ground than for above-ground biomass. Only large (+50%) errors in this variable in this study had a significant effect on the overall estimates of total NPP and the interannual patterns.
Harvest index has been more extensively studied; however, no direct measurements have been reported for extrapolation over large areas. The available studies do suggest that HI is unlikely to vary more than 10% over the range of environmental conditions and management practices in the study area. In general, in areas of intensively managed farming, extremes of moisture and fertilizer deficits will not occur; where they do, the crop is likely to be plowed under before harvest and will not, therefore, be reported in the NASS statistics. The sensitivity analysis indicates that even with errors as high as 10% in the values of both the HI and the root:shoot ratio, the magnitude and temporal trends in NPP vary more from year to year owing to climatic variations than can be accounted for by errors in the estimation methods or by changes in crop management practices, such as fertilization.
5. Data Acquisition Materials and Methods:
Total NPP, including estimates of above- and below-ground components, was calculated from harvested-yield data by (1) conversion from reporting units of yield of the crop product (usually in volume) to mass, (2) conversion from fresh mass to dry mass, (3) estimation of above-ground yield using crop harvest indices, defined as the ratio of economic product (e.g., grain) dry mass to plant above-ground dry mass, and (4) estimation of below-ground yield as a function of above-ground biomass.
Estimation of Harvested Yield and Area Planted. County-level data on crop harvested yield was obtained from the National Agricultural Statistics Service (NASS, 1998). The methodology used by NASS to determine crop yield and area planted is a multistep procedure with many checks and comparisons to alternate data sources (USDA, 1999). These procedures are summarized in Prince et al. (2001).
Crop Harvest Indices. The harvest index (HI) is defined as the ratio of seed yield to above-ground biological yield (Donald, 1962; Snyder and Carlson, 1984), where biological yield includes the total dry matter the plant produces above ground. Harvest index was originally conceived by Donald (1962) as an aid in selecting efficient genotypes for plant breeding, but it has also been used to allow above-ground biomass production to be estimated from published agricultural yield statistics (Donald and Hamblin, 1976).
Historically, HI has changed in many crops as breeding programs have altered carbon allocation. Gradual changes in HI owing to plant breeding might influence the results of agricultural yield analyses and limit the historical period over which the method can be applied. Prince et al. (2001) discuss the rationale for the HI selected for the crops considered in this study.
Root:Shoot Ratio. Estimation of total NPP from measurements of above-ground production requires an understanding of the partitioning of photosynthetic products between above- and below-ground production (Snyder and Carlson, 1984). For annual crops, the root:shoot biomass ratio, measured at or near harvest maturity, may be an adequate estimator from which total production may be obtained. Prince et al. (2001) discuss the studies that provide the data on root:shoot ratios used in this analysis.
Volume to Mass and Fresh to Dry Mass Conversion Factors. The yields for some crops were reported in volume (e.g., bushels) rather than mass. For these crops, the reported yield of the economic product was multiplied by volume to mass conversion factors from Martin et al. (1976). Grain moisture contents were required for all crops to estimate the dry matter yield. These were also obtained from Martin et al. (1976), except for corn silage and hay, which were obtained from S. K. Barnhart, personal communication (Iowa Cooperative Extension Service). The reliability of these values has great economic importance since very large differences in economic value would arise if they were inaccurate, and so it seemed reasonable to use these commercially accepted values.
Calculation of NPP for Counties. Total crop and woodland NPP for each county was estimated from the reported harvest yields and the harvest indices, root:shoot ratios, volume to mass, and fresh to dry mass conversion factors in accordance with the procedures outlined by Prince et al. (2001).
Sensitivity Analysis. A sensitivity analysis of the impact of HI and root:shoot ratio on interannual NPP was performed by recalculating NPP using adjusted values for these parameters. The range of these NPP estimates for each year was then compared to the interannual variability observed using initial best estimates of HI and root:shoot ratio. The sensitivity analysis performed on four blocks of contiguous counties in Iowa indicated that total NPP is more sensitive to variations in HI than to below-ground allocation. A 10% change in the root:shoot ratio produced only a small change in total NPP. However, the same change in HI produced nearly a 10% change in total NPP, >50 gC/m2/yr. It is probable that variations in volume to mass conversion and percent moisture are relatively small, and thus no sensitivity tests were performed for these parameters.
6. Data Access:
This data is available through the Oak Ridge National Laboratory (ORNL) Distributed Active Archive Center (DAAC).
Data Archive Center:
Contact for Data Center Access Information:
E-mail: uso@daac.ornl.gov
Telephone: +1 (865) 241-3952
7. References:
NASS. 1998. Acreage. Publication number Cr Pr 2–5 (6–98), National Agricultural Statistics Service (NASS), USDA, Washington, D.C., USA.
Olson, R.J., K.R. Johnson, D.L. Zheng, and J.M.O. Scurlock. 2001. Global and Regional Ecosystem Modeling: Databases of Model Drivers and Validation Measurements. ORNL Technical Memorandum TM-2001/196. Oak Ridge National Laboratory, Oak Ridge, Tennessee, USA
Prince, S.D., J. Haskett, M. Steininger, H. Strand and R. Wright. 2001. Net primary production of U.S. Midwest croplands from agricultural harvest yield data. Ecological Applications 11: 1194-1205.
Additional Sources of Information:
Clark, D.A., S. Brown, D.W. Kicklighter, J.Q. Chambers, J.R. Thomlinson, and J. Ni. 2001. Measuring net primary production in forests: concepts and field methods. Ecological Applications 11: 356-370.
Cramer, W., R.J. Olson, S.D. Prince, and J.M.O. Scurlock. 2001. Determining present patterns of global productivity, pp: 429-449. IN: Roy, J., B. Saugier, and H. A. Mooney eds.. Terrestrial Global Productivity. Academic Press, San Diego, CA USA
Donald, C.M. 1962. In search of yield. Journal of the Australian Institute of Agricultural Science 28: 171-178.
Donald, C.M., and J. Hamblin. 1976. The biological yield and harvest index of cereals as agronomic and plant breeding criteria. Advances in Agronomy 28: 361-405.
Hastings, D.A., P.K. Dunbar, G.M. Elphingstone, M. Bootz, H. Murakami, H. Maruyama, H. Masaharu, P. Holland, J. Payne, N.A. Bryant, T.L. Logan, J.-P. Muller, G. Schreier, and J.S. MacDonald. 1999. The Global Land One-kilometer Base Elevation (GLOBE) Digital Elevation Model, Version 1.0. National Oceanic and Atmospheric Administration, National Geophysical Data Center, 325 Broadway, Boulder, Colorado 80305-3328, USA
Malmstrom, C.M., M.V. Thompson, G.P. Juday, S.O. Los, J.T. Randerson, and C.B. Field. 1997. Interannual variation in global scale net primary production: testing model estimates. Global Biogeochemical Cycles 11: 367-392.
Martin, J.H., W.H. Leonard, and D L. Stamp. 1976. Principles of field crop production. Macmillan, New York, New York, USA.
New, M.G., M. Hulme, and P.D. Jones. 1999. Representing 20th century space-time climate variability. I: Development of a 1961-1990 mean monthly terrestrial climatology. Journal of Climate 12: 829-856.
New, M.G., M. Hulme and P.D. Jones. 2000. Representing 20th century space-time climate variability. II: Development of 1901-1996 monthly grids of terrestrial surface climate. Journal of Climate 13: 2217-2238.
Olson, R.J., J.M.O. Scurlock, W. Cramer, S.D. Prince, and W.J. Parton. 1996. From sparse field observations to a consistent global data set on net primary production. Global Primary Production Data Initiative. IGBP-DIS, Paris, France.
Olson, R.J., J.M.O. Scurlock, S.D. Prince, D.L. Zheng, and K.R. Johnson (eds.). 2012. NPP Multi-Biome: Global Primary Production Data Initiative Products, R2. Data set. Available on-line [http://daac.ornl.gov] from the Oak Ridge National Laboratory Distributed Active Archive Center, Oak Ridge, Tennessee, USA doi:10.3334/ORNLDAAC/617
Prince, S.D., R.J. Olson, G. Dedieu, G. Esser, and W. Cramer. 1995. Global primary production (land) data initiative: project description. IGBP DIS, Paris, France.
Scurlock, J.M.O., W. Cramer, R.J. Olson, W.J. Parton, and S.D. Prince. 1999. Terrestrial NPP: towards a consistent data set for global model evaluation. Ecological Applications 9: 913-919.
Snyder, F.W., and G.E. Carlson. 1984. Selecting for partitioning of photosynthetic products in crops. Advances in Agronomy 37: 47-72.
Whittaker, R.H., and G.E. Likens. 1975. The biosphere and man, pp. 305-328. IN: Leith, H. and R. H. Whittaker (eds.) Primary Productivity of the Biosphere. Volume 14. Springer-Verlag, New York, NY, USA.
Zheng, D.L., S.D. Prince, and R. Wright. 2003. NPP Multi-Biome: Gridded Estimates for Selected Regions Worldwide, 1989-2001, R1. Data set. Available on-line [http://daac.ornl.gov] from the Oak Ridge National Laboratory Distributed Active Archive Center, Oak Ridge, Tennessee, USA doi:10.3334/ORNLDAAC/614
Zobler, L. 1986. A world soil file for global climate modelling. NASA Technical Memorandum TM-87802, National Aeronautics and Space Administration, Greenbelt, MD.