Get Data
Summary:
This data set contains three ASCII text files for the Bridger grassland study site in the Rocky Mountains (45.78 N, -110.78 W, Elevation 2,340 m). Two files contain above- and below-ground biomass data, one for each treatment (ungrazed and moderately grazed). The third file contains climate data from the Big Timber weather station (45.80 N, -110.00 W, Elevation 1,249 m) near Bridger.
Dynamics of above- and below-ground plant biomass were monitored by harvest technique at roughly 2-week intervals during the growing season for the years 1970, 1972, and 1973. Data on above-ground live biomass, standing dead matter, and litter are provided for each sampling date. Below-ground biomass (roots and crowns) are provided for 0-30 cm and 0-50 cm depths. Data were collected as part of a coordinated study over 1-3 years at ten grassland sites of the central and western United States under the U.S. Grassland Biome Project of the International Biological Program (IBP).
Above-ground net primary production (ANPP) was estimated, conservatively, by summing peak biomass of individual species. Below-ground net primary production (BNPP) was estimated as the sum of positive increments in total root biomass (including root crowns). Values varied according to treatment.
Revision Notes: Only the documentation for this data set has been modified. The data files have been checked for accuracy and are identical to those originally published in 1998.
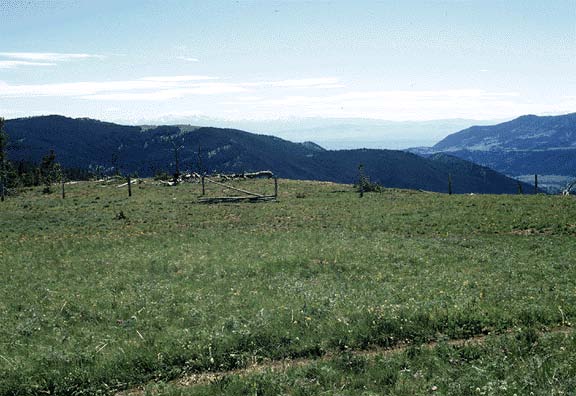
Figure 1. General view of the Bridger grassland site, Montana, USA. (Photograph taken June/July 1971).
Additional Documentation
The Net Primary Productivity (NPP) data collection contains field measurements of biomass, estimated NPP, and climate data for terrestrial grassland, tropical forest, temperate forest, boreal forest, and tundra sites worldwide. Data were compiled from the published literature for intensively studied and well-documented individual field sites and from a number of previously compiled multi-site, multi-biome data sets of georeferenced NPP estimates. The principal compilation effort (Olson et al., 2001) was sponsored by the NASA Terrestrial Ecology Program. For more information, please visit the NPP web site at http://daac.ornl.gov/NPP/npp_home.html.
Data Citation:
Cite this data set as follows:
Weaver, T., and D.D. Collins. 2014. NPP Grassland: Bridger, USA, 1970-1973, R1. Data set. Available on-line [http://daac.ornl.gov] from Oak Ridge National Laboratory Distributed Active Archive Center, Oak Ridge, Tennessee, USA. doi:10.3334/ORNLDAAC/205
This data set was originally published as:
Weaver, T., and D.D. Collins. 1998. NPP Grassland: Bridger, U.S.A., 1970-1973. Data set. Available on-line [http://daac.ornl.gov] from Oak Ridge National Laboratory Distributed Active Archive Center, Oak Ridge, Tennessee, U.S.A.
Table of Contents:
- 1 Data Set Overview
- 2 Data Description
- 3 Applications and Derivation
- 4 Quality Assessment
- 5 Acquisition Materials and Methods
- 6 Data Access
- 7 References
1. Data Set Overview:
Project: Net Primary Productivity (NPP)
Productivity of a mountain grassland was monitored at the Bridger study site during the years 1970, 1972, and 1973 as part of a coordinated study at ten grassland sites in the central and western regions of the United States under the US. Grassland Biome Project of the International Biological Program (IBP). The Bridger study site (45.78 N,- 110.78 W, Elevation 2,340 m) is situated at the U.S. Forest Service Bangtail Ridge Ranger Station in the Rocky Mountains, 22- km northeast of the city of Bozeman, Montana. At this mountain grassland, Festuca idahoensis was the dominant species with Agropyron subsecundum and the forbs Lupinus argenteus being important contributors to the primary producer standing crop. The high meadow was surrounded by forests dominated by Abies lasiocarpa and Pinus contorta.
The dynamics of above- and below-ground plant biomass for two replications of grazed and "ungrazed" (relatively undisturbed) treatments were monitored at roughly 2-week intervals during the growing season. The ungrazed treatment area had been protected from grazing since 1930. Data on above-ground live biomass, standing dead matter, and litter are available. Below-ground biomass samples (roots and crowns) were harvested at 0-30 cm and 0-50 cm depths.
Above-ground net primary production (ANPP) was estimated, conservatively, by summing peak biomass of individual species. Below-ground net primary production (BNPP) was estimated as the sum of positive increments in total root biomass (including root crowns).
Table 1. Annual above-ground net primary production at Bridger, 1970 and 1972 (g/m2/year)
| YEAR | UNGRAZED | GRAZED |
|---|---|---|
| 1970 | 168 | 145 |
| 1972 | 330 | 344 |
Source: Sims and Singh (1978b), Table 2, p. 578. ANPP for the ungrazed grassland is also reported in Esser (2013) and Scurlock and Olson (2012).
Table 2. Annual below-ground net primary production at Bridger, 1972 (g/m2/year)
| YEAR | UNGRAZED | GRAZED |
|---|---|---|
| 1972 | 471 | 573 |
Source: Sims and Singh (1978b), Table 4, p. 583. BNPP for the ungrazed grassland is also reported in Esser (1998) and Scurlock and Olson (2012).
Note: Productivity values are also reported in Olson et al. (2013a; b), but do not agree with the values given above because different calculation methods and conversion factors were used.
Climate data for the period 1894-1994 were obtained from the Big Timber weather station (45.80 N, -110.00 W, Elevation 1,249 m) near Bridger.
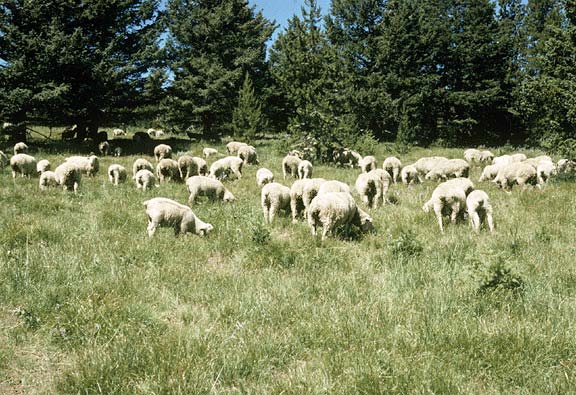
Figure 2. Targhee and Colombia sheep on the grazed portion of the Bridger grassland site, Montana, USA. (Photograph taken July 1973 by Larry Nell, Colorado State University).
2. Data Description:
Spatial Coverage
Site: Bridger, Montana, USA
Site Boundaries: (All latitude and longitude given in decimal degrees)
| Site (Region) | Westernmost Longitude | Easternmost Longitude | Northernmost Latitude | Southernmost Latitude | Elevation (m) |
|---|---|---|---|---|---|
| Bridger, Montana, USA | -110.78 | -110.78 | 45.78 | 45.78 | 2,340 |
Spatial Resolution
Information not available, but assumed to be 0.5 x 0.5-m2 plots.
Temporal Coverage
Biomass measurements were made from 1970/06/29 through 1973/09/18. Data for the 1971 growing season are not available. Climate data are available from 1894/01/01 through 1994/12/31.
Temporal Resolution
Biomass measurements were made at roughly 2-week intervals during the growing seasons of 1970, 1972, and 1973. NPP estimates are based on plant dry matter accumulation, expressed as g/m2/year. Climate data are expressed as monthly and annual precipitation amounts (mm) and monthly and annual average maximum/minimum temperature (C). Monthly and annual climatic means are available for the 1894-1994 period.
Data File Information
Table 3. Data files in this data set archive
| FILE NAME | TEMPORAL COVERAGE | FILE CONTENTS |
|---|---|---|
| brd1_npp.txt | 1970/06/30 - 1973/09/18 | Above- and below-ground biomass data for an ungrazed grassland at Bridger, Montana, USA |
| brd2_npp.txt | 1970/06/29 - 1972/11/08 | Above- and below-ground biomass data for a moderately grazed grassland at Bridger, Montana, USA |
| brd_cli.txt | 1894/01/01 - 1994/12/31 | Monthly and annual climate data from the weather station at Big Timber near Bridger, Montana, USA |
NPP Data. Biomass estimates for the Bridger site are in two files, one for each treatment (ungrazed and grazed) (Table 3). The data sets are ASCII files (.txt format). The first 18 lines are metadata; data records begin on line 19. The variable values are tab delimited. The values -9, -99, -99.9, and -999.9 are used to denote missing values. Data for 1971 are not available. All NPP units are in g/m2/year (dry matter weight); below-ground sampling depths are in cm.
Table 4. Column headings in NPP files
| COLUMN HEADING | DEFINITION | UNITS |
|---|---|---|
| Site | Site where data were gathered (code refers to site identification) | Text |
| Treatmt | Long term management of site (code refers to treatment described in metadata in data file) | |
| Year | Year in which data were collected | Numeric |
| Mn | Month in which data were collected | |
| Dy | Day on which data were collected | |
| Jdate | Date in Julian year | |
| Tyear | Date in decimal year (year plus the Julian date divided by 365) | |
| nrep | Number of replicates | |
| nplots | Number of sampling plots | |
| AGbiomass | Mean above-ground standing crop of living biomass; each value is the mean of two replicates | g/m2/yr |
| AGbm_SE | Standard error for above-ground living biomass measurement | |
| Olddead | Mean above-ground stnding crop of old dead biomass (i.e., carry-over material from the previous year); each value is the mean of two replicates | |
| Oldd_SE | Standard error for above-ground old dead biomass measurement | |
| Newdead | Mean above-ground standing crop of new dead biomass (i.e., material produced and senesced during the current growing season); each value is the mean of two replicates | |
| Newd_SE | Standard error for above-ground new dead biomass measurement | |
| AGTotclip | Mean total above-ground standing crop biomass (living + dead); each value is the mean of two replicates | |
| Total_SE | Standard error for total above-ground biomass measurement | |
| BGtop30 | Mean below-ground standing crop biomass in top 30 cm sample; each value is the mean of two replicates | |
| BGtotal | Mean total below-ground stnding crop biomass; each value is the mean of two replicates | |
| BGdepth | Maximum below-ground sampling depth | cm |
Note: All values are from Sims et al. (1978), Appendix III.
Sample NPP Data Record
| Site;Treatmnt;Year;Mo;Dy;Jdate;Tyear;nrep;nplots;AGbiomass;AGbm_SE;Olddead;Oldd_SE;Newdead;Newd_SE; AGTotclip;Totcl_SE;nrep_BG;nplot_BG;BGtop30;BGtotal;BGdepth brd;ungrazed;1970;06;30;181;1970.496; 2; 40; 63.2; 4.6; 35.5; 4.9; 0.0; 0.0; 98.7; 7.0; -9;-99;-999.9;-999.9; -99.9 brd;ungrazed;1970;07;08;189;1970.518; 2; 40; 109.7; 14.6; 6.9; 2.3; 0.0; 0.0; 116.6; 14.8; -9;-99;-999.9;-999.9; -99.9 brd;ungrazed;1970;07;20;201;1970.551; 2; 40; 144.4; 12.7; 5.7; 2.3; 0.0; 0.0; 150.1; 12.3; -9;-99;-999.9;-999.9; -99.9 ... |
Climate Data. The data set is an ASCII file (.txt format). The first 18 lines are metadata; data records begin on line 19. The variable values are delimited by semicolons. The value -999.9 is used to denote missing values.
| COLUMN HEADINGS | DEFINITION |
|---|---|
| Site | Unique 3-character code for each site based on the first three consonants in the site name (e.g., brd for Bridger) |
| Temp (Temporal) |
Indicates whether the values in that row are either long-term (i.e, mulit-year) or annual data for the specified parameter. For multi-year, the values are: mean=mean values (monthly and annual) calculated for the years of data as noted in the documentation numb=number of years of data included in a reported mean value stdv=standard deviation of a mean value Annual data: 19XX=monthly and annual parameter values for the specified year (e.g., 1972) |
| Parm | Parameter, indicates the meteorological data reported in that row. prec-total precipitation for the month or year tmax=maximum temperature for the month or year reported in degrees C tmin=minimum temperature for the month or year reported in degrees C |
|
Description of specific Temp and Parm data values: Long-term data: site;mean;prec; Multi-year mean of total precipitation for each month [Jan, Feb, Mar, …, Dec] and mean of total annual precipitation across all years [Year] (mm) site;mean;tmax; Multi-year mean of maximum temperature for each month [Jan, Feb, Mar, …, Dec] and mean of annual maximum temperature across all years [Year] (C) site;mean;tmin; Multi-year mean of minimum temperature for each month [Jan, Feb, Mar, …, Dec] and mean of annual minimum temperature across all years [Year] (C) … site; numb and stdv; repeat for prec, tmax, and tmin; Annual data: site;19XX;prec; Total precipitation for each month [Jan, Feb, Mar,.....Dec] and total precipitation for the year 19XX [Year] (mm) site;19XX;tmax; Maximum temperature for each month [Jan, Feb, Mar,.....Dec] and maximum for the year 19XX [Year] (C) site;19XX;tmin; Minimum temperature for each month [Jan, Feb, Mar,.....Dec] and minimum for the year 19XX [Year] (C) … site;19XX;(prec, tmax, and tmin); repeat for reported years. Annual data missing value note: If a monthly parm value is missing, the parm value for [Year] is also set to missing (-999.9). |
Sample Climate Data Record
| Site;Temp;Parm; Jan; Feb; Mar; Apr; May; Jun; Jul; Aug; Sep; Oct; Nov; Dec; Year brd ;mean;prec; 15.6; 12.4; 24.5; 38.7; 68.2; 61.5; 31.0; 28.9; 38.0; 32.1; 20.1; 14.1; 382.8 brd ;mean;tmax; 0.74; 3.59; 7.68; 13.54; 19.02; 24.53; 29.77; 29.13; 21.88; 15.37; 7.25; 2.45; 30.52 brd ;mean;tmin; -10.56; -9.02; -5.79; -1.11; 3.43; 8.02; 11.05; 9.93; 4.62; 0.26; -4.82; -8.58; -12.80 brd ;numb;prec; 86; 86; 86; 86; 84; 83; 84; 83; 83; 83; 84; 84; 81 brd ;numb;tmax; 90; 91; 91; 90; 90; 90; 90; 90; 90; 90; 92; 90; 90 brd ;numb;tmin; 90; 91; 91; 91; 91; 91; 91; 90; 90; 92; 92; 90; 90 brd ;stdv;prec; 13.3; 9.5; 17.9; 38.3; 38.7; 42.4; 21.6; 21.3; 26.3; 28.6; 17.6; 12.4; 87.0 brd ;stdv;tmax; 3.92; 3.62; 3.02; 2.73; 2.45; 2.47; 2.27; 2.09; 2.58; 2.88; 2.92; 2.86; 1.87 brd ;stdv;tmin; 4.33; 3.55; 2.56; 1.58; 1.29; 1.32; 1.35; 1.39; 1.49; 1.77; 2.16; 3.10; 3.45 brd ;1894;prec; -999.9; -999.9; -999.9; 37.8; 94.7; -999.9; -999.9; -999.9; -999.9; -999.9; -999.9; -999.9; -999.9 … Where, Temp (temporal) - specific year or long-term statistic: mean = mean based on all years numb = number of years stdv = standard deviation based on all years Parm (parameter): prec = precipitation for month or year (mm) tmax = mean maximum temperature for month or year (C) tmin = mean minimum temperature for month or year (C) |
3. Data Application and Derivation:
Monthly grassland biomass dynamics data are provided for comparison with model output and estimation of NPP. Climate data are provided for use in driving ecosystem/NPP models.
Data at Bridger were collected as part of a coordinated study over 1-3 years at ten grassland sites of the central and western United States, under the U.S. Grassland Biome Project of the International Biological Program (IBP). The aim of the US/IBP Grassland Biome program was to study the whole U.S. grassland system, particularly the seasonal biomass and energy dynamics of grasslands across multiple trophic levels (Sims et al., 1978). The ten sites for which NPP data are reported encompassed six major grassland types, ranging from latitude 30 to 48 N and longitude 96 to 123 W, and from 390-m to 2,340-m in elevation. Mean annual precipitation for the ten sites ranged from 228 mm to 930 mm, and mean annual temperature from 2.7 degrees C to 15.2 degrees C.
4. Quality Assessment:
Under the US Grassland Biome Project, above-ground and below-ground biomass and productivity at the participating grassland sites were measured and calculated using comparable methods.
Sources of Error
Annual ANPP determined by the summation of peak live weights of individual species can yield a conservative estimate because material produced, senesced, and detached before the peak live weight of a given species occurs is unaccounted for. The presence of different growth forms in the variety of vegetation types grasslands complicates the study of crowns and estimation of crown biomass production. Difficulties and inaccuracies involved in the estimation of root production arise primarily because of insufficient information on the periods of greatest root growth and decomposition, and the unaccounted losses of organic root secretions, sloughing of root hairs, root caps, and cortical layers, translocation of organic material to the soil and to the fungal components of mycorrhizal roots, death and decay of fine roots, and consumption of fine roots by soil organisms. Estimates of root production should therefore be viewed with the constraints imposed by the measurement procedures used.
5. Data Acquisition Materials and Methods:
Site Information
The study site is located at the US Forest Service Bangtail Ridge Ranger Station in the Rocky Mountains, 22 km northeast of the city of Bozeman, Montana. The study site is a high mountain meadow (modified Bailey ecoregion alpine meadow steppe, #M331) occurring at an elevation of 2,340 m. The terrain is characterized by gentle to steep slopes.
The total number of vegetation species recorded at the Bridger site was 16. This very cool mountain grassland site was dominated by cool-season plants; warm-season plants were <1 to 2% of the seasonal biomass at Bridger. Festuca idahoensis was the dominant species; in addition, Agropyron subsecundum and the forbs Lupinus argenteus were important contributors to the primary producer standing crop. Cool-season forbs comprised 15-19% of the seasonal biomass at Bridger. The high mountain meadow was surrounded by forests dominated by Abies lasiocarpa and Pinus contorta.
The soil type at Bridger was silty loam Mollisol. One of the special characteristics of the soils at Bridger, which may be relevant to root development and vegetation-characteristics, was the stony nature of the soil profiles at the study sites.
The experimental design included two treatments: ungrazed (i.e., long-term absence of grazing by large domestic herbivores) and moderately grazed grasslands. The ungrazed treatment area had been protected from grazing since 1930. The grazed treatment refers to grazing during the previous growing seasons, since no domestic animals were allowed during the sampling years. Each treatment area had one or two replications, each with 20 to 40 plots per replication, depending on the study year and treatment area.
Monthly and annual climate data were calculated from daily observations obtained from the Big Timber weather station (45.80 N, -110.00 W, Elevation 1,249 m) near Bridger. Climate variables included precipitation amount and maximum/minimum temperature. Mean annual precipitation was 382.8 mm, mean annual maximum temperature was 30.52 degrees C, and mean annual minimum temperature was -12.8 degrees C based on the long-term climatic record (1894-1994) in this data set. The length of thermal potential growing season (defined as the number of consecutive days with a 15-day running-mean air temperature at or above 4.4 degrees C) at this cool mountain meadow averaged 123 days (1970-1972). The growing season began as early as May 16.
Intra-seasonal dynamics of the various above- and below-ground primary producer compartments were studied at Bridger. The experimental design included two replications of ungrazed (i.e., long-term absence of grazing by large domestic herbivores by enclosure) and recently-grazed treatments. Structural characteristics studied included quantities of cool- and warm-season plants at each plot (note: warm-season plants were only <1 to 2% of the seasonal biomass at Bridger), and magnitude and seasonality of primary producer compartments. These latter measurements included seasonal above-ground live biomass, above-ground dead matter (recent plus old dead), total above-ground standing crop (living plus dead biomass), below-ground biomass by depth (root and crown inclusive), and total below-ground biomass. Litter decomposition and below-ground root turnover were also separately measured but the data are not included in this data set.
Above-ground biomass was measured by the harvest technique over successive 2-week intervals during the growing season. The aerial plant material was clipped at the soil surface and separated into current live and recent and old dead compartments. Recent and old dead components were determined primarily on the basis of color and the experience of the field and laboratory workers. Recent dead was the material produced and senesced during the current growing season, while old dead was carry-over material from the previous year. Live and dead material was further separated by species. Litter material was collected by hand from the harvest plots (1970) and by a vacuum method (1972). All material was oven-dried at c. 60 degrees C. Aerial materials were presented on a dry matter basis while litter weights were converted to an ash-free basis. Current live compartment matter was summed to obtain total living material, and recent dead and old dead compartments were summed to give total dead material.
Below-ground biomass was sampled by coring within the harvested plots to a depth sufficient to include at least 90% of the root mass. At Bridger, that was 50 cm. In 1970, soil cores containing root samples were separated into 10-cm increments, and the increments were washed over a 32-mesh screen. In subsequent years, an additional fine screen was used during the washing process. No separation of roots and crowns was made. All material was oven-dried at c. 60 degrees C, weighed, and then ashed.
Intra-seasonal biomass dynamics data are provided in this data set. Annual ANPP or shoot production was determined by the summation of peak live weights of individual species. Net root production was estimated from the summation of the significant positive increases in root biomass by depth. Annual BNPP was based on total net root production which included crown biomass.
The vegetation sampling procedures at Bridger are outlined in more detail by Collins and Weaver (1972) and Sims et al. (1978). Data analysis and results are discussed by Sims and Singh (1978b).
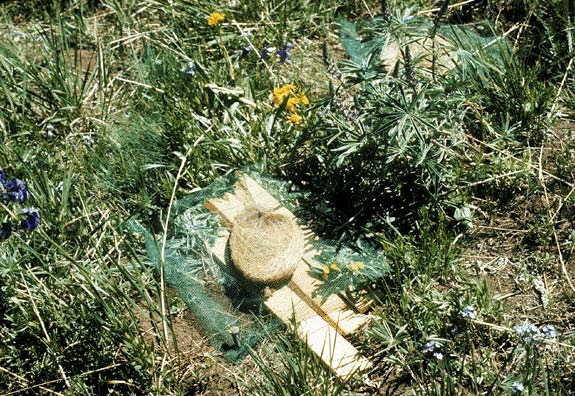
Figure 3. Litter decomposition bags at the Bridger grassland site, Montana, USA. (Photograph taken 1970-1973 by John Mitchell, Colorado State University).
Climate data
Climate data accompanying this NPP data set are from the Big Timber weather station (45.80 N, -110.00 W, Elevation 1,249 m) near Bridger. Climate data include daily observations of Tmax, Tmin, and precip amount.
For a given month, the maximum value of the daily Tmax for that month and the minimum value of the Tmin for that month is provided. For the year, the maximum value of the monthly Tmax is the annual Tmax and for the year the minimum value of the monthly Tmin values is the annual Tmin. Daily precipitation amount is summed to yield a monthly precipitation amount and the monthly precipitation is summed to provide an annual precipitation amount.
The multi-year mean monthly Tmax is the average of the Tmax values for that month for each year of the record. For example the mean monthly Tmax for April is the mean of each April’s Tmax for the observation period of record. Mean monthly Tmin and Mean monthly precip amount are calculated similarly.
These data are available through the Oak Ridge National Laboratory (ORNL) Distributed Active Archive Center (DAAC).
Data Archive Center:
Contact for Data Center Access Information:
E-mail: uso@daac.ornl.gov
Telephone: +1 (865)
241-3952
7. References
Collins, D.D., and T.W. Weaver. 1972. Grassland Biome Studies at the Bridger Site, 1971. US/IBP Grassland Biome Technical Report, No. 198. Colorado State University, Fort Collins, Colorado.
Olson, R.J., K.R. Johnson, D.L. Zheng, and J.M.O. Scurlock. 2001. Global and Regional Ecosystem Modeling: Databases of Model Drivers and Validation Measurements. ORNL Technical Memorandum TM-2001/196. Oak Ridge National Laboratory, Oak Ridge, Tennessee, U.S.A.
Sims, P.L., J.S. Singh, and W.K. Lauenroth. 1978. The structure and function of ten western North American grasslands. I. Abiotic and vegetational characteristics. Journal of Ecology 66: 251-285.
Additional Sources of Information:
Esser, G. 2013. NPP Multi-Biome: Global Osnabruck Data, 1937-1981. Data set. Available on-line [http://daac.ornl.gov] from Oak Ridge National Laboratory Distributed Active Archive Center, Oak Ridge, Tennessee, USA doi:10.3334/ORNLDAAC/214
Olson, R.J., J.M.O. Scurlock, S.D. Prince, D.L. Zheng, and K.R. Johnson (eds.). 2013a. NPP Multi-Biome: Global Primary Production Data Initiative Products, R2. Data set. Available on-line [http://daac.ornl.gov] from the Oak Ridge National Laboratory Distributed Active Archive Center, Oak Ridge, Tennessee, USA. doi:10.3334/ORNLDAAC/617
Olson, R.J., J.M.O. Scurlock, S.D. Prince, D.L. Zheng, and K.R. Johnson (eds.). 2013b. NPP Multi-Biome: NPP and Driver Data for Ecosystem Model-Data Intercomparison, R2. Data set. Available on-line [http://daac.ornl.gov] from the Oak Ridge National Laboratory Distributed Active Archive Center, Oak Ridge, Tennessee, USA. doi:10.3334/ORNLDAAC/615
Scurlock, J.M.O., and R.J. Olson. 2002. Terrestrial net primary productivity – A brief history and a new worldwide database. Environ. Rev. 10(2): 91-109. doi:10.1139/a02-002
Scurlock, J.M.O., and R.J. Olson. 2013. NPP Multi-Biome: Grassland, Boreal Forest, and Tropical Forest Sites, 1939-1996, R1. Data set. Available on-line [http://daac.ornl.gov] from Oak Ridge National Laboratory Distributed Active Archive Center, Oak Ridge, Tennessee, USA. doi:10.3334/ORNLDAAC/653
Scurlock, J.M.O., K. Johnson, and R.J. Olson. 2002. Estimating net primary productivity from grassland biomass dynamics measurements. Global Change Biology 8(8): 736-753. DOI: 10.1046/j.1365-2486.2002.00512.x
Sims, P.L., and J.S. Singh. 1978a. The structure and function of ten western North American grasslands. II. Intra-seasonal dynamics in primary producer compartments. Journal of Ecology 66: 547-572.
Sims, P.L., and J.S. Singh. 1978b. The structure and function of ten western North American grasslands. III. Net primary production, turnover and efficiencies of energy capture and water use. Journal of Ecology 66: 573-597.