Get Data
Summary:
This data set contains two ASCII text files, one providing productivity measurements for a chalk grassland on Beacon Hill, West Sussex, U.K. (50.92 N, -0.85 W) and the other containing climate data from a weather station at the former King's College London, Rogate Field Centre, 6 km distant (51.01 N, -0.85 W). Measurements of above-ground live biomass and total dead matter were made by harvesting 0.25-m2 quadrats in the 20 x 20-m study area at eight to ten week intervals from March 1972 to April 1973. Precipitation amount and minimum/maximum temperature were recorded from 1969 through 1993.
Above-ground net primary production (ANPP) was estimated by several methods: 332 g/m2/year (annual increase in living biomass, sum of species); 355 g/m2/year (peak or maximum live biomass, plant dry matter weight); 773 g/m2/year (maximum live + dead biomass); 310 g/m2/year (annual increase in living biomass carbon by summing positive increments in biomass); and 691 g/m2/year (annual net production accounting for leaf turnover). The carbon content of ANPP (accounting for leaf turnover) was estimated to be 310 gC/m2/year using a conversion factor of 0.45. Below-ground production was not measured.
Revision Notes: Only the documentation for this data set has been modified. The data files have been checked for accuracy and are identical to those originally published in 1998.
Additional Documentation:
The Net Primary Productivity (NPP) data collection contains field measurements of biomass, estimated NPP, and climate data for terrestrial grassland, tropical forest, temperate forest, boreal forest, and tundra sites worldwide. Data were compiled from the published literature for intensively studied and well-documented individual field sites and from a number of previously compiled multi-site, multi-biome data sets of georeferenced NPP estimates. The principal compilation effort (Olson et al., 2001) was sponsored by the NASA Terrestrial Ecology Program. For more information, please visit the NPP web site at http://daac.ornl.gov/NPP/npp_home.html.
Data Citation:
Cite this data set as follows:
Williamson, P., and J. Pitman. 2014. NPP Grassland: Beacon Hill, U.K., 1972-1973, R1. Data set. Available on-line [http://daac.ornl.gov] from Oak Ridge National Laboratory Distributed Active Archive Center, Oak Ridge, Tennessee, USA. doi:10.3334/ORNLDAAC/204
This data set was originally published as:
Williamson, P., and J. Pitman. 1998. NPP Grassland: Beacon Hill, U.K., 1972-1973. Data set. Available
on-line [http://daac.ornl.gov] from Oak Ridge National Laboratory Distributed Active Archive Center,
Oak Ridge, Tennessee, U.S.A.
Table of Contents:
- 1 Data Set Overview
- 2 Data Description
- 3 Applications and Derivation
- 4 Quality Assessment
- 5 Acquisition Materials and Methods
- 6 Data Access
- 7 References
1. Data Set Overview:
Project: Net Primary Productivity (NPP)
Productivity of a chalk grassland was studied from 1972 to 1973 at Beacon Hill, West Sussex, U.K. Measurements of above-ground live biomass and total dead matter were made by harvesting at eight to ten week intervals. ANPP was estimated by several methods, including peak live biomass, peak total live and dead biomass, and accounting for turnover determined from marked leaves. Below-ground production was not measured.
The 20 x 20-m study site (50.92 N, -0.85 W) is located on the western slope of Beacon Hill, about 30-km northeast of Portsmouth, U.K. The site is fairly representative of the grasslands that have established over several hundred years by sheep grazing on the chalk hills of southern England. The climate is very mild and temperate, with relatively warm winters and rainfall distributed throughout the year. Grazing by sheep and rabbits had declined in the 20 years prior to the study and was very light during the study period.
Detailed biomass data for nine graminaceous species categories (92% of total matter) and a range of forbs are available from March 1972 to April 1973. ANPP was estimated by several methods, giving values of 355 g/m2 (peak or maximum live biomass, plant dry matter weight), 773 g/m2 (maximum live + dead biomass), 310 g/m2 (annual increase in living biomass by summing positive increments in biomass), and 691 g/m2 (annual net production accounting for leaf turnover) (Esser, 1998; Scurlock and Olson, 2012; Williamson, 1976). The carbon content of ANPP (accounting for leaf turnover) was estimated to be 310 gC/m2/yr using a conversion factor of 0.45 (Olson et al., 2013a; b).
Climate data for 1969-1993 are available from a weather station at the former King's College London, Rogate Field Centre, 6 km distant (51.01 N, 0.85 W).
2. Data Description:
Spatial Coverage
Site: Beacon Hill, West Sussex, U.K.
Site Boundaries: (All latitude and longitude given in decimal degrees)
| Site (Region) | Westernmost Longitude | Easternmost Longitude | Northernmost Latitude | Southernmost Latitude | Elevation (m) |
|---|---|---|---|---|---|
| Beacon Hill, U.K. | -0.85 | -0.85 | 50.92 | 50.92 | 205 |
Spatial Resolution
Field studies were carried out in a 20 x 20-m plot. Within the study plot, 20 square quadrats, each of 0.25-m2, were randomly selected on each sampling occasion.
Temporal Coverage
Above-ground biomass measurements were made by harvesting living and dead material from 1972/03/30 through 1973/04/24. Below-ground biomass measurements were not made. Climate data are available from 1969/01/01 through 1993/12/31.
Temporal Resolution
Above-ground biomass measurements were made at eight to ten week intervals. ANPP estimates are based on plant dry matter accumulation, expressed as g/m2. Climate data are expressed as monthly and annual precipitation amounts (mm) and monthly and annual mean maximum/minimum temperature ( degrees C) for the 1969-1993 period.
Data File Information
Table 1. Data files in this data set archive
| FILE NAME | TEMPORAL COVERAGE | FILE CONTENTS |
|---|---|---|
| bcn_npp.txt | 1972/03/30-1973/04/24 | Above-ground biomass data for the chalk grasslands at Beacon Hill, U.K. |
| bcn_cli.txt | 1969/01/01-1993/12/31 | Climate data from a weather station near Beacon Hill, U.K. |
NPP Data. Above-ground biomass estimates for the Beacon Hill site are provided in one ASCII file (.txt format). The variable values are tab delimited. The first 18 lines are metadata; data records begin on line 19. There are no missing values. All biomass units are in g/m2 (dry matter weight).
ANPP (summarized in this data set from Williamson, 1976) was estimated by various methods: from peak or maximum live biomass, plant dry matter weight; from maximum live plus dead biomass; from annual increase in living biomass (by summing positive increments in biomass); and from annual net production accounting for leaf turnover. All ANPP units in this data set are given as g/m2/year (dry matter weight).
Table 2. Column headings in NPP file
| COLUMN HEADING | DEFINITION | UNITS |
|---|---|---|
| Site | Site where data were gathered (code refers to site identification) | Text |
| Treatmt | Long term management of site (code refers to treatment described in metadata in data file) | Text |
| Year | Year in which data were collected | Numeric |
| Mn | Month in which data were collected | |
| Dy | Day on which data were collected | |
| Tyear | Date in decimal year (year plus the Julian date divided by 365) | |
| AGbiomass | Above-ground maximum living biomass | g/m2 |
| AGtotdead | Above-ground maximum dead biomass | g/m2 |
| AGtotmat | Above-ground total maximum biomass (living plus dead material) | g/m2 |
Note: All data are from Williamson (1976).
Sample NPP Data Record
|
Site;Treatmt;Year;Mn;Dy;Tyear; AGbiomass;AGtotdead;AGtotmat bcn;lngtrm;1972;03;30;1972.247; 67.7; 506.7; 574.4 bcn;lngtrm;1972;06;02;1972.422; 198.4; 372.2; 570.7 ... |
Climate Data. Climate data are provided in one ASCII file (.txt format).The variable values are delimited by semicolons. Missing values are denoted by -999.9. The first 18 lines are metadata; data records begin on line 19.
| COLUMN HEADINGS | DEFINITION |
|---|---|
| Site | Unique 3-character code for each site based on the first three consonants in the site name (e.g., bcn for Beacon Hill) |
| Temp (Temporal) |
Indicates whether the values in that row are either long-term (i.e, mulit-year) or annual data for the specified parameter. For multi-year, the values are: mean=mean values (monthly and annual) calculated for the years of data as noted in the documentation numb=number of years of data included in a reported mean value stdv=standard deviation of a mean value Annual data: 19XX=monthly and annual parameter values for the specified year (e.g., 1972) |
| Parm | Parameter, indicates the meteorological data reported in that row. prec-total precipitation for the month or year tmax=maximum temperature for the month or year reported in degrees C tmin=minimum temperature for the month or year reported in degrees C |
|
Description of specific Temp and Parm data values: Long-term data: site;mean;prec; Multi-year mean of total precipitation for each month [Jan, Feb, Mar, …, Dec] and mean of total annual precipitation across all years [Year] (mm) site;mean;tmax; Multi-year mean of maximum temperature for each month [Jan, Feb, Mar, …, Dec] and mean of annual maximum temperature across all years [Year] (C) site;mean;tmin; Multi-year mean of minimum temperature for each month [Jan, Feb, Mar, …, Dec] and mean of annual minimum temperature across all years [Year] (C) … site; numb and stdv; repeat for prec, tmax, and tmin; Annual data: site;19XX;prec; Total precipitation for each month [Jan, Feb, Mar,.....Dec] and total precipitation for the year 19XX [Year] (mm) site;19XX;tmax; Maximum temperature for each month [Jan, Feb, Mar,.....Dec] and maximum for the year 19XX [Year] (C) site;19XX;tmin; Minimum temperature for each month [Jan, Feb, Mar,.....Dec] and minimum for the year 19XX [Year] (C) … site;19XX;(prec, tmax, and tmin); repeat for reported years. Annual data missing value note: If a monthly parm value is missing, the parm value for [Year] is also set to missing (-999.9). |
Sample Climate Data Record
|
Site;Temp;Parm; Jan; Feb; Mar; Apr; May; Jun; Jul; Aug; Sep; Oct; Nov; Dec; Year bcn;mean;prec; 104.4; 64.7; 70.1; 53.8; 51.3; 59.3; 54.3; 61.2; 68.2; 92.2; 98.8; 93.1; 858.5 bcn;mean;tmax; 7.4; 7.4; 10.3; 12.7; 16.7; 19.3; 21.7; 21.5; 19 14.8; 10.7; 8.3; 22.2 bcn;mean;tmin; 1.3; 1.1; 2.8; 3.5; 6.4; 9.1; 11.4; 10.9; 8.7; 6.4; 3.6; 2.4; -0.2 bcn;numb;prec; 23; 24; 20; 21; 24; 22; 23; 23; 22; 22; 24; 22; 14 bcn;numb;tmax; 24; 23; 24; 23; 23; 24; 24; 23; 23; 23; 22; 20; 18 bcn;numb;tmin; 24; 24; 24; 23; 22; 24; 25; 24; 24; 24; 24; 23; 20 bcn;stdv;prec; 52.9; 45.3; 36.9; 26.7; 32.1; 39.4; 28.7; 45.9; 50.6; 75.6; 60.4; 48.1; 105.2 bcn;stdv;tmax; 1.9; 2.0; 1.5; 1.3; 1.8; 2.0; 1.8; 1.8; 1.2; 1.3; 1.1; 1.5; 1.7 bcn;stdv;tmin; 1.9; 2.0; 2.5; 0.9; 0.8; 0.8; 1.1; 0.8; 1.1; 1.3; 1.5; 1.6; 1.7 bcn;1969;prec; -999.9; -999.9; -999.9; -999.9; -999.9; -999.9; -999.9; 28.8; 36.6; 2.4; 140.3; 89.5; -999.9 bcn;1969;tmax; -999.9; -999.9; -999.9; -999.9; -999.9; -999.9; 23.3; 21.4; 20.0; 18.0; 10.6; 6.6; -999.9 bcn;1969;tmin; -999.9; -999.9; -999.9; -999.9; -999.9; -999.9; 11.6; 11.7; 9.2; 7.3; 2.1; 0.8; -999.9 … Where, Temp (temporal) - specific year or long-term statistic: mean = mean based on all years numb = number of years stdv = standard deviation based on all years Parm (parameter): prec = precipitation for month or year (mm) tmax = mean maximum temperature for month or year (C) tmin = mean minimum temperature for month or year (C) |
3. Data Application and Derivation:
Monthly grassland biomass data are provided for comparison with models and estimation of NPP. Application of turnover time to harvest data raised the estimate of above-ground annual net production to 691 g/m2 (13,317 kJ/m2/yr). This figure was higher than the maximum (peak) recorded biomass (335 g/m2/yr), less than maximum living plus dead biomass (773 g/m2/yr), and 2.1 times higher than the annual increase in living biomass, sum of species (332 g/m2/yr). Results from other studies confirm that the determination of biomass turnover is necessary for the correct estimation of primary production by harvest methods.
Climate data are provided for use in driving ecosystem/NPP models.
4. Quality Assessment:
The approach taken in this study provided reliable, field-based estimates of grassland ANPP. However, only limited comparison were made with production figures for other comparable sites. This is because there were no other detailed studies on the production of semi-natural grasslands in lowland Britain at the time of this work, in spite of the considerable work on grassland floristic composition. Also, few production estimates for other plant communities considered the effects of turnover.
Sources of Error
The life span of flowering stems was not directly measured but observed to be similar to that of leaves. Any errors that resulted from disregarding flowering were not considered serious, although more precise data on the turnover of flowering stems, and their importance in the composition of the standing crop, would have been desirable.
5. Data Acquisition Materials and Methods:
Site Information
The study site is located on the western slope of Beacon Hill, about 30 km northeast of Portsmouth, U.K., at an elevation of 205 m. The site is fairly representative of the grasslands established over several hundred years by sheep grazing on the chalk hills of southern England. Grazing by sheep and rabbits had declined in the 20 years prior to the study, and had been very light since 1970.
The vegetation of the study plot contained no woody species and was comparatively uniform in composition. The dominant graminaceous species was Festuca rubra. Other common chalkland grasses were Arrhenatherum elatius, Dactylis glomerata, Helictotrichon pratense and H. pubescens. Graminaceous species make up 92% of the total above-ground matter. Soil type is humic rendzina mollisol with a pH of 7.5-8.0 at 1-cm and also at 10-cm depth.
Methods
The standing crop of vegetation was measured by harvesting twenty square quadrats, each of 0.25 m2, at eight to ten week intervals. On each sampling occasion, quadrats were selected from the 20 x 20-m study plot using random number coordinates. All live and dead material was collected from each quadrat by clipping as close as possible to the soil surface.
The vegetation from each quadrat was separated into grasses, sedges, forbs, and mosses. The living, green material of each category separated from the dead. Living and dead forbs were sorted into species for all the samples, but living grasses were only specifically separated for ten samples randomly chosen from the twenty. Dead grasses and sedges were not sorted into species since the leaves had lost many of their identifying features. After sorting, the material was oven-dried at 80 degrees C for 36 h, and each sample weighed.
Biomass turnover was measured by marking leaves of the five most important plant species, as indicated by the harvest results. These were all grasses, namely: Arrhenatherum elatius, Dactylis glomerata, Festuca rubra, Helictotrichon pratense, and H. pubescens. On each marking occasion, twenty intact, expanded leaves of each grass were selected from a part of the study plot where that species was commonly found and marked. At fortnightly intervals after labeling, each leaf was examined and the proportion of its area remaining green was scored on a scale 0-10, allowing for the calculation of the percentage of the original material surviving (excluding those leaves that had either lost their labels or been accidentally damaged which was ~4% between successive sampling occasions).
Calculations of ANPP were made by several methods, including estimating peak live biomass (sum of species), peak total biomass (live plus dead), and net production allowing for turnover determined from marked leaves.
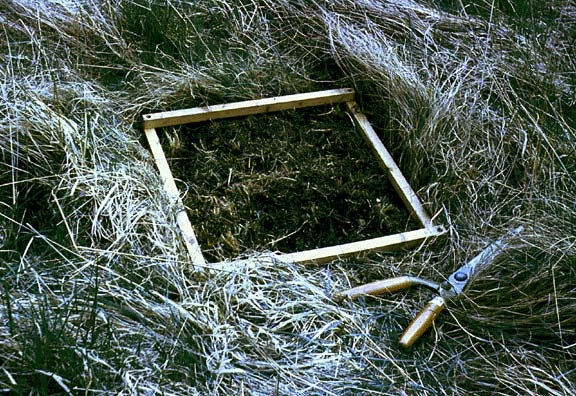
Figure 2. Clipped sampling quadrat at the Beacon Hill grassland site, U.K. (Photograph taken 1973 by Dr. P. Williamson, University of East Anglia, U.K.).
Climate data
Climate data were available from a weather station at the former King's College London field center at Rogate, 6-km distant (51.01 N, -0.85 W), at an elevation of 64 m. The climate is very mild and temperate, with relatively warm winters and rainfall distributed throughout the year. Mean annual precipitation at the weather station for the period 1969-1993 was 858.5 mm. Mean maximum temperature for this time period was 22.2 degrees C; mean minimum temperature was -0.2 degrees C.
The climate data accompanying this NPP data set was compiled from daily observations of Tmax, Tmin, and precip amount.
For a given month, the maximum value of the daily Tmax for that month and the minimum value of the Tmin for that month is provided. For the year, the maximum value of the monthly Tmax is the annual Tmax and for the year the minimum value of the monthly Tmin values is the annual Tmin. Daily precipitation amount is summed to yield a monthly precipitation amount and the monthly precipitation is summed to provide an annual precipitation amount.
The multi-year mean monthly Tmax is the average of the Tmax values for that month for each year of the record. For example the mean monthly Tmax for April is the mean of each April’s Tmax for the observation period of record. Mean monthly Tmin and Mean monthly precip amount are calculated similarly.
6. Data Access:
These data are available through the Oak Ridge National Laboratory (ORNL) Distributed Active Archive Center (DAAC).
Data Archive Center:
Contact for Data Center Access Information:
E-mail: uso@daac.ornl.gov
Telephone: +1 (865)
241-3952
7. References
Olson, R.J., K.R. Johnson, D.L. Zheng, and J.M.O. Scurlock. 2001. Global and Regional Ecosystem Modeling: Databases of Model Drivers and Validation Measurements. ORNL Technical Memorandum TM-2001/196. Oak Ridge National Laboratory, Oak Ridge, Tennessee, U.S.A.
Williamson, P. 1976. Above-ground primary production of chalk grassland allowing for leaf death. Journal of Ecology 64: 1059-1075.
Additional Sources of Information:
Esser, G. 2013. NPP Multi-Biome: Global Osnabruck Data, 1937-1981. Data set. Available on-line [http://daac.ornl.gov] from Oak Ridge National Laboratory Distributed Active Archive Center, Oak Ridge, Tennessee, USA. doi:10.3334/ORNLDAAC/214
Olson, R.J., J.M.O. Scurlock, S.D. Prince, D.L. Zheng, and K.R. Johnson (eds.). 2013a. NPP Multi-Biome: Global Primary Production Data Initiative Products, R2. Data set. Available on-line [http://daac.ornl.gov] from the Oak Ridge National Laboratory Distributed Active Archive Center, Oak Ridge, Tennessee, USA. doi:10.3334/ORNLDAAC/617
Olson, R.J., J.M.O. Scurlock, S.D. Prince, D.L. Zheng, and K.R. Johnson (eds.). 2013b. NPP Multi-Biome: NPP and Driver Data for Ecosystem Model-Data Intercomparison, R2. Data set. Available on-line [http://daac.ornl.gov] from the Oak Ridge National Laboratory Distributed Active Archive Center, Oak Ridge, Tennessee, USA. doi:10.3334/ORNLDAAC/615
Scurlock, J.M.O., and R. J. Olson. 2002. Terrestrial net primary productivity – A brief history and a new worldwide database. Environ. Rev. 10(2): 91-109. doi:10.1139/a02-002
Scurlock, J.M.O., and R. J. Olson. 2013. NPP Multi-Biome: Grassland, Boreal Forest, and Tropical Forest Sites, 1939-1996, R1. Data set. Available on-line [http://daac.ornl.gov] from Oak Ridge National Laboratory Distributed Active Archive Center, Oak Ridge, Tennessee, USA. doi:10.3334/ORNLDAAC/653
Scurlock, J.M.O., K. Johnson, and R. J. Olson. 2002. Estimating net primary productivity from grassland biomass dynamics measurements. Global Change Biology 8(8): 736-753. DOI: 10.1046/j.1365-2486.2002.00512.x