Get Data
Summary:
This data set provides forest age map products at 1-km resolution for Canada and the United States (U.S.A.). These continental forest age maps were compiled from forest inventory data, historical fire data, optical satellite data, and the images from NASA’s Landsat Ecosystem Disturbance Adaptive Processing System (LEDAPS) project. These input data products have various sources and creation dates as described in the source paper by Pan et al. (2011). Canadian maps were produced with data available through 2004 and U.S.A. maps with data available through 2006. A supplementary map of the standard deviations for age estimates was developed for quantifying uncertainty.
Note that the Pan et al. (2011) paper is included as a companion file with this data set and was the source of descriptions in the data set documentation.
Forest age, implicitly reflecting the past disturbance legacy, is a simple and direct surrogate for the time since disturbance and may be used in various forest carbon analyses that concern the impact of disturbances. By combining geographic information about forest age with estimated carbon dynamics by forest type, it is possible to conduct a simple but powerful analysis of the net CO2 uptake by forests, and the potential for increasing (or decreasing) this rate as a result of direct human intervention in the disturbance/age status.
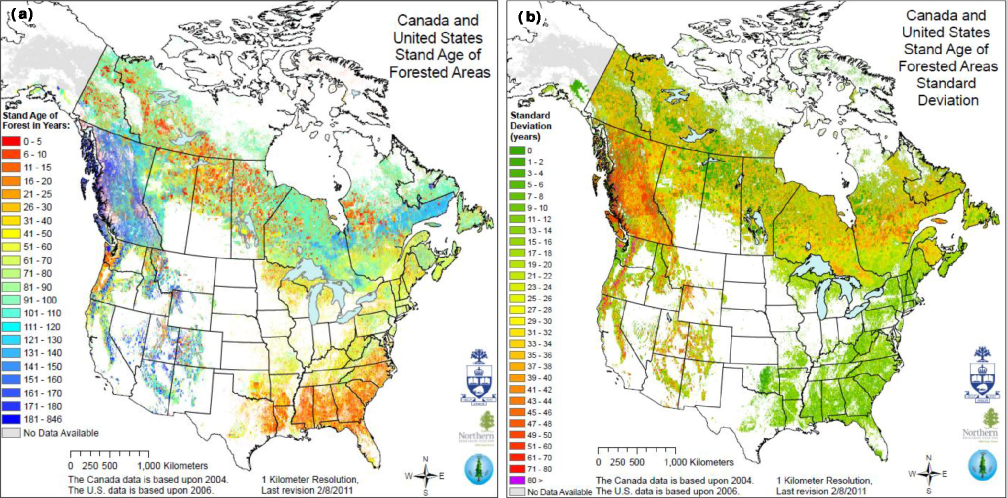
Figure 1. (a) Forest age distribution of the U.S. and Canada was developed by combining forest inventory data of the U.S. and Canada with several remote sensing based disturbance data sources. (b) The standard deviations of forest ages that characterize uncertainty in the age map (a).
Acknowledgements
Yude Pan and Richard Birdsey acknowledge support from NASA grants
(NNH09AM30I and NNH08AH971) and the Forest Service Global Change Research
Program. Jing Chen acknowledges support from the Canadian Carbon Program
funded by the Canadian Foundation of Climate and Atmospheric Sciences, as
well as funding support from US Department of Agriculture and Natural
Science and Engineering Council of Canada.
Data Access:
Get Data: NACP
Forest Age Maps at 1-km Resolution for Canada (2004) and the U.S.A. (2006)
ORNL DAAC Spatial Data Access Tool (SDAT) link: http://webmap.ornl.gov/wcsdown/dataset.jsp?ds_id=10022
Links to Companion Files and Supplemental Information:
Companion Files:
Pan, Y., Chen, J. M., Birdsey, R., McCullough, K., He, L., and Deng, F.: Age structure and disturbance legacy of North American forests, Biogeosciences Discuss., 7, 979-1020, doi:10.5194/bgd-7-979-2010, 2010. [ © Author(s) 2011. CC Attribution 3.0 License.] http://daac.ornl.gov/daacdata/nacp/NA_TreeAge/comp/Pan_et_al_bg-8-715-2011.pdf
Data Citation:
Cite this data set as follows:
Pan, Y., J. M. Chen, R. Birdsey, K. McCullough, L. He, and F. Deng. 2012. NACP Forest Age Maps at 1-km Resolution for Canada (2004) and the U.S.A. (2006). Data set. Available on-line [http://daac.ornl.gov] from ORNL DAAC, Oak Ridge, Tennessee, U.S.A. http://dx.doi.org/10.3334/ORNLDAAC/1096
Table of Contents:
- 1 Data Set Overview
- 2 Data Characteristics
- 3 Applications and Derivation
- 4 Quality Assessment
- 5 Acquisition Materials and Methods
- 6 Data Access
- 7 References
1. Data Set Overview:
Project: NACP
This data set provides forest age map products at 1-km resolution for Canada and the United States (U.S.A.). These continental forest age maps were compiled from forest inventory data, historical fire data, optical satellite data, and the images from NASA’s Landsat Ecosystem Disturbance Adaptive Processing System (LEDAPS) project. These input data products have various sources and creation dates as described in the source paper by Pan et al. (2011).
Related Data Set:
Masek, J.G., E.F. Vermote, N. Saleous, R. Wolfe, F.G. Hall, F. Huemmrich, F. Gao, J. Kutler, and T.K. Lim. 2012. LEDAPS Landsat Calibration, Reflectance, Atmospheric Correction Preprocessing Code. Model product. Available on-line [http://daac.ornl.gov] from Oak Ridge National Laboratory Distributed Active Archive Center, Oak Ridge, Tennessee, U.S.A. http://dx.doi.org/10.3334/ORNLDAAC/1080
2. Data Characteristics:
There are 14 GeoTIFF format files of forest age at 1-km
resolution provided in this data set for the areas as described below.
The regional subsets of the U.S. are provided for convenience.
| File Name | Description | Westernmost Longitude | Easternmost Longitude | Northernmost Latitude | Southernmost Latitude |
|---|---|---|---|---|---|
| ca04_usak06_1km.tif | Forest Age Distributionin Canada and the United States | 99.17216 | -39.86598 | 49.93034 | 7.71264 |
| ca04_usak06_std_1km.tif | Standard Deviation of Forest Age Distribution in Canada and the United States | 99.17216 | -39.86598 | 49.93034 | 7.71264 |
| can_age04_1km.tif | Forest Age Distributionin Canada | 179.25075 | -43.52704 | 58.60232 | 35.11826 |
| conus_age06_1km.tif | Forest Age Distributionin the Continental United States | -141.32966 | -66.25128 | 46.38741 | 19.40478 |
| ak_age06_1km.tif | Forest Age Distributionin Alaska | 163.32518 | -126.10616 | 67.008031 | 48.41541 |
| ne_age06_1km.tif | Forest Age Distributionin the Northeast United States | -83.258225 | -70.94195 | 46.9011 | 37.56116 |
| nl_age06_1km.tif | Forest Age Distributionin Northern Lakes of the United States | -104.0905 | -76.83428 | 48.45835 | 40.39267 |
| np_age06_1km.tif | Forest Age Distributionin Northern Plains of the United States | -117.03508 | -76.12189 | 47.90698 | 34.354064 |
| pnw_age06_1km.tif | Forest Age Distributionin the Pacific Northwest | -133.62684 | -108.95552 | 50.98399 | 39.264489 |
| psw_age06_1km.tif | Forest Age Distributionin the Pacific Southwest | -130.706525 | -108.72543 | 44.50312 | 29.97547 |
| rmn_age06_1km.tif | Forest Age Distributionin the Rocky Mountains North | -120.59213 | -102.46417 | 50.82987 | 40.56482 |
| rms_age06_1km.tif | Forest Age Distributionin the Rocky Mountains South | -125.60797 | -98.21527 | 46.407244 | 28.83057 |
| sc_age06_1km.tif | Forest Age Distributionin the South Central United States | -110.23429 | -81.92859 | 39.203472 | 24.52227 |
| se_age06_1km.tif | Forest Age Distributionin the South East United States | -88.97259 | -76.47803 | 39.18561 | 24.48137 |
Note that the spatial extents of some files are significantly larger than the spatial distribution of real data values.
Map_Projection:
- Projected Coordinate System: North American 1983 Albers
- Projection: Albers
- False_Easting: 0.000000
- False_Northing: 0.000000
- Central_Meridian: -96.000000
- Scale_Factor: 0.999600
- Latitude_of_Origin: 40.000000
- Linear_Unit: Meter
- Geographic Coordinate System: GCS_WGS_1984
- Prime Meridian: Greenwich
- Angular Unit: Degree
Site boundaries: (All latitude and longitude are given in decimal degrees)
| Site (Region) | Westernmost Longitude | Easternmost Longitude | Northernmost Latitude | Southernmost Latitude | Geodetic Datum |
|---|---|---|---|---|---|
| Canada and U.S.A. | 179.25075 | -39.86598 | 67.008031 | 7.71264 | North American Datum of 1983 |
Time period:
- The data set covers the period 1950/01/01 - 2006/12/31.
3. Data Application and Derivation:
The significance of the disturbance legacy from the past can be evaluated, as represented by current forest age structure in different regions of the U.S. and Canada, by analyzing the causes of disturbances from land management and nature over centuries and at various scales. Such information can be used with inventory data for analyzing carbon management opportunities. By combining geographic information about forest age with estimated C dynamics by forest type, it is possible to conduct a simple but powerful analysis of the net CO2 uptake by forests, and the potential for increasing (or decreasing) this rate as a result of direct human intervention in the disturbance/age status. Forest age data can be used in large-scale carbon modeling, both for land-based biogeochemistry models and atmosphere-based inversion models, in order to improve the spatial accuracy of carbon cycle simulations.
4. Quality Assessment:
Canada
Uncertainties and major error sources
Relatively low uncertainty; biases of FIA stand age samples; averaging ages of uneven-aged forests in developing age polygons; inconsistency of acquisition dates from LEDAPS data set for developing a Disturbance Index (DI) for the years 1990 and 2000; and errors from the algorithm dating by using FIA data to set the thresholds.
Issues of concern for users
(1) Inconsistent inventory data collected from different years and outdated; (2) poor data of unmanaged northern boreal forests and inaccuracy of forest ages older than 60 yr (beyond the earliest fire scar data can detect);
and (3) remote sensing based fire scar dating algorithm can’t separate disturbances of fires and insect outbreaks.
United States
Uncertainties and major error sources
Relatively low uncertainty; biases of FIA stand age samples; averaging ages of uneven-aged forests in developing age polygons; inconsistency of acquisition dates from LEDAPS dataset for developing a Disturbance Index (DI) for the years 1990 and 2000; and errors from the algorithm dating by using FIA data to set the thresholds.
Issues of Concern for Users
General concerns
Tree age data are not available everywhere in North America. Some regions are not very well covered by forest inventories, such as interior Alaska and the northern part of Canada. It is important to acknowledge the uncertainty and inaccuracy of the age map because of limitations of data sources and methodologies, particularly, inconsistency of age-related data between Canada and the U.S.
For instance, for the U.S., the disturbance information derived from remote sensing only covers 10 yr (1990-2000), so the impact of disturbances that occurred before (or after) then could be missed in the age map if the inventory data does not pick up all disturbance effects. This can be particularly true for disturbance prone regions in the western U.S. where wildfires occur at a high frequency.
In Canada, a big problem is for the massive area of northern boreal forests that have little ground-based inventory data to constrain the assignment of ages to pixels. Accordingly, the forest age is represented on the map by a single value in a pixel of 1-km resolution that more likely contains a mix of values. The map is most appropriate for large-scale studies and should be used very cautiously for geographic areas smaller than those described in this paper.
Map of standard deviation for forest age
The companion map of standard deviation for the age map should be considered for evaluating uncertainty in application of the age map for studying regional carbon, water and nutrient cycles. For the areas with high uncertainty in age estimates such as British Columbia and U.S. west coasts where a greater spatial heterogeneity of forest age cohorts occurs on the landscape, it is particularly critical to choose a proper scale for using the product and perhaps necessary for collecting local data for validation.
5. Data Acquisition Materials and Methods:
To generate the age map, investigators integrated remote sensing data with the age information from forest inventories, disturbance data sets, and land-use/land cover change data. Because Canada and the U.S. have different systems and approaches to collect and manage forest and land data, different approaches were used to produce spatial forest age information for these two countries. From Table 1 of Pan et al. (2011).
Canada Methods
Forest inventory data:
National Forest Inventory (CanFI), collected mostly in late 1980s by provincial and territorial agencies (Penner et al., 1997). The inventory data were gridded to 10 km resolution with areal fractions of age classes in each grid (Chen et al., 2003). The data are only for managed forests (55% of total forest) with exclusion of northern boreal forests. Source: www.nrcan-rncan.gc.ca
Remote Sensing data
SPOT-VEGETATION, 10-d cloud-free synthesis data of June-August in 1997, for detecting fire scars from 1973–1997. The same data of 1998–2003 are used for new fire scar detection for the period.
Supplementary data:
Canadian Large-Fire Data base (LFDB) covered 1959–1995, some areas back to 1945, with polygons (8880) of fire scars larger than 200 ha, including outlines of fires and attributes of date, year, fire numbers, and area burned.
Methods of processing data:
(1) Co-registered fire polygons (LFDB) and the
remote sensing data to develop relationships between the reflectance ratio
(SWIR/NIR) and the number of years since the last burn for 18 ecoregions.
These relationships were used to develop a remote sensing based fire dating
algorithm to map annual forest burned areas for 1973–2003, which include
fire scars not covered by LFDB in terms of sizes, regions and years;
(2) At 1 km resolution, the fire polygons of known dates and recently
detected annual burned maps were used to assign forest ages in the disturbed
areas (including both managed and unmanaged forests), assuming age equals
the number of years since the last burn;
(3) For managed and undisturbed forests since 1973, forest ages were
randomly assigned to 1 km pixels with ages of 26 yr and older based on the
fractions of age classes within related 10 km grid cells (because a younger
forest supposedly fell to the disturbed area);
(4) For unmanaged forests in the far north, undisturbed areas are filled
with the average age (75–120 yr) depending on the disturbance occurrence
interval in each ecoregion.
U.S.A. Methods
Forest inventory data:
National Forest Inventory Analysis (FIA), collected periodically (every 5–6 yr, currently annual), at 150,000 sample locations. There are over 100,000 data points for this study. FIA data include stand age with mostly one condition (even or average age), or 2–3 conditions of multiple ages (uneven-aged). Alaska has incomplete data. Source: www.fia.fs.fed.us
Remote Sensing data
NASA Landsat Ecosystem Disturbance Adaptive Procession System (LEDAPS) (Masek et al., 2008). Disturbed areas between 1990 and 2000, 500 m pixels with fractions of disturbed areas summarized from mosaics at 28.5 m resolution.
Supplementary data:
Monitoring Trend in Burn Severity (MTBS), with burning severity values (1–4) and fire perimeters. Four states in the western US were selected for this study, which include 1,405 fire events in 1987–2001.
Areas of annual regenerations between 1990 and 2000 were compiled from FIA data.
Methods of processing data:
(1) Developed age polygons based on FIA plot
stand ages and assigned ages to 1 km (or 250 m) grid cells;
(2) Used TM/ETM scenes from LEDAPS to develop reflectance ratios
(SWIR/NIR), i.e. disturbance index (DI), for 1990 and 2000. DIs were
normalized and the differences (NDDIs) were used for detecting disturbances
and making a disturbance map, which was validated using MTBS data;
(3) The FIA data of forest regeneration areas were forced to establish the
relationship with the disturbed areas in each county; and used to find a
threshold NDDI of for separating disturbances that occurred in 1991–1995 and
1996–2000;
(4) Converted the disturbance dating to an age map of young regeneration
forests for age groups of 0–5 and 6–10 yr;
(5) Young forest ages were superimposed on top of the Voronoi data to
replace values of grid cells in the FIA based age map.
FIA stand age plot data for 2006 were converted to a polygon layer. Stand age polygon data were converted to a raster format. Raster stand age data were cut to a 1 km version of 2003 forest type group map. LEDAPS 1990-2000 change analysis data were added to the stand age data for the CONUS.
CanFI data were used as a based layer for Canadian stand age. Remote sensing data was used to update the age data to Canada for 2004. Canadian LFDB data was used to delineate fire disturbance not in the age data. The Canada data for 2004 and the United States data for 2006 were combined into one data set.
6. Data Access:
This data is available through the Oak Ridge National Laboratory (ORNL) Distributed Active Archive Center (DAAC).
Data Archive Center:
Contact for Data Center Access Information:
E-mail: uso@daac.ornl.gov
Telephone: +1 (865) 241-3952
7. References:
Pan, Y., J. M. Chen, R. Birdsey, K. McCullough, L. He, and F. Deng. 2011. Age structure and disturbance legacy of North American forests. Biogeosciences, 8, 715-732. doi:10.5194/bg-8-715-2011