Get Data
Summary:
This data set contains meteorological, carbon cycle flux, phenology, and ancillary data measured at 47 eddy covariance flux tower sites across North America. The data were used by North American Carbon Program (NACP) Site-Level Synthesis as model driver data and for assessing how well 24 Terrestrial Biosphere Models simulated carbon processes across vegetation types and environmental conditions.
- The meteorology data include eight variables: air temperature (K), specific humidity (kg/kg), wind speed (m/s), precipitation (kg/m2/s), surface pressure (Pa), surface incident shortwave radiation (W/m2), surface incident longwave radiation (W/m2), and CO2 concentration (ppm). Gap-filled data were used by modeling teams as input model driver data.
- Measured fluxes of net ecosystem exchange (NEE) and derived gross primary productivity (GPP) and respiration (R) and respective calculated uncertainty estimates are provided for each tower site at the native time resolution of the observations (30 or 60-minute) as well as the diurnal, seasonal, and annual time scales. The data were gap-filled following a standard protocol. Components of uncertainty include uncertainties resulting from turbulence, gap-filling, flux partitioning, and u* threshold determination. Flux observations and uncertainty data were used to assess how well models simulated carbon processes.
- Remotely sensed NDVI, LAI, and fPAR phenology data were derived from the GIMMS version g NDVI data set for each flux tower site. Phenology data were used by some modeling teams as input model driver data.
- Ancillary data and information describe tower location and physical characteristics, disturbance history, and biological and ecological attributes of the vegetation, litter, and soil. These ancillary data were used by modeling teams as input model driver data.
The data files are in both ASCII text and NetCDF formats (ALMA standard).
The compilation of these data was facilitated by the NACP Modeling and Synthesis Thematic Data Center (MAST-DC). MAST-DC was a component of the NACP (www.nacarbon.org) designed to support NACP by providing data products and data management services needed for modeling and synthesis activities. The overall objective of MAST-DC was to provide data management support to NACP investigators and agencies performing modeling and synthesis activities.
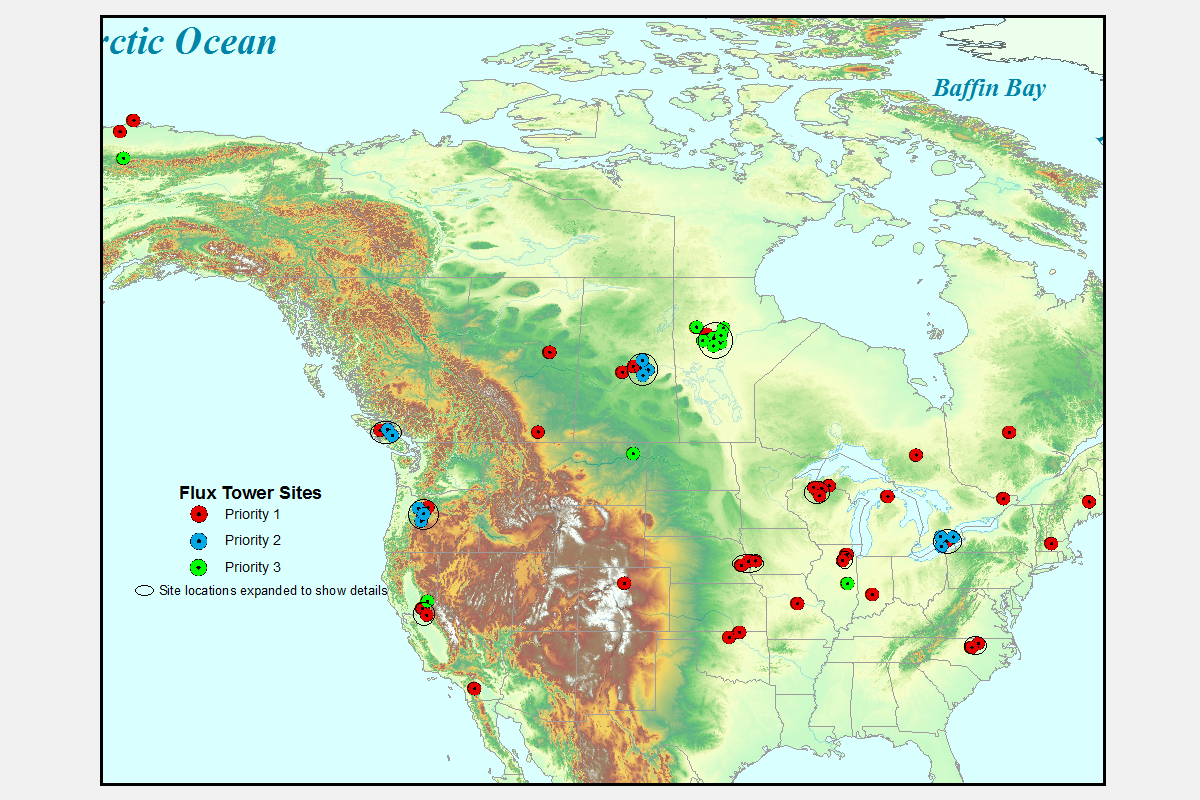
Figure 1. Flux Tower Site Locations: First-priority sites (36 sites) and Second-priority sites (11 chronosequence sites) were used for the model-data comparison. The third-priority sites (11 sites) were not used as part of the model-data comparison
Data and Documentation Access:
Get Data: http://daac.ornl.gov/cgi-bin/dsviewer.pl?ds_id=1178
Related Data Products:
NACP Site: Terrestrial Biosphere Model and Aggregated Flux Data
in Standard Format
NACP Site: Terrestrial Biosphere Model Output Data in Original Format
Supplemental Information:
The Protocol for the NACP Site-level Interim Synthesis Model-Data Comparison (Site Synthesis), Version 7, is included as a companion file. See site_synthesis_protocol_v7.pdf.
Much of the site-specific flux and ancillary data used in this synthesis activity were downloaded directly from the Ameriflux (http://ameriflux.ornl.gov) and Fluxnet Canada [Data now located at the ORNL DAAC (http://daac.ornl.gov/daacdata/fluxnet/fluxnet_canada/).] data sites.
This archived product represents data used in the NACP Site Synthesis. Updated flux tower data are available from FLUXNET.
Data Citation:
Cite this data set as follows:
Barr, A.G., D.M. Ricciuto, K. Schaefer, A. Richardson, D. Agarwal, P.E. Thornton, K. Davis, B. Jackson, R.B. Cook, D.Y. Hollinger, C. van Ingen, B. Amiro, A. Andrews, M.A. Arain, D. Baldocchi, T.A. Black, P. Bolstad, P. Curtis, A. Desai, D. Dragoni, L. Flanagan, L. Gu, G. Katul, B.E. Law, P. Lafleur, H. Margolis, R. Matamala, T. Meyers, H. McCaughey, R. Monson, J.W. Munger, W. Oechel, R. Oren, N. Roulet, M. Torn, and S. Verma. 2013. NACP Site: Tower Meteorology, Flux Observations with Uncertainty, and Ancillary Data. Data set. Available on-line [http://daac.ornl.gov] from Oak Ridge National Laboratory Distributed Active Archive Center, Oak Ridge, Tennessee, USA http://dx.doi.org/10.3334/ORNLDAAC/1178
Table of Contents:
- 1 Data Set Overview
- 2 Data Description
- 3 Applications and Derivation
- 4 Quality Assessment
- 5 Acquisition Materials and Methods
- 6 Data Access
- 7 References
1. Data Set Overview:
Project: North American Carbon Program (NACP)
The North American Carbon Program (NACP) (Denning et al., 2005; Wofsy and Harriss, 2002) is a multidisciplinary research program to obtain scientific understanding of North America's carbon sources and sinks and of changes in carbon stocks needed to meet societal concerns and to provide tools for decision makers. Successful execution of the NACP has required an unprecedented level of coordination among observational, experimental, and modeling efforts regarding terrestrial, oceanic, atmospheric, and human components. The project has relied upon a rich and diverse array of existing observational networks, monitoring sites, and experimental field studies in North America and its adjacent oceans. It is supported by a number of different federal agencies through a variety of intramural and extramural funding mechanisms and award instruments.
MAST-DC organized several synthesis activities to evaluate and inter-compare biosphere model outputs and observation data at local to continental scales for the time period of 2000 through 2005. The synthesis activities have included three component studies, each conducted on different spatial scales and producing numerous data products: (1) site-level synthesis that examined process-based model estimates and observations at over 47 AmeriFlux and Fluxnet-Canada tower sites across North America; (2) a regional, mid-continent intensive study centered in the agricultural regions of the United States and focused on comparing inventory-based estimates of net carbon exchange with those from atmospheric inversions; and (3) a regional and continental synthesis evaluating model estimates against each other and available inventory-based estimates across North America. A number of other NACP syntheses were conducted, including ones focusing on non-CO2 greenhouse gases, the impact of disturbance on carbon exchange, and coastal carbon dynamics. The Oak Ridge National Laboratory (ORNL) Distributed Active Archive Center (DAAC) is the archive for the NACP synthesis data products.
NACP Site Synthesis
This data set is part of the NACP Site Synthesis which is divided into three separate data components: model driver data and observations (this data set), the processed model output, and the original model output.
This data set contains meteorological, carbon cycle flux, phenology, and ancillary data measured at 47 eddy covariance flux tower sites across North America. The data were used by North American Carbon Program (NACP) Site-Level Synthesis as model driver data and for assessing how well 24 Terrestrial Biosphere Models simulated carbon processes across vegetation types and environmental conditions.
2. Data Description:
This data set contains four categories of data for each flux tower site: gap-filled meteorology data; phenology data; flux measurements with uncertainty; and ancillary site information. The data files are in both text and NetCDF formats (ALMA standard).
2.1. Spatial Coverage
Site: North America--Canada and USA
Site boundaries: (All latitude and longitude given in decimal degrees)
| Site (Region) | Westernmost Longitude | Easternmost Longitude | Northernmost Latitude | Southernmost Latitude |
|---|---|---|---|---|
| Canada and USA | -157.409 | -68.7403 | 71.3225 | 33.3739 |
2.2. Spatial Resolution
Meteorology, flux, and ancillary data represent point measurements (lat/lon) recorded at the flux tower location, or in the case of some meteorology data, within 50 km of the site. See Section 5. Data Acquisition Materials and Methods for exceptions. Phenology data represent average seasonal changes in LAI and fPAR for the area around each flux tower site.
2.3. Temporal Coverage
Meteorology, flux and ancillary data vary by flux tower site (Range: 1991-2007). Phenology represents the average seasonal cycle based on GIMMS version g NDVI, LAI, and fPAR time series data (1982-2003).
2.4. Temporal Resolution
| Data Set Category | Temporal Resolution |
|---|---|
| Gap-filled Meteorology Data | Half-hourly for most sites but hourly for several sites |
| Flux with Uncertainty | Half-hourly, daily, weekly, and monthly |
| Phenology | Monthly |
| Ancillary Data | Varies according to site |
2.5. Time Variable
Time in each gap-filled model driver data file (meteorology) is UTC where each timestamp marks the end of the observation period. The time resolution is either 30 minutes or 60 minutes depending on the averaging period used at the flux site. For phenology, time resolution is monthly.
2.6. Data File Information
Data for each tower site are provided in a compressed (*.zip) file (47 total files) with subfolders for the ancillary, forcing, and the observation and uncertainty data types.
| FILE AND FOLDER NAMES | ||
|---|---|---|
| Tower Site Files | Folders for Each Data Type** | Data Files For Each Site (where available) |
| *_observation.zip Example: CA-Ca1_observation.zip |
ancillary_data | *_site_characteristics.csv |
| forcing | *_met_forcing.nc | |
| *_met_forcing.txt | ||
| *_phenology.txt | ||
| uncertainty | *_flux_with_uncertainty_daily.nc | |
| *_flux_with_uncertainty_halfhourly.nc | ||
| *_flux_with_uncertainty_monthly.nc | ||
| *_flux_with_uncertainty_weekly.nc | ||
Note:
* represents the 6-character tower codes as described in Section 5 and found in the site lists.
** All sites have forcing data but not all sites have flux with uncertainty and ancillary data. See Tables 1 and 2 in Section 5.
Data File Descriptions
Ancillary Data
The site characteristics ancillary data files contain site physical characteristics, disturbance history, and biological and ecological attributes of the vegetation, litter, and soil. The files are largely self-documenting following the AmeriFlux Biological, Ancillary, Disturbance, and Metadata (BADM) standardized spreadsheet template. For additional information see: http://ameriflux.lbl.gov/data/badm-data-templates/.
Forcing Data
Meteorological Data: The gap-filled meteorology data for each site include eight variables: air temperature, specific humidity, wind speed, precipitation, surface pressure, surface incident shortwave radiation, surface incident longwave radiation, and CO2 concentration.
The files are in both ASCII format and NetCDF format (ALMA standard).
| Column Name | Units/format | Description |
|---|---|---|
| Year | YYYY | Year |
| DOY | NNN | DOY=1 is January 1 of respective year. Site Synthesis used leap years. DOY may have value of 366. |
| Hour | hr | Time in UTC, where each timestamp marks the end of the observation period. The time resolution is 30 minutes or 60 minutes. |
| T_air | K | Near surface air temperature in degrees Kelvin. |
| T_air_flag | NA | Flag indicates source of value and/or gap-filling steps as described in Section 5. 0=Original, 1=Diurnal_mean_fill, 2=Daymet, 3=Daymet_and_dailyNCDC, 4=dailyNCDC, 6=hourlyNCDC, 7=nearby_tower, 8=multiple_var |
| Q_air | kg/kg | Near surface specific humidity |
| Q_air_flag | NA | Same as Flag description above. |
| Wind_speed | m/s | Near surface module of the wind |
| Wind_speed_flag | NA | Same as Flag description above. |
| Precip | kg_H2O/m2/s | Rainfall rate |
| Precip_flag | NA | Same as Flag description above. |
| Pressure | pa | Surface pressure |
| Pressure_flag | NA | Same as Flag description above. |
| R_global_in | W/m2 | Surface incident shortwave radiation |
| R_global_in_flag | NA | Same as Flag description above. |
| R_longwave_in | W/m2 | Surface incident longwave radiation |
| R_longwave_in_flag | NA | Same as Flag description above. |
| CO2 | ppm | Near surface CO2 concentration (from flask site) |
Example data file:
|
Year,DOY,Hour,T_air,T_air_flag,Q_air,Q_air_flag,Wind_speed,Wind_speed_flag,
Precip,Precip_flag,Pressure,Pressure_flag,R_global_in,R_global_in_flag,
R_longwave_in,R_longwave_in_flag,CO2 1998,1,0,273.553694,0,0.003935,0,1.054,0,0,0,96750,0,0,0, 273.932985,1,367.657 1998,1,0.5,273.495094,0,0.003885,0,0.7003,0,0,0,96720,0,0,0, 273.698335,1,367.657 1998,1,1,273.419494,0,0.00387,0,0.8071,0,0,0,96700,0,0,0, 273.395836,1,367.657 … 2006,365,22.5,275.867494,0,0.004584,0,1.992,0,0,0,98500,0,0,0, 323.9,0,387.929 2006,365,23,275.837494,0,0.004568,0,2.041,0,0,0,98480,0,0,0, 323.5,0,387.929 2006,365,23.5,275.837494,1,0.004568,8,2.041,1,0,1,98480,1,0,1, 323.5,1,387.929 |
Phenology: Each file contains the average monthly seasonal cycle of Normalized Difference Vegetation Index (NDVI, dimensionless ratio), Leaf Area Index (LAI, m2/m2), and absorbed fraction of Photosynthetically Active Radiation (fPAR, fraction (0 to 1)) for a single site. The average seasonal cycle for the period 1982-2003 was determined for each site as described in Section 5.
Example data file:
| mon | dom | hr | doy | ndvi | fPAR | LAI |
| 1 | 15 | 1200 | 15.50000 | 0.5352272391 | 0.7773325443 | 1.2693578005 |
| 2 | 13 | 0 | 45.00000 | 0.6014999747 | 0.8269056678 | 1.6192519665 |
| 3 | 15 | 1200 | 74.50000 | 0.6411818266 | 0.8353364468 | 1.9022129774 |
| 4 | 14 | 0 | 105.00000 | 0.6965909600 | 0.8754597902 | 2.4796917439 |
| 5 | 15 | 1200 | 135.50000 | 0.7314091325 | 0.9091891646 | 3.0707702637 |
| 6 | 14 | 0 | 166.00000 | 0.7668636441 | 0.9499999881 | 4.1765103340 |
| 7 | 15 | 1200 | 196.50000 | 0.8003636003 | 0.9499999881 | 6.0501003265 |
| 8 | 15 | 1200 | 227.50000 | 0.8160454035 | 0.9499999881 | 6.0501003265 |
| 9 | 14 | 0 | 258.00000 | 0.7831817865 | 0.9499999881 | 5.6259374619 |
| 10 | 15 | 1200 | 288.50000 | 0.7056818604 | 0.9499999881 | 3.9054598808 |
| 11 | 14 | 0 | 319.00000 | 0.6018182039 | 0.9081605077 | 2.1150965691 |
| 12 | 15 | 1200 | 349.50000 | 0.5109545588 | 0.8088939786 | 1.3934049606 |
Measured Fluxes and Uncertainty Estimates:
The measured flux and uncertainty estimate data files are largely self-documenting in NetCDF format (ALMA standard).
Measured fluxes of NEE and derived GPP and respiration (R) and respective calculated uncertainty estimates are provided for each tower site at the native time resolution of the observations (30 or 60-minute), as well as the diurnal, seasonal, and annual time scales. The data were gap-filled following standard protocols described in Section 5. Components of uncertainty include uncertainties resulting from turbulence, gap-filling, flux partitioning, and u* threshold determination.
2.7. Companion File Information
| FILE OR FOLDER NAME | DESCRIPTION |
|---|---|
| site_synthesis_protocol_v7.pdf | Describes standardized site synthesis protocol |
| site_synthesis_documentation.pdf | Additional documentation for the three NACP Site Synthesis data sets: model driver data and observations (this data set), the processed model output, and the original model output. |
| Site_location_summary.csv | Summarizes all site location information required as input to all models: latitude, longitude, elevation, instrument height, biome, start and stop years, time zone shift to local standard time, and the flux time averaging period |
| Site_information_basic.csv | Basic information about each flux tower site (site code, name, PI, affiliation, email, address, references, priority, biome, etc.) |
| site_information_extended.pdf | Summarizes site code, name, PI, affiliation, email, address, references, priority, biome, etc. |
| Richardson_gap_filling_2009.pdf | Explanation of algorithmic uncertainties in GPP/RE partitioning and gap filling of NEE, at annual and half-hourly time scales |
| NACP_uncertainty_analysis.pdf | Methodology of estimating uncertainty |
| phenology_readme.txt | Describes how the phenology files were determined |
| Soil_texture_summary.csv | Soil texture summary (percent clay, sand, and silt along with comments) |
| NACP_Site_Tower_Met_and_Flux.pdf | This document in PDF (.pdf) format. |
| NAPC_sites_ungrouped_with-label.png | Map of flux tower priority 1, 2, and 3 sites. High-resolution verson of Figure 1. |
3. Data Application and Derivation:
This data product contributes to a multidisciplinary research program to obtain scientific understanding of North America's carbon sources and sinks and of changes in carbon stocks needed to meet societal concerns and to provide tools for decision makers. The data were generated as part of an NACP site-level synthesis to evaluate and inter-compare models and observation measurements across North America.
This site-level NACP data set provides meteorological, flux (with uncertainty), phenology, and ancillary environmental data for 47 eddy covariance flux tower sites. The data were used by NACP terrestrial biosphere modeling teams as input model driver data and for assessing how well these models simulate carbon processes across vegetation types and environmental conditions in North America.
4. Quality Assessment:
See Section 5.1 about gap-filling for each meteorological variable; notes in Section 5.3, Observations and Uncertainties; and Section 5.4 about basic QA/QC for ancillary data. Also see discussions on observation data strengths, weaknesses, and assumptions in Schaefer et al. (2012).
5. Data Acquisition Materials and Methods:
5.1 Participating Flux Tower Sites
Participating eddy flux covariance towers in the Site Synthesis were divided into a Priority 1 and a Priority 2 list. The Priority 1 sites represent a broad range of vegetation types and geographic regions to test each model’s performance under the fullest range of expected conditions across North America. No more than three Priority 1 sites were chosen to represent each of the major biome types in North America as defined by the IGBP biome classification.
The Priority 1 list represents the minimum number of tower sites required to evaluate model performance in North America. The Priority 2 list expands the site selection to include towers required for specialized analyses. Each participating site provided data as input to models and for comparison with model output, as described below.
An additional 11 flux tower sites that lacked ancillary and biological data were identified as third-priority sites (see Figure 1) but were not used as part of the model-data comparison.
For each site we used the unique FLUXNET code CC-XXX, where CC is a two letter country code and XXX is a three letter site code. The site codes are a unique identifier for each site and a convenient naming convention for all model input and output files.
Table 1. NACP Site-Level Synthesis - First-priority sites (36 sites). These sites have forcing and flux with uncertainty data but not all sites provided ancillary data.
| FLUXNET Site Code | Full Name | Period of Record1 | Flux w/ Uncertainty Data | Ancillary Data | State/Prov | Type2 |
|---|---|---|---|---|---|---|
| US-ARM | ARM – Southern Great Plains | 2000-2006 | yes | yes | OK | CRO |
| US-Ne1 | Mead – Irrigated maize | 2001-2006 | yes | yes | NE | CRO |
| US-Ne2 | Mead – Irrigated maize/soybean | 2001-2006 | yes | yes | NE | CRO |
| US-Ne3 | Mead – Rainfed maize/soybean | 2001-2006 | yes | yes | NE | CRO |
| US-IB1 | Fermi Lab – Maize/soybean rotation | 2005-2007 | yes | yes | IL | CRO |
| CA-Let | Lethbridge Grassland | 1997-2006 | yes | yes | AB | GRA |
| US-Var | Vaira Ranch | 2001-2007 | yes | yes | CA | GRA |
| US-Shd | Shidler | 1997-2001 | yes | yes | OK | GRA |
| US-IB2 | Fermi Lab – Prairie | 2004-2007 | yes | yes | IL | GRA |
| CA-Oas | BERMS – Old Aspen | 1997-2006 | yes | yes | SK | DBF |
| US-Ha1 | Harvard Forest – EMS Tower | 1991-2006 | yes | yes | MA | DBF |
| US-Dk2 | Duke Forest – Hardwood | 2003-2005 | yes | yes | NC | DBF |
| US-UMB | University of Michigan Biological Station (UMBS) | 1998-2006 | yes | yes | MI | DBF |
| US-MMS | Morgan Monroe State Forest | 1999-2006 | yes | yes | IN | DBF |
| US-WCr | Willow Creek | 1998-2006 | yes | no | WI | DBF |
| US-MOz | Missouri Ozark | 2004-2007 | yes | yes | MO | DBF |
| CA-Man | BOREAS – Northern Study Area, Old Black Spruce | 1994-2006 | yes | yes | MB | ENFB |
| CA-Obs | BERMS – Old Black Spruce | 2000-2006 | yes | yes | SK | ENFB |
| CA-Ojp | BERMS – Old Jack Pine | 2000-2006 | yes | yes | SK | ENFB |
| CA-Qfo | Quebec – Mature Black Spruce | 2004-2006 | yes | yes | QB | ENFB |
| CA-Ca1 | Campbell River – Mature Douglas-fir | 1998-2006 | yes | yes | BC | ENFT |
| US-Dk3 | Duke Forest – Loblolly Pine | 1998-2005 | yes | yes | NC | ENFT |
| US-Ho1 | Howland Forest – Main Tower | 1996-2004 | yes | yes | ME | ENFT |
| US-Me2 | Metolius – Intermediate-aged Ponderosa Pine | 2002-2007 | yes | yes | OR | ENFT |
| US-NR1 | Niwot Ridge | 1998-2007 | yes | yes | CO | ENFT |
| CA-TP4 | Turkey Point – Mature | 2002-2007 | yes | yes | ON | ENFT |
| US-PFa | Park Falls / WLEF | 1997-2005 | yes | yes | WI | MF |
| US-Syv | Sylvania Wilderness Area | 2001-2006 | yes | yes | MI | MF |
| CA-Gro | Groundhog River Station | 2004-2006 | yes | yes | ON | MF |
| US-Ton | Tonzi Ranch | 2001-2007 | yes | yes | CA | WSA |
| US-SO2 | Sky Oaks – Old | 1998-2006 | yes | yes | CA | SHR |
| US-Brw | Barrow | 1998-2006 | yes | yes | AK | TUN |
| US-Atq | Atqasuk | 1999-2006 | yes | yes | AK | TUN |
| CA-Mer | Eastern Peatland – Mer Bleue | 1999-2006 | yes | yes | ON | WET |
| US-Los | Lost Creek | 2000-2006 | yes | no | WI | WET |
| CA-WP1 | Western Peatland – LaBiche River | 2003-2007 | yes | no | AB | WET |
Table 2. NACP Site-Level Synthesis - Second-priority sites (11 chronosequence sites). All second-priority sites have forcing data but not all sites have flux with uncertainty data and none provided ancillary data.
| FLUXNET Site Code | Full Name | Period of Record1 | Flux w/ Uncertainty Data | Ancillary Data | State/Prov | Type2 |
|---|---|---|---|---|---|---|
| CA-SJ1 | BERMS – Jack Pine, 1994 harvest | 2002-2005 | yes | no | SK | ENFB |
| CA-SJ2 | BERMS – Jack Pine, 2002 harvest | 2003-2006 | yes | no | SK | ENFB |
| CA_SJ3 | BERMS – Jack Pine, 1975 harvest | 2004-2005 | yes | no | SK | ENFB |
| CA-Ca2 | Campbell River – Douglas-fir clearcut | 2001-2006 | yes | no | BC | ENFT |
| CA-Ca3 | Campbell River – Douglas-fir juvenile | 2002-2006 | yes | no | BC | ENFT |
| US-Me3 | Metolius – Ponderosa Pine, young #2 | 2004-2005 | yes | no | OR | ENFT |
| US-Me4 | Metolius – Ponderosa Pine, old-growth | 1996-2000 | no | no | OR | ENFT |
| US-Me5 | Metolius – Ponderosa Pine, Young #1 | 1999-2002 | yes | no | OR | ENFT |
| CA-TP1 | Turkey Point – Young | 2003-2007 | no | no | ON | ENFT |
| CA-TP2 | Turkey Point – Seedling | 2003-2007 | no | no | ON | ENFT |
| CA-TP3 | Turkey Point – Middle-aged | 2003-2007 | no | no | ON | ENFT |
Notes (apply to both tables):
1Start-end years in the gap-filled weather data. Partial years (from flux data record) have been extended to complete years of surface weather data to simplify model forcing. 2Types were assigned for convenience in this project, to identify combination of vegetation type and climate zone as an aid in site selection. These type names are not intended to match the IGBP classification assigned in other databases. Class: CRO = crop; GRA = grassland; ENFB = evergreen needleleaf forest – boreal; ENFT = evergreen needle leaf forest – temperate; DBF = deciduous broadleaf forest; MF = mixed (deciduous/evergreen) forest; WSA = woody savanna; SHR = shrubland; TUN = tundra; and WET = wetland. An additional 11 flux tower sites, which lack ancillary and biological data templates, were identified as third-priority sites (see Figure 1) but were not used as part of the model-data comparison.
5.2 Data from Flux Tower Sites
Most of the flux tower data needed for this synthesis activity were downloaded directly from the AmeriFlux (http://ameriflux.ornl.gov) and Fluxnet-Canada [Data now located at the ORNL DAAC (http://daac.ornl.gov/daacdata/fluxnet/fluxnet_canada/)] data sites.
5.2.1 Tower Meteorological Data
Meteorological data including air temperature, specific humidity, wind speed precipitation, surface pressure, surface incident shortwave radiation, and surface incident longwave radiation were acquired from AmeriFlux and Fluxnet-Canada data sites. CO2 concentration data were acquired from the closest continental flask sites. Globalview CO2 data (GLOBALVIEW-CO2, 2012) for these selected sites were then downloaded and integrated with the tower data. Meteorological data were gap-filled as described below.
5.2.2 Tower Flux Data
Measured fluxes and tower site characteristics were acquired from AmeriFlux and Fluxnet-Canada data sites at the native time resolution of the observations (flux measurement at 30 or 60-minute). Data included, as were available for a given site: Location -- latitude and longitude, Biome -- dominant vegetation, Soil Texture -- USDA soil texture, Latent Heat flux, Sensible Heat Flux, NEE Soil Temperature, Biomass, GPP, Respiration -- Total ecosystem respiration, Soil Respiration, and Active Layer -- active layer depth. Additional discussion of tower site data acquisition is included in the Site Synthesis Protocol companion file. See site_synthesis_protocol_v7.pdf. The data were gap-filled as needed following standard protocols described below.
5.2.3 Ancillary Data
The site characteristics ancillary data files, the cleaned Ancillary Data and Metadata (CADM) files, with site physical characteristics, disturbance history, and biological and ecological attributes of the vegetation, litter, and soil were acquired from AmeriFlux and Fluxnet-Canada data sites. Tower site location information (Tables 1 and 2), disturbance histories, and soil texture data were extracted and processed as described below.
5.3 Phenology Data
The NDVI values for each site were extracted from the pixel containing the tower from the 8 km global maps of GIMMSg NDVI from 1982-2003.
The monthly NDVI, LAI, and fPAR data were processed as described below.
5.4 Gap-Filled Model Meteorological Driver Data
The gap-filled meteorology data include eight variables: air temperature (K), specific humidity (kg/kg), wind speed (m/s), precipitation (kg/m2/s), surface pressure (Pa), surface incident shortwave radiation (W/m2), surface incident longwave radiation (W/m2), and CO2 concentration (ppm). The files are in both ASCII format and NetCDF format (ALMA standard). The time resolution of these files matches the averaging period used by the site PIs, which is half-hourly for most sites but hourly for several sites. Time in each file is UTC where each timestamp marks the end of the observation period. The time resolution is either 30 minutes or 60 minutes depending on the averaging period used at the flux site.
Please note that U.S. flux tower data are subject to the AmeriFlux fair-use data policy.
5.4.1 Filling Methodology
If meteorological data were missing for a flux tower and there was another flux tower on the list within 30 km and within 150-m elevation, data from the nearby site were used to fill gaps. Remaining gaps were filled using NOAA's National Climatic Data Center (NCDC) climate station data. NCDC climate stations within 50 km are available for most sites. About half of these NCDC stations had hourly measurements, generally from the US National Weather Service, Automated Surface Observing System (ASOS) sites. The rest were usually NOAA US Cooperative Observing Network sites reporting daily data. In addition, DAYMET Version 1 modeled fine-scale climate data are available for continental US sites at a daily time-step through the year 2003 (Thornton et al., 1997). Hourly data were used first when available. When both DAYMET and NCDC daily data were available, the data set with the better correlation was used. When station data were not available, a 10-day running mean diurnal cycle was used. Detailed descriptions for individual variables follow below.
5.4.2 Description of Meteorological Variables
- Temperature (Tair)
If hourly data from a nearby NCDC station were available, these data were used to perform the filling. Biases between the NCDC station and the tower were corrected by adding the difference in mean annual temperature.
If daily data were available but not hourly, DAYMET or NCDC maximum and minimum temperature data were used. If both options were available, data with the best linear correlation with available tower data were used. Biases were corrected by adding the difference in mean annual temperature between the tower and the climate data (separately for maximum and minimum temperature).
Daily data were converted to hourly (or half-hourly) using a sine wave assuming the following: High temperature occurs at 15 LST, low temperature occurs at 03 LST. Additionally, a 6-hr running mean filter was applied on filled data between 18 LST and 06 LST to prevent large discontinuities in temperature across day boundaries. If neither hourly nor daily climate data were available, data were filled with diurnal running mean method described above.
- Near surface specific humidity (Qair)
If hourly temperature and heterotrophic respiration data from a nearby NCDC station were available, these data were converted to Qair and used to fill. Potential biases between the tower and NCDC station were not corrected.
If hourly climate data were not available, data were filled with the diurnal mean method described above.
- Wind speed (Wind)
If hourly wind speed data from a nearby NCDC station were available, these data were used to fill gaps. Potential biases between the tower and NCDC station were not corrected.
If hourly climate data were not available, data were filled with the diurnal mean method described above.
- Precipitation (Rainf)
If hourly precipitation data from a nearby NCDC station were available, these data were used to fill gaps. Potential biases between the tower and NCDC station were not corrected.
If daily data were available and not hourly, DAYMET or NCDC precipitation data were used. If both options were available, data with the best linear correlation with available tower data were used. Potential biases between the tower and NCDC station were not corrected. Daily data were converted to hourly (or half-hourly) by dividing the daily sum by 24 (or 48) and evenly distributing rainfall throughout the day.
- Surface pressure (Psurf)
If hourly surface pressure data from a nearby NCDC station were available, these data were used to fill gaps. Potential biases between the tower and NCDC station were not corrected.
If hourly data were not available, data were filled using diurnal mean method described above.
If pressure was not measured at all (occurs for several sites), data were filled using hydrostatic balance given site elevation.
- Downwelling shortwave radiation (SWdown)
SWdown was converted from PAR if PAR measurements were deemed to be more reliable.
If hourly cloud cover data from a nearby NCDC station were available, the data were recorded in four categories: 0 (clear), 1 (scattered clouds), 2 (broken clouds) and 3 (overcast). The existing tower SWdown measurements were divided into those four categories. Diurnal mean averages were calculated for each day of the year for each cloud cover category. Gaps were then filled using this diurnal information combined with the NCDC cloud cover data.
If DAYMET was available but not hourly NCDC, DAYMET estimated radiation data were used. (DAYMET radiation is estimated from a simple model based on daily temperature range.) DAYMET daily radiation was downscaled to hourly (or half-hourly) values using a mean diurnal cycle.
If neither of the above was available, data were filled using the diurnal mean method described above.
- Downwelling longwave radiation (LWdown)
Emissivity was estimated using LWdown data observed at Bondville flux tower data based on temperature, humidity, and cloud cover from a nearby NCDC station. A lookup table of emissivity for a given temperature and cloud cover was created for use in gap-filling all sites.
If hourly cloud cover data from a nearby NCDC station were available, the data were recorded in four categories: 0 (clear), 1 (scattered clouds), 2 (broken clouds), and 3 (overcast). This information was used in combination with temperature and humidity measurements to look up an emissivity. The emissivity was then used to calculate LWdown with air temperature using the Stefan-Boltzmann Law. If hourly cloud cover was not available, another version of the lookup table was used that uses an average over sky conditions.
- Carbon dioxide concentration (CO2 air)
Because high-frequency CO2 measurements are often unreliable, tower measurements were not used to produce CO2 concentrations. Instead, an algorithm selected the closest continental flask site out of the following list: Argyle, ME; Barrow, AK; Estevan Point, BC; Park Falls, WI; La Jolla, CA; Niwot Ridge, CO; Moody, TX; and Grifton, NC. Globalview CO2 data from these sites were then used. No temporal or spatial interpolation was performed. Flask measurements are generally every 14 days. Therefore, these CO2 measurements will not capture the diurnal cycle and will miss some synoptic variability, but will characterize the seasonal cycle well.
5.5 Flux Observations and Uncertainties
Quantified uncertainty and bias of the flux measurements are essential to the core objectives of the Site Synthesis. The basic strategy was to use published estimates of the various sources of uncertainty. If published estimates were lacking or incomplete for a particular source of uncertainty, the investigators coordinated with analysis teams in AmeriFlux, Fluxnet-Canada, and FLUXNET to develop estimates suitable for use in the Site Synthesis. The various estimates of uncertainty were combined to obtain total uncertainty for the observed NEE, and the derived GPP and R. Total flux uncertainty was estimated at the native time resolution of the observations (30 or 60-minute), as well as the diurnal, seasonal, and annual time scale. Components of uncertainty include uncertainties resulting from turbulence, gap-filling, flux partitioning and u* threshold determination. NEE was gap-filled using the standard approach of Fluxnet Canada. GPP and ecosystem respiration estimates with uncertainties were created using a standard flux partitioning. Random and u* threshold uncertainty data originally provided by Alan Barr were converted to NetCDF format and updated to include gap-filling, partitioning, and total uncertainty by Kevin Schaefer. For the methodology of estimating uncertainty, please refer to Barr et al. (2009) and Schaefer et al. (2012).
Notes:
- Partitioning Uncertainty refers to the uncertainty in GPP and R estimated from observed NEE. Gap-filling Uncertainty refers to the structural uncertainty associated with the various techniques used to fill in missing values of observed NEE.
- The uncertainty and gap-filled fluxes are generally expected to be stable for: CAGro, CALet, CAMer, CANS1, CAOas CAObs, CAOjp, CASJ1,2,3, CATP4, CAWP1, USARM (except 2006 and 2007), USHa1, USHo1, USIB1, USIB2, USLos, USMMS, USNR1, USNe1,2,3, USPFa, USSO2, USShd, USSyv.
- Sites where there are unresolved questions about algorithm performance: CACa1, 2, 3 (significant low bias in NEP), USMe2, 3, 5, USTon, USVar, USUMB (may be OK), USWCr (may be OK). Sites where the product is most questionable: USAtq, USBrw, USDk2, USDk3.
- There is more concern about the absolute value of the NEE fluxes and the partitioning of NEE into GPP and Re than about the uncertainty analysis or the characterization of inter-annual variability.
5.6 Phenology
Remotely sensed standard monthly phenology data for each site were derived from GIMMS version g NDVI data set for 1982-2003. Plant phenology is defined as periodic or seasonal changes in Leaf Area Index (LAI) and absorbed fraction of Photosynthetically Active Radiation (fPAR). Each file represents an average monthly seasonal cycle for one site. The phenology_readme.txt file in the companion file sub-directory describes how the phenology files were created.
5.7 Ancillary Data
5.7.1 Cleaned Ancillary Data and Metadata
Investigators at each site provided ancillary information (in addition to the core micrometeorological measurements) describing site physical characteristics, disturbance history, and biological and ecological attributes of the vegetation, litter, and soil (http://www.fluxdata.org/DataInfo/AmeriFlux%20Docs/BADMtypes.pdf). This information was recorded for each site using a standard data template (MS Excel spreadsheet) developed within the AmeriFlux network. The initial filled-in template provided by a participating site is referred to as the Biological, Ancillary, and Disturbance Metadata (BADM) record. These BADM records are archived at CDIAC and were forwarded to the Berkeley Water Center for additional processing.
For the Site Synthesis, the BADM files were reformatted into a long and skinny format specifically for the modeling teams. In addition, variables and units were standardized and a light Quality Control check was performed. These new files are derived from BADM and are called CADM (Cleaned Ancillary Data and Metadata).
5.7.2 Site Location Table
The site location table summarizes all site location information required as input to all models: latitude, longitude, elevation, instrument height, biome, start and stop years, time zone shift to local standard time, and the flux time averaging period. The site location table (Site_location_summary.csv) can be found in the companion file sub-directory.
5.7.3 Soil Texture Summary Table
To save time for the modeling teams, soil data from the individual CADM files were extracted and constructed into a soil texture summary table. Missing values were filled from the IGBP soil texture map. Sites with multiple observations as a function of depth were averaged to a single value. The soil texture summary table (Soil_texture_summary.csv) can be found in the companion file sub-directory.
6. Data Access:
These data are available through the Oak Ridge National Laboratory (ORNL) Distributed Active Archive Center (DAAC).
Data Archive Center:
Contact for Data Center Access Information:
E-mail: uso@daac.ornl.gov
Telephone: +1 (865) 241-3952
7. References:
Barr, A.G., D. Hollinger, and A. D. Richardson. 2009. CO2 flux measurement uncertainty estimates for NACP. Eos Transactions SGU, 90(52), Fall Meeting, Abstract B54A-04.
Denning, A.S., et al. 2005. Science implementation strategy for the North American Carbon Program: A Report of the NACP Implementation Strategy Group of the U.S. Carbon Cycle Interagency Working Group. U.S. Carbon Cycle Science Program, Washington, DC. 68 pp.
Schaefer, K., C. Schwalm, C. Williams, M.A. Arain, A. Barr, J. Chen, K.J. Davis, D. Dimitrov, T.W. Hilton, D.W. Hollinger, E. Humphreys, B. Poulter, B.M. Raczka, A.D. Richardson, A. Sahoo, P.E. Thornton, R. Vargas, H. Verbeeck, R. Anderson, I. Baker, T.A. Black, P. Bolstad, Jiquan Chen, P. Curtis, A.R. Desai, M. Dietze, D. Dragoni, C. Gough, R.F. Grant, L. Gu, A. Jain, C. Kucharik, B. Law, S. Liu, E. Lokipitiya, H.A. Margolis, R. Matamala, J.H. McCaughey, R. Monson, J.W. Munger, W. Oechel, C. Peng, D.T. Price, D. Ricciuto, W.J. Riley, N. Roulet, H. Tian, C. Tonitto, M. Torn, E. Weng, X. Zhou. 2012. A model-data comparison of gross primary productivity: Results from the North American Carbon Program site synthesis. Journal of Geophysical Research: Biogeosciences 117: G03010. doi:10.1029/2012JG001960
Wofsy, S.C., and R.C. Harriss. 2002. The North American Carbon Program (NACP). Report of the NACP Committee of the U.S. Interagency Carbon Cycle Science Program. U.S. Global Change Research Program, Washington, DC. 56 pp.
Additional Sources of Information:
Dietze, M.C., R. Vargas, A.D. Richardson, P.C. Stoy, A.G. Barr, R.S. Anderson, M.A. Arain, I.T. Baker, T.A. Black, J.M. Chen, P. Ciais, L.B. Flanagan, C.M. Gough, R.F. Grant, D. Hollinger, C. Izaurralde, C.J. Kucharik, P. Lafleur, S. Liu, E. Lokupitiya, Y. Luo, J.W. Munger, C. Peng, B. Poulter, D.T. Price, D.M. Ricciuto, W.J. Riley, A.K. Sahoo, K. Schaefer, A.E. Suyker, H. Tian, C. Tonitto, H. Verbeeck, S.B. Verma, W. Wang, and E. Weng. 2012. Characterizing the performance of ecosystem models across time scales: A spectral analysis of the North American Carbon Program site-level synthesis. Journal of Geophysical Research: Biogeosciences 116: G04029. doi:10.1029/2011JG001661
Keenan, T.F., I. Baker, A. Barr, P. Ciais, K. Davis, M. Dietze, D. Dragoni, C.M. Gough, R. Grant, D. Hollinger, K. Hufkens, B. Poulter, H. McCaughey, B. Rackza, Y. Ryu, K. Schaefer, H. Tian, H. Verbeeck, M. Zhao, and A.D. Richardson. 2012. Terrestrial biosphere model performance for inter-annual variability of land-atmosphere CO2 exchange. Global Change Biology 18(6): 1971–1987. doi:10.1111/j.1365-2486.2012.02678.x
Li H., M. Huang, M.S. Wigmosta, Y. Ke, A.M. Coleman, L.Y.R. Leung, A. Wang, and D.M. Ricciuto. 2011. Evaluating runoff simulations from the Community Land Model 4.0 using observations from flux towers and a mountainous watershed. Journal of Geophysical Research: Atmospheres 116: D24120. doi:10.1029/2011JD016276
Raczka, Brett Michael, Kenneth J. Davis, Deborah Nicole Huntzinger, Ronald Neilson, Benjamin Poulter, Andrew Richardson, Jingfeng Xiao, Ian Baker, Philippe Ciais, Trevor F. Keenan, Beverly Law, Wilfred M. Post, Daniel Ricciuto, Kevin Schaefer, Hanqin Tian, Enrico Tomelleri, Hans Verbeeck, and Nicolas Viovy. In press. Evaluation of continental carbon cycle simulations with North American flux tower observations. Ecological Monographs. DOI:10.1890/12-0893.1
Richardson, A.D., R.S. Anderson, M.A. Arain, A.G. Barr, G. Bohrer, G. Chen, J.M. Chen, P. Ciais, K.J. Davis, A.R. Desai, M.C. Dietze, D. Dragoni, S.R. Garrity, C.M. Gough, R. Grant, D.Y. Hollinger, H.A. Margolis, H. McCaughey, M. Migliavacca, R.K. Monson, J.W. Munger, B. Poulter, B.M. Raczka, D.M. Ricciuto, A.K. Sahoo, K. Schaefer, H. Tian, R. Vargas, H. Verbeeck, J. Xiao, and Y. Xue. 2012. Terrestrial biosphere models need better representation of vegetation phenology: Results from the North American Carbon Program site synthesis. Global Change Biology 18(2): 566-584. doi:10.1111/j.1365-2486.2011.02562.x
Schwalm, C., C.A. Williams, K. Schaefer, R. Anderson, M.A. Arain, I. Baker, A. Barr, T.A. Black, G. Chen, J.M. Chen, P. Ciais, K.J. Davis, A. Desai, M. Dietze, D. Dragoni, M.L. Fischer, L.B. Flanagan, R. Grant, L. Gu, D. Hollinger, R.C. Izaurralde, C. Kucharik, P. Lafleur, B.E. Law, L. Li, Z. Li, S. Liu, E. Lokupitiya, Y. Luo, S. Ma, H. Margolis, R. Matamala, H. McCaughey, R.K. Monson, W.C. Oechel, C. Peng, B. Poulter, D.T. Price, D.M. Riciutto, W. Riley, A. Kumar Sahoo, M. Sprintsin, J. Sun, H. Tian, C. Tonitto, H. Verbeeck, and S.B. Verma. 2010. A model-data intercomparison of CO2 exchange across North America: Results from the North American Carbon Program site synthesis. Journal of Geophysical Research: Biogeosciences 115: G00H05. doi:10.1029/2009jg001229
Stoy, P.C., M. Dietze, A.D. Richardson, R. Vargas, A.G. Barr, R.S. Anderson, M. A. Arain, I.T. Baker, T.A. Black, J.M. Chen, R.B. Cook, L.B. Flanagan, C. M. Gough, R.F. Grant, D.Y. Hollinger, C. Izaurralde, C.J. Kucharik, P. Lafleur, S. Liu, E. Lokupitiya, Y. Luo, J. W. Munger, C. Peng, B. Poulter, D.T Price, D.M. Ricciuto, W.J. Riley, A. K. Sahoo, K. Schaefer, C.R. Schwalm, H. Tian, H. Verbeeck, E. Weng. in review, 2013. Evaluating the agreement between measurements and models of net ecosystem exchange at different times and time scales using wavelet coherence: An example using data from the North American Carbon Program Site-Level Interim Synthesis. Biogeosciences.
Sulman, B.N., A.R. Desai, N.M. Schroeder, D. Ricciuto, A. Barr, A.D. Richardson, L.B. Flanagan, P.M. Lafleur, H. Tian, G. Chen, R.F. Grant, B. Poulter, H. Verbeeck, P. Ciais, B. Ringeval, I.T. Baker, K. Schaefer, Y. Luo, and E. Weng. 2012. Impact of hydrological variations on modeling of peatland CO2 fluxes: Results from the North American Carbon Program site synthesis. Journal of Geophysical Research: Biogeosciences 117: G01031. doi:10.1029/2011JG001862
Thornton PE, Running SW, White MA. 1997. Generating surfaces of daily meteorological variables over large regions of complex terrain. Journal of Hydrology 190: 214 - 251. http://dx.doi.org/10.1016/S0022-1694(96)03128-9