Documentation Revision Date: 2021-08-13
Dataset Version: 1
Summary
Emission rates represent (total daily reservoir emissions) / (total area of grid cell). Each grid cell was classified as a single eco-climate domain: boreal, temperate, or subtropical-tropical, based on soil temperatures. The emission of CH4 from reservoirs estimated in this dataset is from the two main pathways of diffusion and ebullition.
This dataset includes 2 data files in netCDF (*.nc) format.
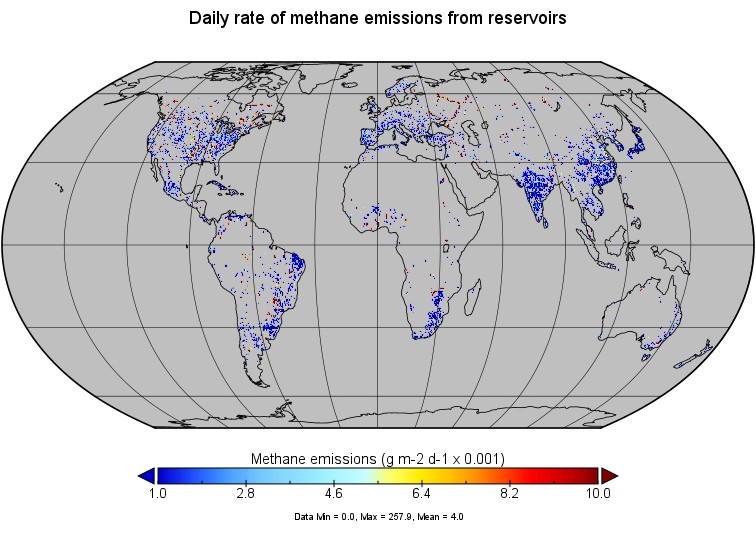
Figure 1. Estimated rate of methane emissions from inland reservoirs for July 15. Spatial resolution is 0.25 degrees. Source: Data file reservoir_methane_emissions.nc
Citation
Johnson, M.S. 2021. Global-Gridded Daily Methane Emissions from Inland Dam-Reservoir Systems. ORNL DAAC, Oak Ridge, Tennessee, USA. https://doi.org/10.3334/ORNLDAAC/1918
Table of Contents
- Dataset Overview
- Data Characteristics
- Application and Derivation
- Quality Assessment
- Data Acquisition, Materials, and Methods
- Data Access
- References
Dataset Overview
This dataset includes global maps of methane (CH4) emissions from inland dam-reservoir systems at 0.25-degree spatial resolution. Daily emission rates (as grams of CH4 per day per total area of grid cell) were estimated for boreal, temperate, and subtropical-tropical eco-climatic domains and total emissions. The annual duration of the emission season is based on freeze-thaw cycles of these water bodies as applicable. In addition, the dataset includes the total fractional area of reservoirs in each grid cell. These estimates will promote understanding of the current and future role of reservoirs in the global CH4 budget and guide efforts to mitigate reservoir-related CH4 emissions (Johnson et al. 2021).
Emission rates represent (total daily reservoir emissions) / (total area of grid cell). Each grid cell was classified as a single eco-climate domain: boreal, temperate, or subtropical-tropical, based on soil temperatures. The emission of CH4 from reservoirs estimated in this dataset is from the two main pathways of diffusion and ebullition. These emission estimates are climatological; one daily value for each day of year (n=365) is provided for each grid cell. Modeled estimates were based on daily mean inputs, averaged over 2002 to 2015.
Related publication
Johnson, M.S., E. Matthews, D. Bastviken, B. Deemer, J. Du, and V. Genovese. 2021. Spatiotemporal methane emission from global reservoirs. In revision at Journal of Geophysical Research: Biogeosciences.
Related Datasets
Bloom, A.A., K. Bowman, M. Lee, A.J. Turner, R. Schroeder, J.R. Worden, R.J. Weidner, K.C. McDonald, and D.J. Jacob. 2017. CMS: Global 0.5-deg Wetland Methane Emissions and Uncertainty (WetCHARTs v1.0). ORNL DAAC, Oak Ridge, Tennessee, USA. https://doi.org/10.3334/ORNLDAAC/1502.
Engram, M.J., K.W. Anthony, and F.J. Meyer. 2020. ABoVE: SAR-based Methane Ebullition Flux from Lakes, Five Regions, Alaska, 2007-2010. ORNL DAAC, Oak Ridge, Tennessee, USA. https://doi.org/10.3334/ORNLDAAC/1790.
Acknowledgments
This project received financial support from NASA’s Interdisciplinary Research in Earth Science (grant NNH16ZDA001N-IDS) and Terrestrial Ecology and Tropospheric Composition programs.
Data Characteristics
Spatial Coverage: Global
Spatial Resolution: 0.25 degrees
Temporal Coverage: Climatological
Temporal Resolution: Daily
Study Area: All latitudes and longitudes given in decimal degrees
| Site | Westernmost Longitude | Easternmost Longitude | Northernmost Latitude | Southernmost Latitude |
|---|---|---|---|---|
| Global | -180 | 180 | 90 | -90 |
Data File Information
This dataset includes 2 data files in netCDF (*.nc)files. For both files, the spatial resolution is 0.25 x 0.25-degree grid cells in geographic coordinates (longitude, latitude). Methane emission rates are in units of g CH4 per day per total area of the grid cell.
Table 1. File names and variables with descriptions.
| Filename | Variable | Units | Description |
|---|---|---|---|
| reservoir_area.nc | total_fraction | 1 | Area fraction of reservoirs in grid cell |
| total_area | m2 | Total area of reservoirs in grid cell | |
| boreal_area | m2 | Total area of reservoirs in grid cell in boreal eco-climatic zones | |
| temperate_area | m2 | Total area of reservoirs in grid cell in temperate eco-climatic zones | |
| tropical_subtropical_area | m2 | Total area of reservoirs in grid cell in tropical and subtropical eco-climatic zones | |
| reservoir_methane_emissions.nc | emission_season | d | Duration of annual emission season in days |
| total_emission_rate | g m-2 d-1 | Daily rate of methane emissions from reservoirs in grid cell | |
| boreal_emission_rate | g m-2 d-1 | Daily rate of methane emissions from reservoirs in grid cell in boreal eco-climatic domain | |
| temperate_emission_rate | g m-2 d-1 | Daily rate of methane emissions from reservoirs in grid cell in temperate eco-climatic domain | |
| tropical_subtropical_emission_rate | g m-2 d-1 | Daily rate of methane emissions from reservoirs in grid cell in tropical and subtropical eco-climatic domain |
Application and Derivation
Inland aquatic systems, such as reservoirs, contribute substantially to global methane (CH4) emissions; yet are among the most uncertain components of the total CH4 budget. Reservoirs have received recent attention as they may generate high CH4 fluxes. Improved quantification of these CH4 fluxes, particularly their spatiotemporal distribution, is key to realistically incorporating them in CH4 modeling and budget studies.
This dataset is a new global, gridded (0.25-degrees × 0.25-degrees) study of reservoir CH4 emissions, accounting for new knowledge regarding reservoir areal extent and distribution, and spatiotemporal emission patterns influenced by diurnal variability, temperature-dependent seasonality, satellite-derived freeze-thaw dynamics, and eco-climatic zone.
The results of this new dataset comprise daily CH4 emissions throughout the full annual cycle and show that reservoirs cover 297 × 103 km2 globally and emit 10.1 Tg CH4 yr-1 (1σ uncertainty range of 7.2 to 12.9 Tg CH4 yr-1) from diffusive (1.2 Tg CH4 yr-1) and ebullitive (8.9 Tg CH4 yr-1) emission pathways. This analysis of reservoir CH4 emission addresses multiple gaps and uncertainties in previous studies and represents an important contribution to studies of the global CH4 budget. The new datasets and methodologies from this study provide a framework to better understand and model the current and future role of reservoirs in the global CH4 budget and to guide efforts to mitigate reservoir-related CH4 emissions.
Quality Assessment
Uncertainty was estimated by incorporating coefficient of variation in time- and temperature-corrected measurements of diffusive and ebullitive emissions. At a global scale, the 1 σ uncertainty range is 7.2 to 12.9 Tg CH4 yr-1 (Johnson et al., 2021).
Data Acquisition, Materials, and Methods
The area and fractional area coverage of inland reservoirs were compiled from publicly available datasets including HydroLAKES (Messager et al., 2016) using the GRanD v1.1 database (Lehner et al., 2011) and Climate Change Initiative Inland-Water (CCI-IW) remote-sensing data using GOOD2 v1 (Mulligan et al., 2009) reservoir location data set.
Spatiotemporal rates of methane emissions were derived from flux measurements at 198 reservoir sites, mostly from Deemer et al. (2016). Only measurements that recorded the time of day, day of year, and indicating diffusive and/or ebullitive fluxes were included in the analysis. In general, flux rates are positively correlated with air and water temperature. Therefore, a scaling factor was derived for each reservoir site based on its seasonal temperature cycle and freeze-thaw cycles for reservoirs in colder climates. Long-term mean air temperature was obtained from the MERRA-2 database (Gelaro et al., 2017). The seasonal climate information was incorporated as monthly averages, and emission rates were estimated as daily rates. Mean 24-hour emission rates were calculated for all flux measurements used in the study.
These emission estimates are climatological; one daily value for each day of year (n=365) is provided for each grid cell. Modeled estimates were based on daily mean inputs, averaged over 2002 to 2015 (Johnson et al, 2021).
The sites were classified by eco-climate domain: boreal, temperate, or subtropical-tropical, based on mean annual soil temperatures from MERRA-2. The mean rates for each domain were applied to all reservoirs in the respective domains with adjustments for site-specific variation in seasonal temperatures and lake-ice phenology. Each grid cell was defined as having a single eco-climate domain.
The spatial distribution of reservoirs and regional rates of methane emissions were combined to produce a global database of daily methane emissions from inland dam-reservoir systems. Emission rates in g CH4 per m2 are reported in 0.25 x 0.25-degree grid cells, by day of year. Each rate represents total emissions from the grid cell [total g CH4 d-1 / (total area of grid cell)].
Details of this analysis are reported in Johnson et al. (2021).
Data Access
These data are available through the Oak Ridge National Laboratory (ORNL) Distributed Active Archive Center (DAAC).
Global-Gridded Daily Methane Emissions from Inland Dam-Reservoir Systems
Contact for Data Center Access Information:
- E-mail: uso@daac.ornl.gov
- Telephone: +1 (865) 241-3952
References
Deemer, B.R., J.A. Harrison, S. Li, J.J. Beaulieu, T. DelSontro, N. Barros, J.F. Bezerra-Neto, S.M. Powers, M.A. dos Santos, and J.A. Vonk. 2016. Greenhouse gas emissions from reservoir water surfaces: a new global synthesis. BioScience 66:949-964. https://doi.org/10.1093/biosci/biw117
Gelaro, R., W. McCarty, M.J. Suárez, R. Todling, A. Molod, L. Takacs, C.A. Randles, A. Darmenov, M.G. Bosilovich, R. Reichle, K. Wargan, L. Coy, R. Cullather, C. Draper, S. Akella, V. Buchard, A. Conaty, A.M. da Silva, W. Gu, G. Kim, R. Koster, R. Lucchesi, D. Merkova, J.E. Nielsen, G. Partyka, S. Pawson, W. Putman, M. Rienecker, S.D. Schubert, M. Sienkiewicz and B. Zhao. 2017. The modern-era retrospective analysis for research and applications, version 2 (MERRA-2). Journal of Climate 30:5419-5454. https://doi.org/10.1175/JCLI-D-16-0758.1
ICOLD. 2006. World Register of Dams (1988-2006). International Commission on Large Dams (ICOLD); Paris. https://www.icold-cigb.org
Johnson, M.S., E. Matthews, D. Bastviken, B. Deemer, J. Du, and V. Genovese. 2021. Spatiotemporal methane emission from global reservoirs. In revision at Journal of Geophysical Research: Biogeosciences.
Lehner, B., and P. Doell. 2004. Development and validation of a global database of lakes, reservoirs and wetlands. Journal of Hydrology 296:1-22. https://doi.org/10.1016/j.jhydrol.2004.03.028
Lehner, B., C.R. Liermann, C. Revenga, C. Vörösmarty, B. Fekete, P. Crouzet, P. Döll, M. Endejan, K. Frenken, J. Magome, C. Nilsson, J.C. Robertson, R. Rödel, N. Sindorf, and D. Wisser. 2011. High-resolution mapping of the world's reservoirs and dams for sustainable river-flow management. Frontiers in Ecology and the Environment 9:494-502. https://doi.org/10.1890/100125
Messager, M.L., B. Lehner, G. Grill, I. Nedeva, and O. Schmitt. 2016. Estimating the volume and age of water stored in global lakes using a geo-statistical approach. Nature Communications 7:13603. https://doi.org/10.1038/ncomms13603
Mulligan, M., L. Saenz-Cruz, A. van Soesbergen, V.T. Smith, and L. Zurita. 2009. Global dams database and geowiki, version 1. http://geodata.policysupport.org/dams