Get Data
Revision Date: April 17, 2014
Summary:
This data set provides field measurements of diameter, tree height, and crown dimensions for 1,513 trees in 30 plots at the La Selva Biological Station in Costa Rica. Fourteen of these plots were in undisturbed primary forest, six were in primary forest which had been selectively logged, seven were secondary forests, and three were abandoned pastures reverting to forest.
The diameter and height data were used to calculate aboveground biomass for each of the 30 plots. The crown measurements were used to estimate a vertical profile for each plot, showing the vegetation volume in 1-meter increments from the ground to the top of the canopy.
There are three comma-delimited data files and two shapefiles with this data set. The files contain the measurements and calculated biomass for the individual stems as well as the summary data at the plot level.
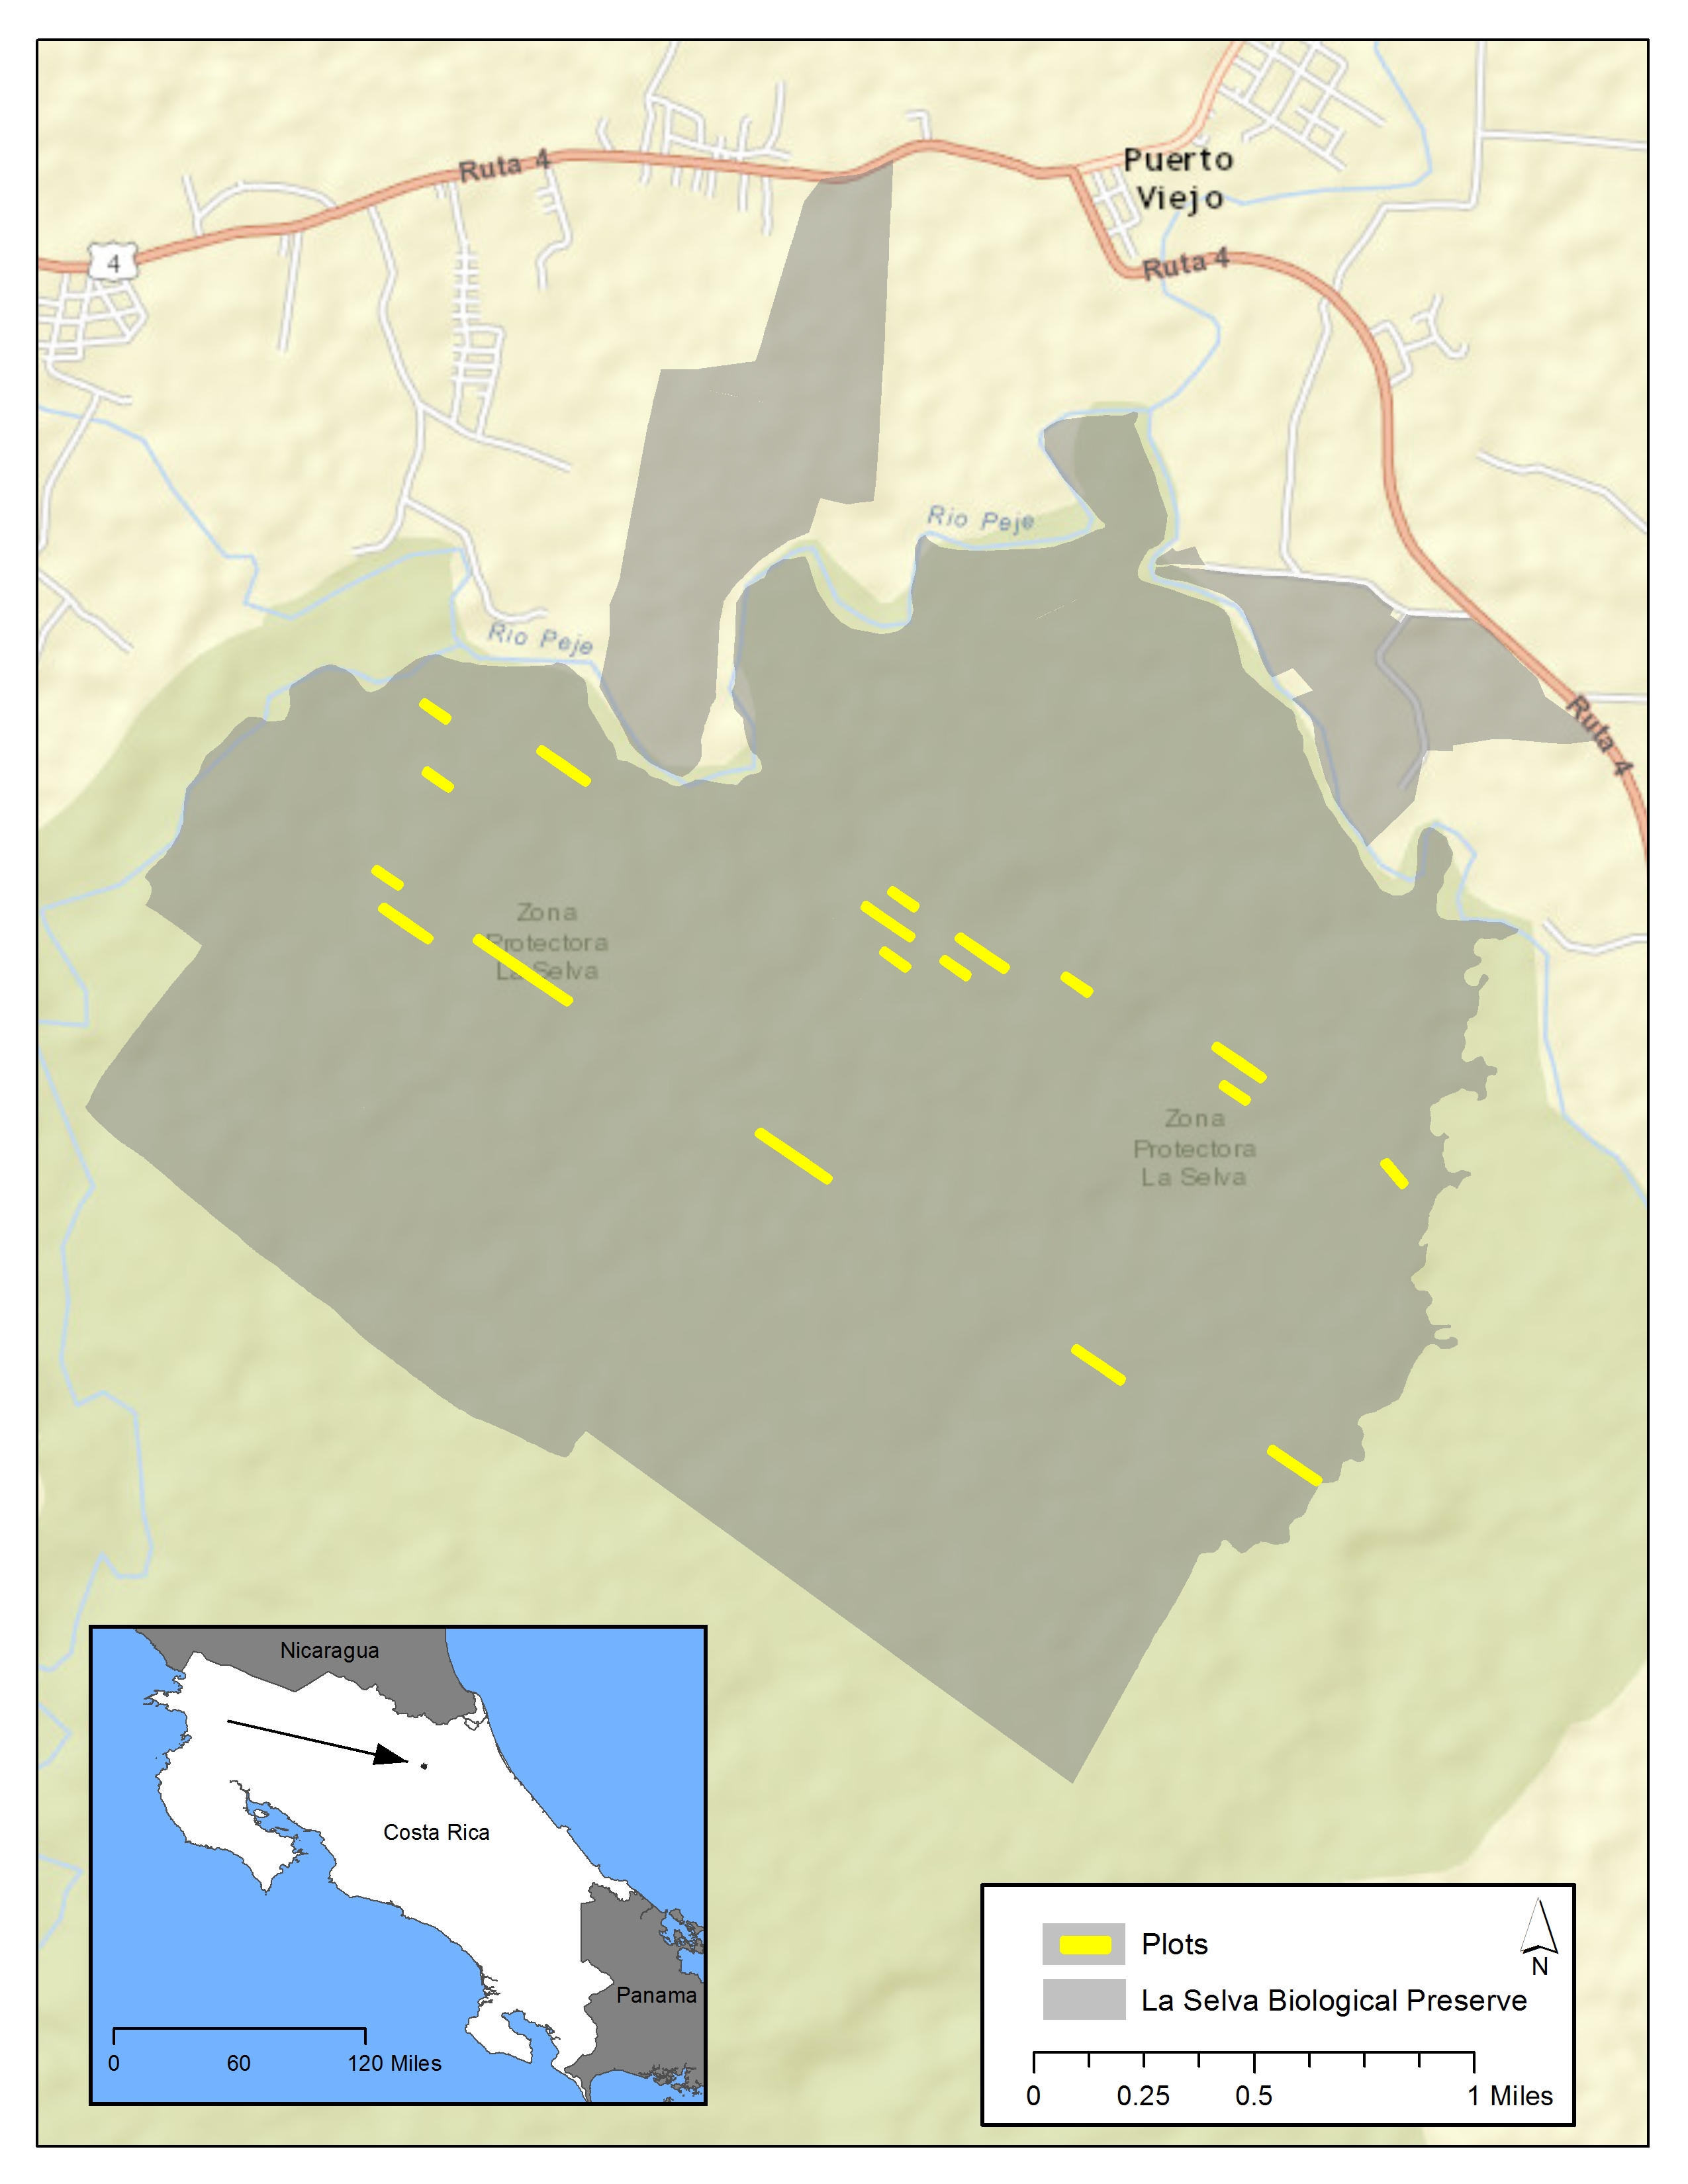
Figure 1. La Selva, Costa Rica sampling locations (sampling locations from the plots.zip shapefile). All 30 locations are included within the yellow areas.
Data and Documentation Access:
Get Data: http:daac.ornl.gov/cgi-bin/dsviewer.pl?ds_id=1215
Data Citation:
Cite this data set as follows:
Goncalves, F.G., R.N. Treuhaft, J.R. Santos, and P.M.L.A. Graca. 2014. Forest Structure and Biomass Data, La Selva, Costa Rica, 2006. Data set. Available on-line (http://daac.ornl.gov) from ORNL DAAC, Oak Ridge, Tennessee, USA. http://dx.doi.org/10.3334/ORNLDAAC/1215
Table of Contents:
- 1 Data Set Overview
- 2 Data Characteristics
- 3 Applications and Derivation
- 4 Quality Assessment
- 5 Acquisition Materials and Methods
- 6 Data Access
- 7 References
1. Data Set Overview:
The estimation of biomass in tropical forests is important because they contain approximately half of the Earth's forested biomass, and their characterization with remote sensing is difficult due to their density and structural complexity. Measurements of standing biomass can be compared over different epochs to determine biomass change and infer rates of atmospheric carbon gain or loss due to land management, disturbance, and regrowth. One approach to improve our ability to use remote sensing and other technologies to accurately estimate forest biomass at spatial scales greater than those feasible by traditional field measurements has been to coordinate campaigns of simultaneous measurements at a single site. La Selva Biological Station in Costa Rica is an ideal site for this type of study as it is a well characterized forest with decades of tree inventory and diameter increment data available and also has a well-established geographic reference grid allowing accurate locations for each stem to be recorded.
Field measurements were made of diameter, tree height, and crown dimensions for 1,513 trees in 30 plots at La Selva. The plots were mainly in old-growth forest, some in old-growth forest which had been selectively logged. Additional plots were in secondary forest of varying ages. Aboveground biomass for each of the 30 plots was calculated from diameter and height data. The crown measurements were used to estimate a vertical profile for each plot, showing the vegetation volume in 1 meter increments from the ground to the top of the canopy. These ground data can and have been used to calibrate and validate remote sensing measurements (e.g. LiDAR and InSAR) taken over the same plots.
The investigators were Dr Robert Treuhaft and Dr Fabio Goncalves.
2. Data Characteristics:
There are three comma-delimited data files (.csv) and two shapefiles with this data set. The .csv files contain the measurements and calculated biomass for the individual stems. The shapefiles provide summary data at the plot level.
2.1. Spatial Coverage
Site: La Selva Biological Station, Costa Rica
Site boundaries: (All latitude and longitude given in degrees and fractions)
| Site (Region) | Westernmost Longitude | Easternmost Longitude | Northernmost Latitude | Southernmost Latitude |
|---|---|---|---|---|
| La Selva Biological Station, Costa Rica | -84.021195 | -84.021195 | 10.421864 | 10.421864 |
2.2. Temporal Coverage
The data set covers the period 2006/02/11 to 2006/02/23.
2.3. Data File information
Field measurements of (1) tree stem diameter, total height, height to the crown base, crown dimensions, (2) calculations of biomass at the plot level, and (3) calculated vegetation density profiles from ground level to the top of the canopy for each plot, are presented in three comma-delimited data files. In addition, two shapefiles are included (each a set of multiple auxiliary files with the same name and different file extensions. These files provide the location of each stem (trees.shp) and the sampling transect plots (plots.shp).
Files names:
File #1: Tree_data.csv
File #2: Plot_data.csv
File #3: Plot_profile_data.csv
File # 4: plots.zip
File # 5: tree_data.zip
File #1: Tree_data.csv
Note: The location of the trees are in the shapefile (file #5) tree_data.zip
| Column | Column Heading | Units/format | Description |
|---|---|---|---|
| 1 | Plot | Plot identification number | |
| 2 | DBH | cm | Diameter at breast height (1.3 meters above the ground) |
| 3 | Ht_crown | m | Height of crown base in meters |
| 4 | Ht_total | m | Total tree height in meters |
| 5 | Depth_crown | m | Crown depth in meters |
| 6 | Diam_x_crown | m | Crown diameter reported in meters |
| 7 | Diam_y_crown | m | Crown diameter in the orthogonal direction to the previous measurement reported in meters |
Sample data for File #1
|
Plot,DBH,Ht_crown,Ht_total,Depth_crown,Diam_x_crown,Diam_y_crown 1,26.0,16.7,21.6,4.9,8.4,6.6 1,18.0,10.7,18.6,7.9,5.0,5.5 1,15.5,10.7,16.7,6.0,4.7,7.0 ... 14,10.5,10.7,15.7,5,3,5 14,16.5,13.7,24.5,10.8,5.4,4.6 14,13,9.7,17.6,7.9,4.7,4.5 ... 30,10.0,2.3,7.6,5.3,6.3,6.3 30,28.0,12.7,19.6,6.9,8.5,9.4 30,13.5,6.6,11.7,5.1,3.8,3.8 |
File #2: Plot_data.csv
Note: The data provided in this .csv file are also provided in the shapefile (file #4) plots.zip
| Column | Column Heading | Units/format | Description |
|---|---|---|---|
| 1 | Plot | Plot identification number | |
| 2 | Plot_name | Plot identification name | |
| 3 | Date | YYYYMMDD | Inventory date |
| 4 | Forest_type | Forest type: old growth, selectively-logged forest or secondary forest with an associated age range | |
| 5 | Stem_density | trees/ha | Stem density reported in trees per hectare |
| 6 | Basal_area | m2/ha | Basal area reported in meters squared per hectare |
| 7 | Mean_height | m | Mean height of the trees reported in meters |
| 8 | AGBM | Mg/ha | Aboveground biomass reported in Megagrams per hectare and calculated using the allometric equation and wood density reported by Chave et al. |
| 9 | Elevation | m | Elevation of the sample plot reported in meters above sea level |
| 10 | Slope | percent | Mean slope of the sample plot reported in percent |
| 11 | Aspect | degrees | Aspect of the sample plot reported in degrees |
Sample data for File #2
|
Plot,Plot_name,Date,Forest_type,Stem_density,Basal_area,Mean_height,AGBM,Elevation,Slope,Aspect 1,P1A,20060211,old-growth forest,450,62.8,19.1,392.7,56.2,5.5,215.1 2,P1B,20060211,old-growth forest,300,76.1,18.7,437.9,52.5,5.4,253.6 3,P2,20060211,old-growth forest,490,29.3,20.3,244.6,66.8,2.3,260 ... 14,P9,20060216,secondary forest (24-30 yr),700,50.6,23.7,455.7,54.1,48.9,114.4 15,P10A,20060217,selectively-logged forest,370,27.5,22,232.2,83.5,12.1,310.5 16,P10B,20060217,selectively-logged forest,490,30.1,21.4,260.4,81.3,6.9,45.3 ... 28,P18B,20060223,selectively-logged forest,390,16.2,20.3,140.8,104.9,14.8,92.3 29,P18C,20060223,selectively-logged forest,450,32.9,21.0,271.5,86.3,6.2,40.4 30,P18D,20060223,selectively-logged forest,500,32.4,19.9,255.6,102.6,11.3,215.1 |
File #3: Plot_profile_data.csv
| Column | Column Heading | Units/format | Description |
|---|---|---|---|
| 1 | Plot | Plot identification | |
| 2 | Plot_name | Plot identification name | |
| 3 | Height_bin | m | Height bin in meters above the ground: the canopy was divided into 1 meter bins defined by the lower and upper limits |
| 4 | Volume | m3 | Volume of vegetation (m3)found in the corresponding height bin. Calculations are based on the measurements of crown depth and lateral axes and the assumption that the volume is uniformly filled with leaves |
Sample data for File #3:
|
Plot,Plot_name,Height_bin,Volume 1,P1A,0 to 1,0 1,P1A,1 to 2,12.463 1,P1A,2 to 3,25.392 ... 16,P10B,0 to 1,0 16,P10B,1 to 2,0 16,P10B,2 to 3,2.3281 ... 30,P18D,47 to 48,0 30,P18D,48 to 49,0 30,P18D,49 to 50,0 |
File #4: Plots.zip: A shapefile, which when unzipped, contains six files (*.shx, *.dbf, *.prj, *.sbn, *.sbx, and *.shp)
Note: The data provided in this shapefile file are also provided in the .csv (file #2) plots.zip
Parameters of the shapefile:
Geometry Type: Polygon
Projected Coordinate System: WGS_1984_UTM_Zone_16N
Geographic Coordinate System: GCS_WGS_1984
Datum: D_WGS_1984
Prime Meridian: Greenwich
Angular Unit: Degree
Projection: Transverse Mercator
False Easting: 500000.00000000
False Northing: 0.00000000
Central Meridian: -87.00000000
Scale Factor: 0.99960000
Latitude of Origin: 0.00000000
Linear Unit: Meter
Attributes:
FID: Internal feature number; sequential unique whole numbers that are automatically generated
Shape: Feature geometry
plot_id: Plot identification number
plot_nam_1: Plot identification name
date: Inventory date
type: Forest type
density: Stem density reported in trees per hectare
basal_area: Basal area reported in meters squared per hectare
height: Mean height of the trees reported in meters
biomass: Aboveground biomass reported in Megagrams per hectare and calculated using the allometric equation and wood density reported by Chave et al.
elevation: Elevation of the sample plot reported in meters above sea level
slope: Mean slope of the sample plot reported in percent
aspect: Aspect of the sample plot reported in degrees
File #5: tree_data.zip: A shapefile, which when unzipped, contains four files (*.shx, *.dbf, *.prj, and *.shp).
Parameters of the shapefile:
Geometry Type: Point
Geographic Coordinate System: GCS_WGS_1984
Datum: D_WGS_1984
Prime Meridian: Greenwich
Angular Unit: Degree
Attributes
FID: Internal feature number; sequential unique whole numbers that are automatically generated
Shape: Feature geometry
ID: Tree identification number
PARCELA: Plot identification name
X_UTM: Longitudinal coordinate
Y_UTM: Latitudinal coordinate
DAP: Diameter at breast height (1.3 meters above the ground) in centimeters
HCOM: Commercial height in meters
HCOP: Height of crown base in meters
HTOT: Total tree height in meters
COPA_X: Crown diameter reported in meters
COPA_Y: Crown diameter in the orthogonal direction to the previous measurement reported in meters
3. Data Application and Derivation:
Field measurements of forest structure and biomass can be used to calibrate and validate measurements derived from less labor intensive remote sensing techniques such as LiDAR or InSAR. The data can also be used as a baseline for future inventories to assess rates of biomass change in this forest.
4. Quality Assessment:
Tree heights were visually estimated and calibrated by clinometer measurements. They were determined to be accurate to 1 m, as described by Goncalves and Santos (2008).
The assumption of uniform vegetation distribution within the crown is a potential source of error for the profile volume calculations. Alternate models of foliage distribution within crowns and the differences in results depending on the model used are discussed in Treuhaft et al. (2009).
5. Data Acquisition Materials and Methods:
Site Characteristics
La Selva is a tropical wet forest (Holdridge, 1947), characterized by a high diversity of trees, lianas, and epiphytes (McDade et al., 1994). It is comprised of about 55% primary forest. It gets about 4 m/year of rainfall. For this study, field measurements were made along thirty 10 by 100-m transects (plots). Fourteen of these plots were in undisturbed primary forest, six were in primary forest which had been selectively logged, seven were secondary forests, and three were abandoned pastures reverting to forest.
Methods
Field measurements included the location of each tree in along- and
cross-transect coordinates, diameter at breast height, height to the base of the
crown, total height, and lateral dimensions of the crown of each tree. All tree
heights were estimated visually. For each tree with diameter at breast height
greater than 10 cm (greater than 5 cm for the recently abandoned pasture plots),
heights were measured by sighting along the arm to subtend angles from the
bottom to the top of the tree. Vantage points were sought which optimized the
visibility of the tops of trees. These visual height estimates were calibrated
by clinometer measurements (Goncalves and Santos, 2008).
The biomass of each tree, Mfield (reported in kilograms), was estimated from measurements of the diameter at breast height or above buttress D (cm) and total height H (m), for all trees using the allometric equation for tropical wet forests developed by Chave et al. (2005):
Mfield = 0.0776 *(rhoD^2H)^0.940
where rho (in g per cm^3) is the wood density, assumed to have a linear dependence with diameter class, (Chave et al. 2004). Because species identification was not done, a mean value for density of 0.602 g per c^3, from a broad set of measurements of wet tropical forests in Central America (Chave et al., 2006), was associated with the average D measured at La Selva of 22.4 cm. The biomass was calculated by adding the mass of all trees measured in a transect (plot), and dividing by the area of the transect (plot) for field measurements, 10 by 100 m, or 0.1 ha.
Lateral dimensions of the crowns were estimated by stretching measuring tape between points directly beneath the extrema of the observed crown, in the directions parallel and perpendicular to the transect. From these measurements, the lateral axes of each tree modeled as an ellipsoid were calculated (Nelson, 1997). The volume of each ellipsoid overlapping an altitude bin was assumed to be uniformly filled with leaf area and summed to calculate the leaf area volume for a series of height bins of 1 meter thickness which extended from the ground to maximum canopy height. The assumption of uniformly filled volume may contribute some error to the calculations and an assessment of multiple possible distribution models is discussed in Treuhaft et al. (2009).
6. Data Access:
This data is available through the Oak Ridge National Laboratory (ORNL) Distributed Active Archive Center (DAAC).
Data Archive Center:
Contact for Data Center Access Information:
E-mail: uso@daac.ornl.gov
Telephone: +1 (865) 241-3952
7. References:
Chave, J., R. Condit, S. Aguilar, A. Hernandez, S. Lao, and R. Perez (2004). Error propagation and scaling for tropical forest biomass estimates, Philos. Trans. R. Soc. B, 359, 409.
Chave, J., et al. (2005). Tree allometry and improved estimation of carbon stocks and balance in tropical forests, Oecologia, 145, 87.
Chave, J., H. C. Muller-Landau, T. R. Baker, T. A. Easdale, H. T. Steege, and C. O. Webb (2006). Regional and phylogenetic variation of wood density across 2456 neotropical tree species, Ecol. Appl., 16(6), 2356.
Goncalves, F. G., and J. R. dos Santos (2008). Composicao Floristica e estrutura de uma unidade de manejo florestal sustentavel na Floresta Nacional do Tapajos, Para, Acta Amazonica, 38(2), 229.
Holdridge, L. R. (1947). Determination of world plant formations from simple climatic data, Science, 105, 367.
McDade, L. A., K. S. Bawa, H. A. Hespenheide, and G. S. Hartshorn (Eds.) (1994). La Selva: Ecology and Natural History of a Neotropical Rain Forest, Univ. of Chicago Press, Chicago, Ill.
Nelson, R. (1997). Modeling forest canopy heights: The effects of canopy shape, Remote Sens. Environ., 60, 327.
Treuhaft, R.N., Chapman, B.D., Dos Santos, J.R., Goncalves, F.G., Dutra, L. V., Graca, P.M.L. a., Drake, J.B. (2009). Vegetation profiles in tropical forests from multibaseline interferometric synthetic aperture radar, field, and lidar measurements. Journal of Geophysical Research 114, D23110.
Treuhaft, R.N., Goncalves, F.G., Drake, J.B., Chapman, B.D., Dos Santos, J.R., Dutra, L. V., Graca, P.M.L. a., Purcell, G.H. (2010). Biomass estimation in a tropical wet forest using Fourier transforms of profiles from lidar or interferometric SAR. Geophysical Research Letters 37, L23403.
Van Zyl, J. J., A. Chu, S. Hensley, Y. Lou, and Y. Kim (1997). The AIRSAR/TOPSAR integrated multifrequency polarimetric and interferometric SAR processor, Conf. Publ. 449, p. 100, Inst. of Eletr. Eng., New York.