Documentation Revision Date: 2023-08-23
Dataset Version: 2
Summary
These L3 data products will be updated as additional observations are captured and calibrations are improved.
There are 25 data files in GeoTIFF (*.tif) format included in this dataset. The data correspond to five measure variables: gridded canopy height and standard deviation, ground elevation and standard deviation, and laser footprint counts. The most recent data in this release were computed using footprints from the 19th through the 223rd mission weeks (2019-04-19 to 2023-03-22). There are four additional time periods available for each of the variables: 1) the 19th through the 122nd mission weeks (2019-04-18 to 2021-04-14), 2) from the 19th through the 96th mission weeks (2019-04-18 to 2020-10-13), 3) from the 19th through the 138th mission weeks (2019-04-19 to 2021-08-04), and 4) from the 19th through the 223rd mission weeks (2019-04-19 to 2023-03-22). There are also 25 files in Portable Network Graphics (*.png) format (one derived from each data file) provided as companion files which must be downloaded separately from the data files, and two additional companion files in .pdf format.
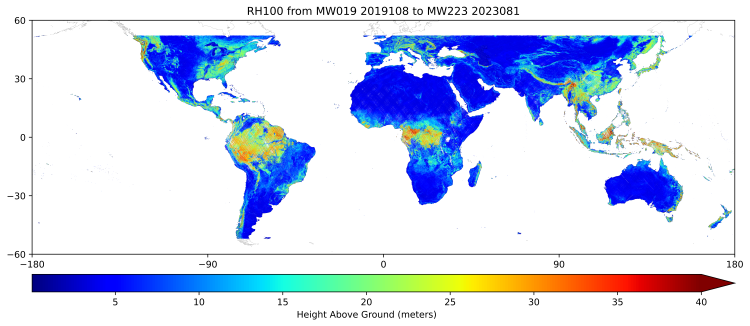
Figure 1. Level 3 estimated canopy height in meters derived from the Level 2 profile metric RH100 between the 19th and the 223rd mission week. Source: GEDI03_rh100_mean_2019108_2023081_002_05.tif
Citation
Dubayah, R.O., S.B. Luthcke, T.J. Sabaka, J.B. Nicholas, S. Preaux, and M.A. Hofton. 2021. GEDI L3 Gridded Land Surface Metrics, Version 2. ORNL DAAC, Oak Ridge, Tennessee, USA. https://doi.org/10.3334/ORNLDAAC/1952
Table of Contents
- Dataset Overview
- Data Characteristics
- Application and Derivation
- Quality Assessment
- Data Acquisition, Materials, and Methods
- Data Access
- References
- Dataset Revisions
Dataset Overview
This dataset provides Global Ecosystem Dynamics Investigation (GEDI) Level 3 (L3) gridded mean canopy height, standard deviation of canopy height, mean ground elevation, standard deviation of ground elevation, and counts of laser footprints per 1-km x 1-km grid cells globally within -52 and 52 degrees latitude. These L3 gridded products were derived from Level 2 (L2) geolocated laser footprint return profile metrics from the GEDI instrument onboard the International Space Station (ISS). Canopy height is provided as the mean height (in meters) above the ground of the received waveform signal that was the first reflection off the top of the canopy (RH100). Ground elevation is provided as the mean elevation (in meters) of the center of the lowest waveform mode relative to the WGS84 reference ellipsoid. L3 gridded products can be used to characterize important carbon and water cycling processes, biodiversity, habitat and can also be of immense value for climate modeling, forest management, snow and glacier monitoring, and the generation of digital elevation models. This dataset version uses Version 2 of the input L2 data, which includes improved geolocation of the footprints as well as a modified method to predict an optimum algorithm setting group.
These L3 data products will be updated as additional observations are captured and calibrations are improved.
Project: Global Ecosystem Dynamics Investigation
The Global Ecosystem Dynamics Investigation (GEDI) produces high resolution laser ranging observations of the 3D structure of the Earth. GEDI’s precise measurements of forest canopy height, canopy vertical structure, and surface elevation greatly advance our ability to characterize important carbon and water cycling processes, biodiversity, and habitat. GEDI was funded as a NASA Earth Ventures Instrument (EVI) mission. It was launched to the International Space Station in December 2018 and completed initial orbit checkout in April 2019.
Related Publication
Dubayah, R., J.B. Blair, S. Goetz, L. Fatoyinbo, M. Hansen, S. Healey, M. Hofton, G. Hurtt, J. Kellner, S. Luthcke, J. Armston, H. Tang, L. Duncanson, S. Hancock, P. Jantz, S. Marselis, P.L. Patterson, W. Qi, and C. Silva. 2020. The Global Ecosystem Dynamics Investigation: High-resolution laser ranging of the Earth’s forests and topography. Science of Remote Sensing 1:100002. https://doi.org/10.1016/j.srs.2020.100002
Related Datasets
Dubayah, R.O., S.B. Luthcke, T.J. Sabaka, J.B. Nicholas, S. Preaux, and M.A. Hofton. 2021. GEDI L3 Gridded Land Surface Metrics, Version 1. ORNL DAAC, Oak Ridge, Tennessee, USA. https://doi.org/10.3334/ORNLDAAC/1865
- The previous release of the GEDI L3 gridded land surface metrics data, covering the period between the 19th and the 122nd mission weeks (2019-04-18 to 2020-04-15).
Acknowledgments
This work was funded by NASA Earth Ventures Instrument (EVI) mission (contract NNL15AA03C) to the University of Maryland for the development and execution of the GEDI mission (Dubayah, Principal Investigator).
Data Characteristics
Spatial Coverage: Global within a latitude extent of -52 to +52 degrees
Spatial Resolution: 1 km
Temporal Coverage: 2019-04-18 to 2023-03-22 (will expand with periodic data updates)
Temporal Resolution: One-time estimate
Study Area: Latitude and longitude are given in decimal degrees
| Site | Westernmost Longitude | Easternmost Longitude | Northernmost Latitude | Southernmost Latitude |
|---|---|---|---|---|
| Global | -180 | 180 | 52 | -52 |
Data File Information
There are 25 data files in GeoTIFF (*.tif) format included in this dataset. The GeoTIFF files were optimized for use in a cloud environment as described by https://www.cogeo.org. There are also 25 companion files in Portable Network Graphics (*.png) (one derived from each of the 25 data files) and two additional companion files in Portable Document (*.pdf) formats. Companion files must be downloaded separately from the data files.
The data files are named <product>_<variable>_<start_date>_<end_date>_<release>_<version>.<ext>, where:
- <product> is the product shortname "GEDI03", designating GEDI Level 3 data,
- <variable> is one of five measured variables ("counts", "rh100_mean", "rh100_stddev", "elev_lowestmode_mean", or "elev_lowestmode_stddev"),
- <start_date> and <end_date> are the Julian days of the mission period in YYYYDDD format, e.g., “2019108_2021216” for the 19th and the 138th mission week (2019-04-18 to 2021-08-04)”,
- <release> is the release number for the SOC SDS software release,
- <version> is the granule production version, and
- <ext> is the file extension ("tif" or "png").
Table 1. File names and descriptions. Each of the five variables has two files corresponding to the two mission periods.
| File Name | Description |
|---|---|
| Data Files-there are 25 files | |
| GEDI03_counts_<start_date>_<end_date>_<release>_<version>.tif | Number of valid laser footprints in each grid cell. |
| GEDI03_elev_lowestmode_mean_<start_date>_<end_date>_<release>_<version>.tif | Ground elevation approximated by the mean elevation of the lowest mode of valid footprints in each grid cell. Derived from the L2A LIDAR metric data product, the elevation of the center of the lowest mode relative to the WGS84 reference ellipsoid. |
| GEDI03_elev_lowestmode_stddev_<start_date>_<end_date>_<release>_<version>.tif | Standard deviation of the elevation of lowest mode of valid footprints in each grid cell. |
| GEDI03_rh100_mean_<start_date>_<end_date>_<release>_<version>.tif | Canopy height above ground in each grid cell characterized by the mean RH100 values of valid footprints in each grid cell. RH100 or relative height is the 100th percentile of waveform energy relative to ground elevation. Derived from the L2B LIDAR metric RH100 data product. |
| GEDI03_rh100_stddev_<start_date>_<end_date>_<release>_<version>.tif | Standard deviation of RH100 for all valid footprints in each grid cell. |
| Companion Files-27 total files including one file for each data file (25) and two additional files in .pdf format | |
| GEDI03_counts_<start_date>_<end_date>_<release>_<version>.png | Images of the number of valid laser footprints in each grid cell (Fig. 6). |
| GEDI03_elev_lowestmode_stddev_<start_date>_<end_date>_<release>_<version>.png | Images of the standard deviation of ground elevation. |
| GEDI03_elev_lowestmode_mean_<start_date>_<end_date>_<release>_<version>.png | Images of the estimated mean ground elevation (Fig. 4). |
| GEDI03_rh100_mean_<start_date>_<end_date>_<release>_<version>.png | Images of the estimated mean canopy height (Fig. 1). |
| GEDI03_rh100_stddev_<start_date>_<end_date>_<release>_<version>.png | Images of the standard deviation of canopy height. |
| GEDI_ATBD_L3R01.pdf | Algorithm Theoretical Basis Document (ATBD) for GEDI L3 Gridded Land Surface Metrics that provides details of L3 algorithms and data products. Also available in Luthcke et al. (2021). |
| GEDI_L3_Land_Surface_Metrics_V2.pdf | This user guide in PDF format. |
Data File Details
Table 2. Variable names and descriptions in the data files.
| Variable Name | Description | Native Data Type | No Data Value |
|---|---|---|---|
| counts | Count of valid laser footprints | INT32 | 0 |
| elev_lowestmode_mean | Ground elevation in meters | FLOAT32 | -9999 |
| elev_lowestmode_stddev | Ground elevation-standard deviation in meters | FLOAT32 | -9999 |
| rh100_mean | Canopy height in meters | FLOAT32 | -9999 |
| rh100_stddev | Canopy height-standard deviation in meters | FLOAT32 | -9999 |
Properties of the Cloud-Optimized Data Files
- Bands: 1
- Scale factor: 1
- Number of columns: 34,704
- Number of rows: 14,616
- Tile size (or Block size): 256 by 256
- Map Projection: Equal-Area Scalable Earth (EASE)-Grid 2.0 Global (https://nsidc.org/data/ease)
- Datum: World Geodetic System 1984
- EPSG: 6933
- X-axis map coordinate of the outer edge of the upper-left pixel: -17367530.45
- Y-axis map coordinate of the outer edge of the upper-left pixel: 7314540.83
User Notes
GEDI measurements are made over the Earth’s surface nominally between 51.6° and -51.6° latitude. Because the instrument can be rotated on its ISS mount up to 6°, the lasers can be pointed up to 40 km on either side of the ISS ground track. Thus, the exact spatial coverage of L2 products will vary slightly by orbit. In addition, L3 gridded coverage might differ slightly from L2 data owing to footprint quality checks and grid cell filtering. L3 grid cells failing quality checks and those outside the measurement extent are assigned the no data value. Currently, the data files have a range of 85° to -85° latitude that corresponds to the full extent of the EASE-Grid 2.0. All data collected beyond 51.6° to -51.6° latitude have values set to -9999, except for the variable count where they are set to 0.
Filtering of granules and shots adversely affected by geolocation uncertainty and/or low cloud may result in the omission of woody vegetation patches in otherwise open landscapes (e.g., riparian zones), see Figure 2 for examples. A revised filtering approach is currently being evaluated for common application to Level 3 and 4 gridded products and will be made available in Release 3.
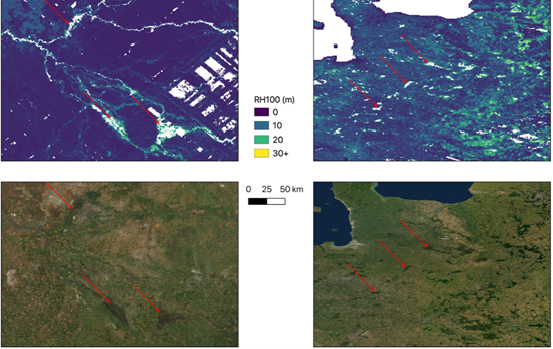
Figure 2. Examples of woody vegetation removed by the current filtering. The red arrows point to forest patches removed by the filtering algorithm and absent from the GEDI RH100 maps shown in the top row of images.
Application and Derivation
The GEDI Level 3 (L3) dataset provides information on forest canopy height and surface elevation, which are used to characterize important carbon and water cycling processes, biodiversity, and habitat. The products can also be of immense value for weather forecasting, forest management, snow and glacier monitoring, and the generation of digital elevation models.
The raw GEDI waveform is captured after a near-infrared pulse of laser energy is fired towards the surface where it is reflected by leaves, branches, and the below canopy bare Earth surface within an approximately 25 m diameter footprint (Fig. 3). The returned waveform is processed to find ground topography, canopy height, and various relative height (RH) metrics. From these metrics, a variety of other products may be derived, including plant density profile, canopy cover, and aboveground biomass.
The current version of L3 products is grid cell mean and standard deviation, supplying the number of shots within a grid cell within each data range to enable the computation of the standard error of the mean and other weighting, smoothing, and filtering by the user.
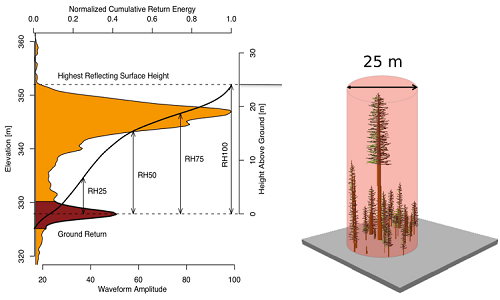
Figure 3. Sample of the GEDI lidar waveform (left). The light brown area under the curve represents return energy from the canopy, while the dark brown area signifies the return from the underlying topography. The black line is the cumulative return energy, starting from the bottom of the ground return (normalized to 0) to the top of the canopy (normalized to 1). RH metrics give the height at which a certain quantile returned energy is reached relative to the ground (i.e., the center of the ground return). The diagram on the right shows the distribution of trees that produced the waveform. Source: Dubayah et al. (2020)
Quality Assessment
The quality of global surface elevation grids was assessed by comparing with re-gridded TanDEM-X (TDX) and Shuttle Radar Topography Mission (SRTM) data. However, SRTM banding and swath errors and minimal TDX penetration were observed in heavily vegetated areas. These characteristics of TDX and SRTM limit the regions where they provide high fidelity comparisons with GEDI products. In future versions, data from additional instruments and projects such as 3DEP and LVIS will be used for calibration and validation of the L3 products in specific regions. The 3DEP project aims to collect airborne lidar over the whole continental US by 2023 resulting in a 1 m2 resolution grid of surface topography. More information on the 3DEP project (https://www.usgs.gov/core-science-systems/ngp/3dep). The LVIS data provide near-continuous mapping with ~20-m footprints, and therefore, provide an excellent dataset for GEDI assessment. The footprint data produced by LVIS is nearly identical to that produced by GEDI. More information on LVIS can be found at https://lvis.gsfc.nasa.gov/Home/index.html. The companion file GEDI_ATBD_L3R01.pdf (Luthcke et al., 2021) provides details on quality assessment.
Data Acquisition, Materials, and Methods
The GEDI Level 3 (L3) global gridded products include canopy height (Fig.1) and standard deviation, ground elevation (Fig. 4) and standard deviation, and counts of valid laser footprints per grid cell (Fig. 6) derived from GEDI L2 data.
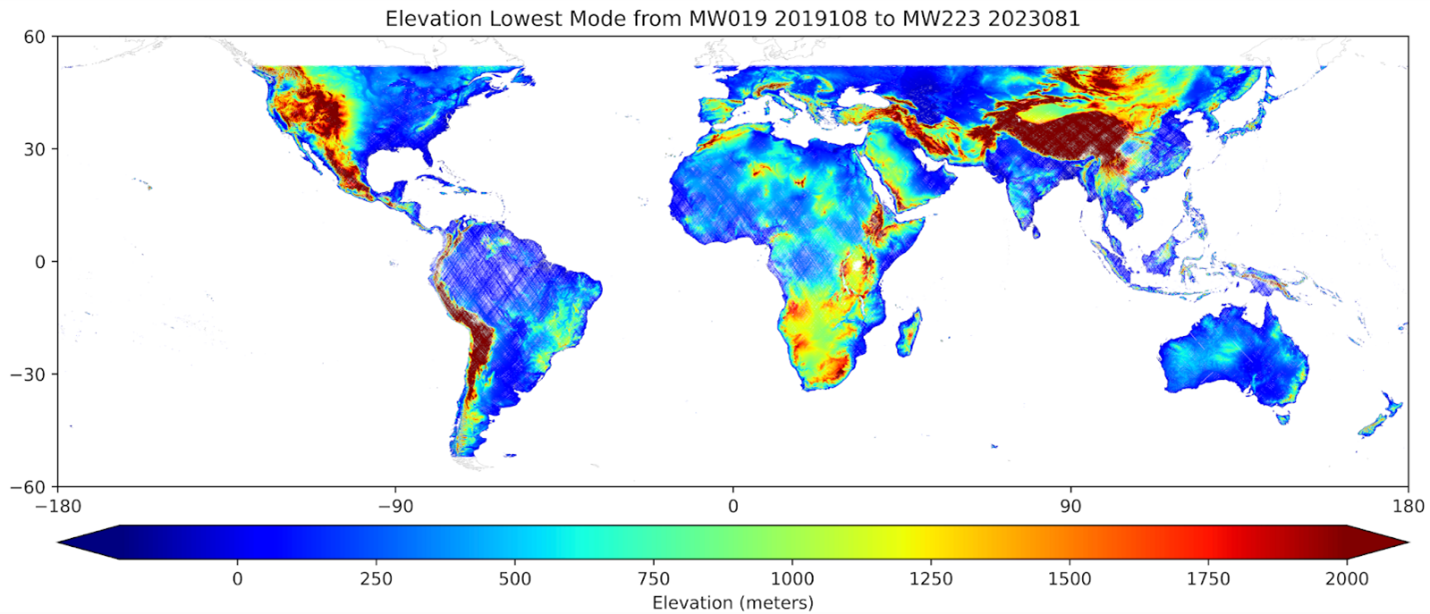
Figure 4. Estimated mean elevation of lowest mode. Image derived from the dataset file GEDI03_elev_lowestmode_mean_2019108_2023081_002_05.tif.
The GEDI instrument, launched on December 5, 2018, produces high-resolution laser ranging observations of the three-dimensional structure of the Earth, collecting data globally between 51.6ºN and 51.6°S latitudes at the highest resolution and densest sampling of any lidar instrument in orbit to date. The instrument consists of three lasers producing a total of eight beam ground transects, which consist of ~30 m footprint samples spaced approximately every 60 m along-track. The beam transects are spaced approximately 600 m apart on the Earth's surface in the cross-track direction, for an across-track width of ~4.2 km (Fig. 5).
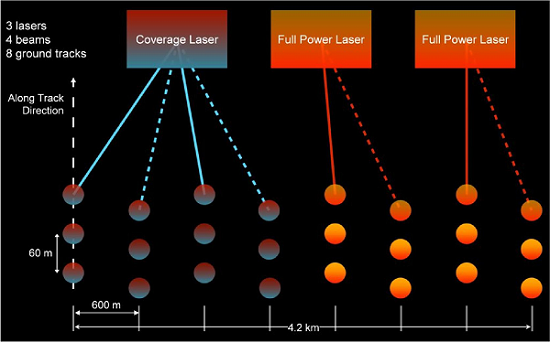
Figure 5. GEDI Beam Ground-track Configuration. Source: Luthcke et al. (2021).
EASE Grid
The 1 km2 resolution global EASE-Grid 2.0 is used for GEDI L3 products. This grid features equal-area cells and compatibility with many existing biosphere datasets. More information on the grid can be found in Brodzic et al. (2012) and online from the National Snow and Ice Data Center at https://nsidc.org/data/ease/ease_grid2.html.
Footprint Processing
GEDI L3 products are grids produced from the Level 2 (L2) geolocated footprint data. L2 footprint positions in latitude and longitude are converted to x- and y-coordinates in the EASE grid 2.0. The L2 footprints are then assigned to 1-km2 grid cells based on the projected ground position at the footprint center (Fig. 6).
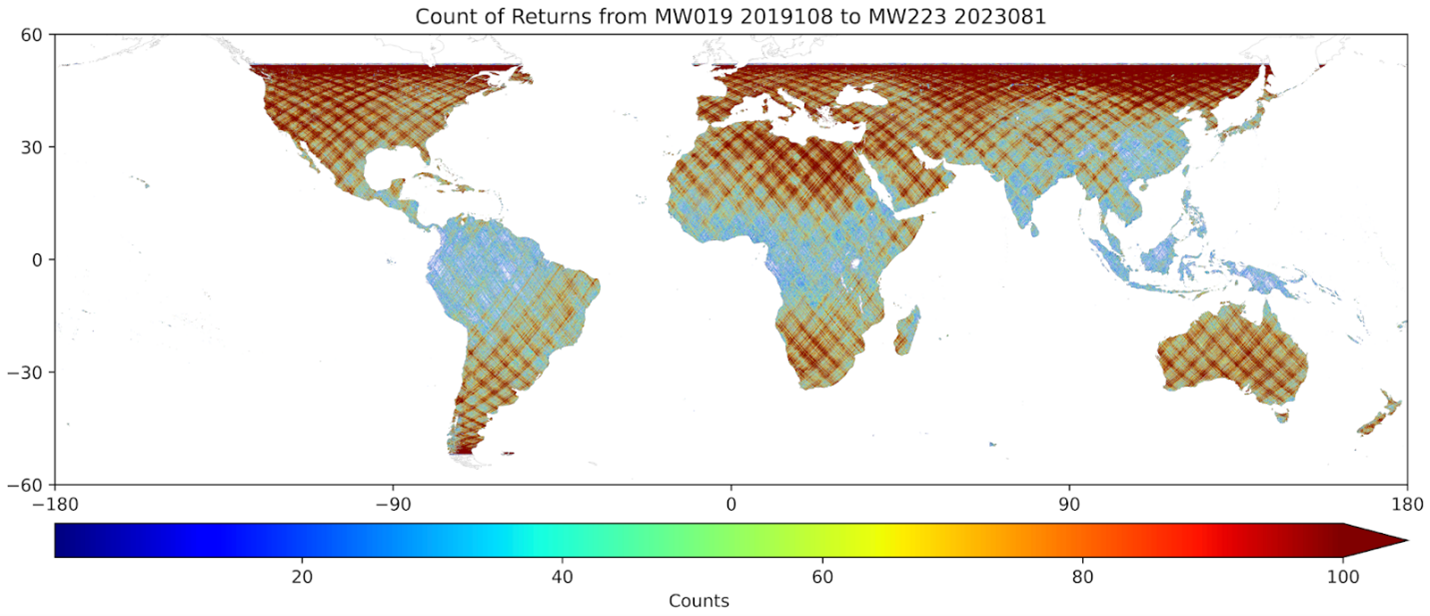
Figure 6. Count of valid laser footprints per grid cell. Image derived from dataset file GEDI03_counts_2019108_2023081_002_05.tif.
Profile Metrics Processing
L2 Footprint Selection
For each product type, the L2 footprint data for each 1-km2 block is identified and filtered according to defined quality criteria. Returns that failed L2A quality checks and were determined to be ocean or failed elevation standard comparisons were excluded. Footprints from previously identified poor-performing orbits were also excluded. Individual footprints are then filtered based on the additional elevation comparisons. Finally, 1 km2 cells were compared to surrounding cells and excluded if either the mean ground elevation or the mean top of canopy height is greater than 3 times the standard deviation of the means from cells in a 125 km box centered on the cell. Refer to the companion file GEDI_ATBD_L3R01.pdf (Luthcke et al., 2021) for details.
L3 Products
GEDI L3 data are gridded products with a cell size of 1 km x 1 km produced from the selected L2 geolocated footprint data. The current release of L3 products uses simple averages and standard deviations of the valid footprints within each 1 km2 cell. This release uses the Version 2 of the input L2 data, which includes improved geolocation of the footprints as well as a modified method to predict an optimum algorithm setting group.
Future releases will use advanced gridding algorithms that can more accurately represent the topography and canopy structure within the grid (Luthcke et al., 2021).
Data Access
These data are available through the Oak Ridge National Laboratory (ORNL) Distributed Active Archive Center (DAAC).
GEDI L3 Gridded Land Surface Metrics, Version 2
Contact for Data Center Access Information:
- E-mail: uso@daac.ornl.gov
- Telephone: +1 (865) 241-3952
References
Brodzik, M.J., B. Billingsley, T. Haran, B. Raup, and M.H. Savoie. 2012. EASE-Grid 2.0: Incremental but significant improvements for Earth-gridded data sets. ISPRS International Journal of Geo-Information 1(3):32–45. http://doi.org/10.3390/ijgi1010032
Dubayah, R., J.B. Blair, S. Goetz, L. Fatoyinbo, M. Hansen, S. Healey, M. Hofton, G. Hurtt, J. Kellner, S. Luthcke, J. Armston, H. Tang, L. Duncanson, S. Hancock, P. Jantz, S. Marselis, P.L. Patterson, W. Qi, and C. Silva. 2020. The Global Ecosystem Dynamics Investigation: High-resolution laser ranging of the Earth’s forests and topography. Science of Remote Sensing 1:100002. https://doi.org/10.1016/j.srs.2020.100002
Luthcke, S.B., T.J. Sabaka, J. Nicholas, S. Preaux, and M. Hofton. 2021. Algorithm Theoretical Basis Document (ATBD) for GEDI L3 Gridded Land Surface Metrics. https://gedi.umd.edu/data/documents (Also provided as companion file GEDI_ATBD_L3R01.pdf)
Dataset Revisions
| Version | Release Date | Revision Notes |
|---|---|---|
|
2.0 |
2023-08-23 |
This update adds new files for the 19th to 223rd mission weeks (2019-04-18 to 2023-03-22). |
|
2.0 |
2022-06-20 |
This update adds new files for the 19th to 162nd mission weeks (2019-04-18 to 2022-01-19). |
|
2.0 |
2022-01-31 |
This update adds new files for 19th to 138th mission weeks (2019-04-18 to 2021-08-04). Filtering of granules and shots adversely affected by geolocation uncertainty and/or low cloud may result in the omission of woody vegetation patches in otherwise open landscapes (e.g., riparian zones). |
| 2.0 | 2021-11-23 |
This release was constructed using Version 2 of Level 2 data, including improved geolocation of the footprints and a modified method to predict an optimum algorithm setting group. Each of the five variables was produced using GEDI observations collected during two different date ranges that include periods between the 19th and the 96th mission weeks (2019-04-18 to 2020-10-13) and between the 19th and the 122nd mission weeks (2019-04-18 to 2021-04-14). |
| 1.0 | 2021-03-15 | Initial release of data with GEDI observations captured during the period 2019-04-18 (19th mission week) to 2020-04-15 (70th mission week). Superseded by Version 2 and available only upon request. |