Documentation Revision Date: 2024-06-21
Dataset Version: 3
Summary
These data are provided to facilitate station-level cross validation analyses that can offer insights into the regional accuracy of the Daymet model for the three station-level input parameters. Regression statistics and mean absolute error can be derived using the provided companion file R code to assess temporal and spatial patterns of uncertainty.
There are 120 netCDF version 4 files that contain the daily input observations and predicted values. Each variable-year combination is a separate file. Provided as companion files, are 120 corresponding comma separated value (.csv) files that contain metadata for every surface weather station for the variable-year combinations. Also, provided as companion files are a sample R code and sample output files (7 files total).
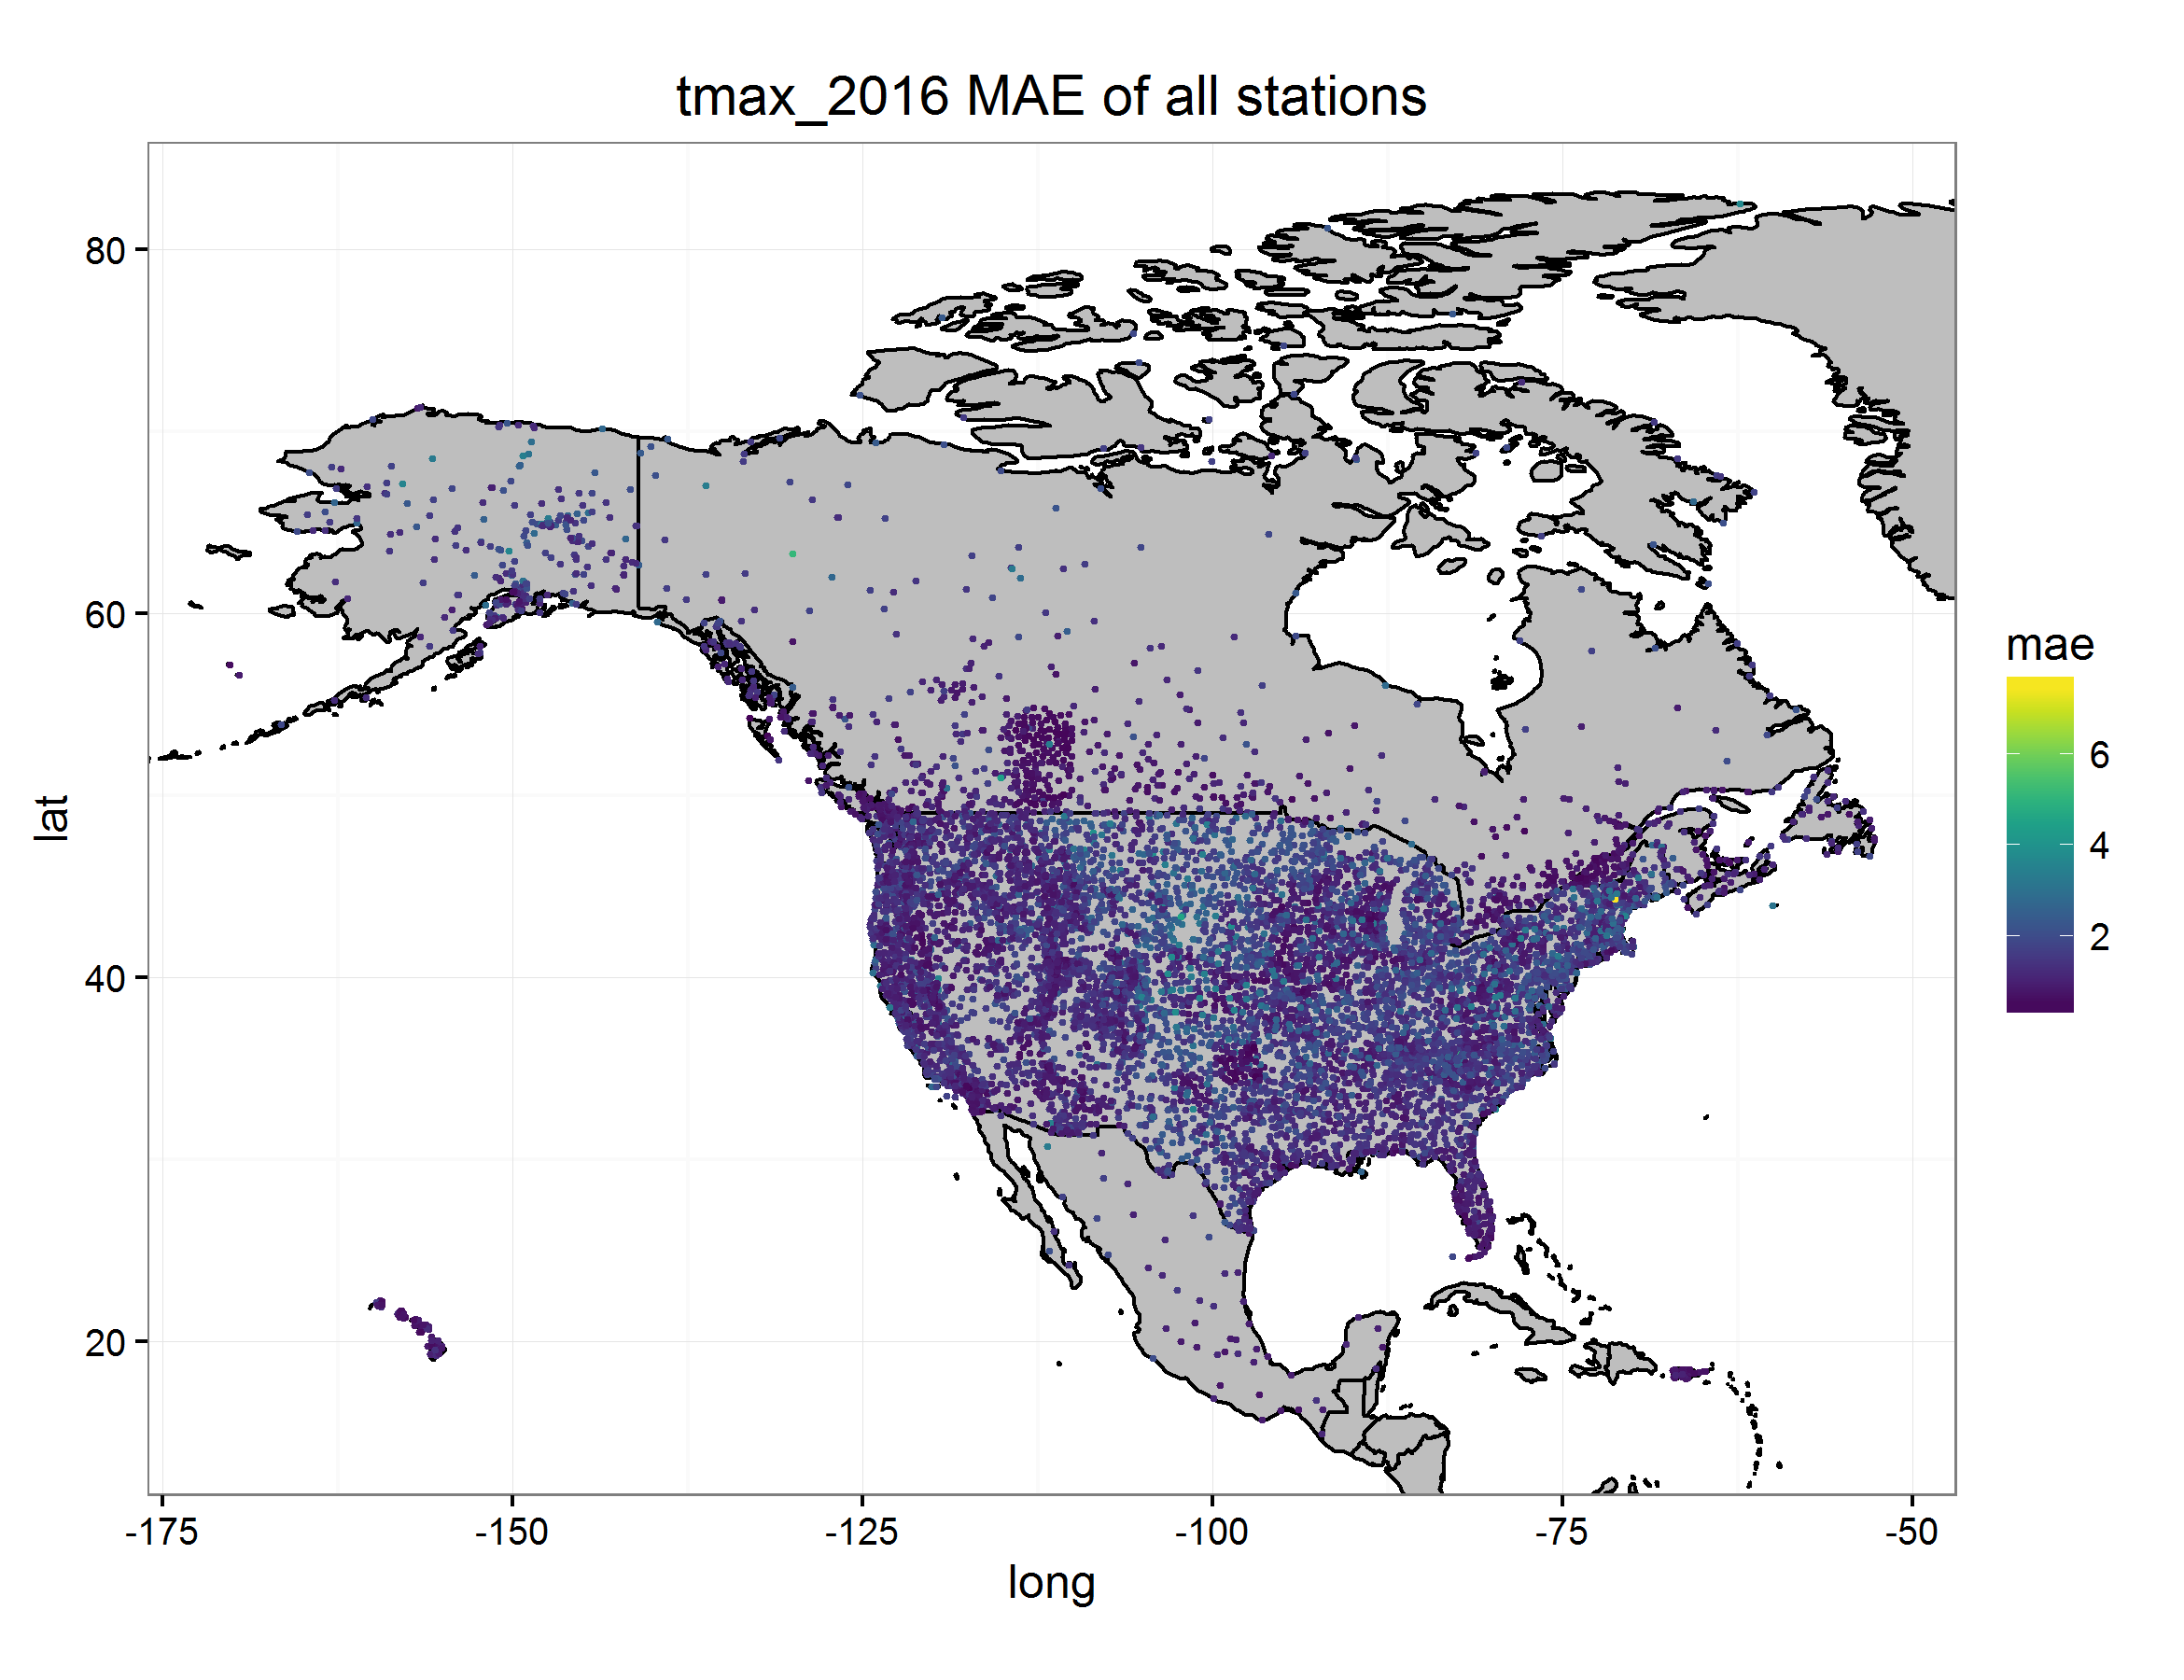
Figure 1. Station-level cross validation sample output from the included R script companion file. Weather station locations and annual mean absolute error (MAE; degrees C) for the variable maximum temperature (tmax) in 2016. Derived from file daymet_v3_stnsxval_tmax_2016.nc4.
Citation
Thornton, M.M., P.E. Thornton, Y. Wei, R.S. Vose, and A.G. Boyer. 2017. Daymet: Station-Level Inputs and Model Predicted Values for North America, Version 3. ORNL DAAC, Oak Ridge, Tennessee, USA. https://doi.org/10.3334/ORNLDAAC/1391
Table of Contents
- Dataset Overview
- Data Characteristics
- Application and Derivation
- Quality Assessment
- Data Acquisition, Materials, and Methods
- Data Access
- References
- Dataset Revisions
Dataset Overview
This data set reports the station-level daily weather observation data and the corresponding Daymet model predicted data for three Daymet model parameters: minimum temperature (tmin), maximum temperature (tmax), and daily total precipitation (prcp). Each data file contains the daily observations and Daymet model predicted values for one variable and one year (1980 - the current full calendar year) for stations across North America. Also included are corresponding station metadata files for each variable and year, including the station name, station identification, latitude, and longitude.
These data are provided to facilitate station-level cross validation analyses that can offer insights into the regional accuracy of the Daymet model performance for the three station-level input parameters. Regression statistics and mean absolute error can be derived using the provided companion file R code to assess temporal and spatial patterns of uncertainty.
The surface weather observations included here are the same input used for processing "Daymet: Daily Surface Weather Data on a 1-km Grid for North America, Version 3" (Thornton et al., 2016), and were obtained from the Global Historical Climatology Network - Daily land surface station observations data set acquired from the National Environmental Satellite, Data, and Information Service (NESDIS) (Menne, 2012).
Project: Daymet
Daymet is a collection of gridded estimates of daily weather parameters generated by interpolation and extrapolation from daily meteorological observations. Weather parameters in Daymet include daily surfaces of minimum and maximum temperature, precipitation, humidity, radiation, snow water equivalent, and day length produced on a 1 km x 1 km gridded surface over North America, Puerto Rico, and Hawaii.
Related Data Sets:
Thornton, P.E., M.M. Thornton, B.W. Mayer, Y. Wei, R. Devarakonda, R.S. Vose, and R.B. Cook. 2016. Daymet: Daily Surface Weather Data on a 1-km Grid for North America, Version 3. ORNL DAAC, Oak Ridge, Tennessee, USA. https://doi.org/10.3334/ORNLDAAC/1328
Thornton, P.E., M.M. Thornton, and R.S. Vose. 2016. Daymet: Annual Tile Summary Cross-Validation Statistics for North America, Version 3. ORNL DAAC, Oak Ridge, Tennessee, USA. https://doi.org/10.3334/ORNLDAAC/1348
Data Characteristics
Spatial Coverage: North America and Hawaii: including Canada, Mexico, the United States of America, Puerto Rico, and Bermuda.
Spatial Resolution: point locations
Temporal Coverage: 1980-01-01 to 2019-12-31
Temporal Resolution: Daily
Study Area: (All latitude and longitude given in degrees and fractions)
|
Site |
Westernmost Longitude |
Easternmost Longitude |
Northernmost Latitude |
Southernmost Latitude |
|---|---|---|---|---|
|
North America, Puerto Rico, and Hawaii |
-180.00 |
-52.00 | 84.00 | 14.00 |
Data File Information:
There are 120 netCDF version 4 files that contain the daily input observations and Daymet model predicted values. Each variable-year combination is a separate file.
Provided as companion files are the corresponding 120 comma separated value (.csv) files that contain metadata information for every surface weather station. These files are also available as separate variable-year combinations.
Also, provided as a companion file is a sample R script that takes as input the variable and year of interest and (1) derives R-squared and mean absolute error (MAE) values of the observed vs. predicted values for each station, (2) plots and maps input and derived data, and (3) outputs a *.csv file containing the station_IDs, latitude and longitude, R-squared and MAE values of the observed vs. predicted for each station for the specified variable-year combination.
netCDF Files
There are 120 netCDF files, where each variable-year combination is a separate CF-compliant netCDF-4 format file. These station-level files contain daily data from Daymet input surface weather stations as separate files for each of the three input variables for each year of available data. Note that there may be a different number of stations from year to year and between the three variables.
File names follow this syntax: daymet_v3_stnsxval_pppp_yyyy.nc4
where:
pppp is the respective Daymet input meteorological variable (tmax, tmin, and prcp)
yyyy is year.
Parameters included in all netCDF files
|
Parameter |
Abbr |
Units |
Description |
|---|---|---|---|
|
Station Identification |
station_id |
|
The ground weather station identification (as a string value) as extracted from the GHCN-Daily input files. |
|
Station Name |
station_name |
|
The ground weather station name (as a string value) as extracted from the GHCN-Daily input files. |
|
Station Elevation |
stnz |
meters |
The station elevation reported in the metadata readme as extracted from the GHCN-Daily input files. |
|
Days Since 1980-01-01 |
time |
day |
The day number since the beginning of the data set. Data are in a daily time step. |
|
Beginning/End of Time Range |
time_bnds |
day |
The start and end day number since the beginning of the data set (1980-01-01). |
|
Station Index |
stns |
|
A station index location within the netCDF file. |
|
Station Longitude |
stn_lon |
decimal degrees |
The station longitude reported in the metadata readme as extracted from the GHCN-Daily input files. |
|
Station Latitude |
snt_lat |
decimal degrees |
The station latitude reported in the metadata readme as extracted from the GHCN-Daily input files. |
Parameters specific to precipitation netCDF files
|
Parameter |
Abbr |
Units |
Description |
|---|---|---|---|
|
Observation |
obs |
cm/day |
Station observed daily total precipitation in centimeters per day, sum of all forms converted to water-equivalent. Precipitation occurrence on any given day may be ascertained. Data are in a daily time step. |
|
Predicted |
pred |
cm/day |
Daymet model predicted daily total precipitation in centimeters per day, sum of all forms converted to water-equivalent. Precipitation predicted occurrence on any given day may be ascertained. Data are in a daily time step. |
Parameters specific to maximum and minimum temperature netCDF files
|
Parameter |
Abbr |
Units |
Description |
|---|---|---|---|
|
Observation |
obs |
degrees C |
Station observed daily maximum (or minimum respective of file) 2-meter air temperature in degrees Celsius. Data are in a daily time step. |
|
Predicted |
pred |
degrees C |
Daymet model predicted daily maximum (or minimum respective of file) 2-meter air temperature in degrees Celsius. Data are in a daily time step. |
Version Information
The data are stored and distributed as an individual CF-Compliant netCDF file for each year and variable. The most current Daymet data are being delivered to the user in both Daymet software and Daymet data versions. Version information is recorded in the header file of each of the CF-netCDF files within the Global Attribute fields; Version_software and Version_data. All Daymet data are provisional and subject to revision.
The Daymet Calendar
The Daymet calendar is based on a standard calendar year. All Daymet years, including leap years, have 1 - 365 days. For leap years, the Daymet database includes leap day. Values for December 31 are discarded from leap years to maintain a 365-day year
Companion Files:
*.csv Files
There are 120 comma separated value (.csv) files that contain metadata information for every surface weather station included in the corresponding netCDF files for each variable and year data file. Each file represents a separate variable-year combination.
Fields in the .csv files
| Parameter | Abbr | Units | Description |
|---|---|---|---|
| Station Identification | stn_id | The ground weather station identification (as a string value) as extracted from the GHCN-Daily input files. | |
| Station Name | stn_name | The ground weather station name (as a string value) as extracted from the GHCN-Daily input files. | |
| Station Longitude | stn_lat | decimal degrees | The station latitude reported in the metadata readme as extracted from the GHCN-Daily input files. |
| Station Latitude | snt_lon | decimal degrees | The station longitude reported in the metadata readme as extracted from the GHCN-Daily input files. |
R code
An R script is provided to read the netCDF files and extract information on the goodness-of-fit of the modeled data to the observed station data.
The R script is: crossValPlots.R
Script input: Required: the variable and year of interest must be specified in line 11 of the script. Optional: the specific station of interest may be provided in line 13.
Script outputs:
Example output plots and statistics data files are listed in the table below and are provided as companion files. These example files were generated from the netCDF file daymet_v3_stnsxval_tmax_2016.nc4. The station-level observed vs. predicted plot example is for station identification value USC00145363.
|
|
Output |
Companion file name |
|---|---|---|
|
1 |
Plot of observed vs. predicted values for a single station of interest |
tmax_2016_station_USC00145363.png |
|
2 |
Plot of R-squared values for each station |
tmax_2016_Rsquared.png |
|
3 |
Plot of mean absolute error (MAE) values for each station |
tmax_2016_MAE.png |
|
4 |
Map of all stations colored by R-squared values |
tmax_2016_Rsquared_map.png |
|
5 |
Map of all stations colored by MAE value |
tmax_2016_MAE_map.png |
|
6 |
A *.csv file containing the station_IDs, latitude and longitude, R-squared value of the observed vs. predicted, and mean absolute error for each station |
Daymet_V3_tmax_2016.csv |
Application and Derivation
The Daymet station-level cross validation data can provide insight into the regional accuracy of the Daymet model performance for the three station observation input parameters of maximum and minimum temperature and precipitation. Regression and mean absolute error over temporal and spatial patterns can be analyzed. Weather station contribution, distribution, density, and availability can be ascertained on a yearly basis.
Overall, the Daymet data have broad applications over a wide variety of research fields including hydrology, terrestrial vegetation growth models, carbon cycle science, and regional to large scale climate change analysis. Measurements of near-surface meteorological conditions are made at many locations, but researchers are often faced with having to perform ecosystem process simulations in areas where no meteorological measurements have been taken. The continuous gridded surfaces of the Daymet data set were developed to overcome these limitations.
Quality Assessment
Within the Daymet model algorithm, the Daymet cross-validation analyses were used to test the sensitivity of Daymet model methods to the variation of parameters and to estimate the prediction errors associated with the final selected parameters. The general cross-validation protocol is to withhold one observation at a time from a sample, generate a prediction error for the withheld case by comparison with observed values within the sample, and repeating over all observations in the sample to generate an average prediction error. The sample in this case was derived from the distribution of nearby stations based on the moving Gaussian distribution of stations for TMAX, TMIN, or PRCP on a given day. Interest is in both the absolute value and the sign of prediction errors generated in this manner.
Daymet cross-validation may also be examined at the 2-degree x 2-degree tile resolution. Those data are provided in a separate data set (Daymet: Annual Tile Summary Cross-Validation Statistics for North America, Version 3. https://doi.org/10.3334/ORNLDAAC/1348 )
Data Acquisition, Materials, and Methods
Daymet Version 3.0 Model Inputs
The surface weather observations provided here are the input used for processing "Daymet: Daily Surface Weather Data on a 1-km Grid for North America, Version 3" (Thornton et al., 2016), and were obtained from the NOAA National Centers for Environmental Information's Global Historical Climatology Network (GHCN)-Daily data set (Menne et al., 2012).
The sparse network of Mexican stations available through the GHCN-Daily network was augmented with additional stations provided by the Servicio Meteorológico Nacional of Mexico for years 1980 - 2012. These data were obtained through an agreement with NOAA/GHCN-Daily in which GHCN-D acquired the station data directly from the Servicio Meteorológico Nacional and processed this data through the same QA/QC measures as all GHCN-D data is subject ensuring credibility to the data provenance of these additional data. The additional Mexican data were then provided to the NASA Daymet processing group. After year 2012, Mexican stations consist of those routinely available through GHCN-D data collections.
GHCN-Daily Version Download Dates:
- Daymet for years 1980 - 2014 used GHCN-D data set version 3.22 downloaded on September 16, 2015.
- Daymet for year 2015 used GHCN-D data set version 3.22 downloaded on February 29, 2016.
- Daymet for year 2016 used GHCN-D data set version 3.22 downloaded on March 13, 2017.
- Daymet for year 2017 used GHCN-D data set version 3.23 downloaded on February 6, 2018.
- Daymet for year 2018 used GHCN-D data set version 3.25 downloaded on March 18, 2019.
- Daymet for year 2019 used GHCN-D data set version 3.27 downloaded on February 16, 2020.
Daymet Algorithm
The set of ground surface observation stations that are input for the interpolation methods is collected from the heterogeneously spaced stations of the input data from three separate input files of minimum temperature, maximum temperature, and precipitation. The interpolation method at each prediction point is accomplished through an iterative estimation of local station density using the spatial convolution of a truncated Gaussian filter as further described in Thornton et al., (1997). In it, a system is established in which the search radius of stations is reduced in data-rich regions and increased in data-poor regions. This is accomplished by specifying an average number of observations to be included at each point. The search distance of stations is then varied as a smooth function of the local station density. The result is a seamless match of gridded daily data for adjacent tiles. In the Daymet algorithm, spatially and temporally explicit empirical analyses of the relationships of temperature and precipitation to elevation are performed. In addition, a daily precipitation occurrence algorithm is introduced, as a precursor to the prediction of daily precipitation amount.
Daily Predicted Values
Daily predicted values for tmin, tmax, and prcp reported in this data set are generated by the Daymet model algorithm. The protocol is to withhold one daily station observation at a time from the sample, and generate a daily prediction for the withheld station. Where the sample is composed of observations from the model-specified number of neighboring stations (Thornton et al.1997).
Data Access
These data are available through the Oak Ridge National Laboratory (ORNL) Distributed Active Archive Center (DAAC).
Daymet: Station-Level Inputs and Model Predicted Values for North America, Version 3
Contact for Data Center Access Information:
- E-mail: uso@daac.ornl.gov
- Telephone: +1 (865) 241-3952
References
Menne, M.J., I. Durre, R.S. Vose, B.E. Gleason, and T.G. Houston, 2012: An overview of the Global Historical Climatology Network-Daily Database. Journal of Atmospheric and Oceanic Technology, 29, 897-910, http://doi.org/10.1175/JTECH-D-11-00103.1
Menne, M.J., I. Durre, B. Korzeniewski, S. McNeal, K. Thomas, X. Yin, S. Anthony, R. Ray, R.S. Vose, B.E.Gleason, and T.G. Houston, 2012: Global Historical Climatology Network - Daily (GHCN Daily), Version 3.22 NOAA National Climatic Data Center. http://doi.org/10.7289/V5D21VHZ
Thornton, P.E., S.W. Running, and M.A. White. 1997. Generating surfaces of daily meteorological variables over large regions of complex terrain. Journal of Hydrology 190: 214 - 251. http://dx.doi.org/10.1016/S0022-1694(96)03128-9
Thornton, P.E., M.M. Thornton, B.W. Mayer, Y. Wei, R. Devarakonda, R.S. Vose, and R.B. Cook. 2016. Daymet: Daily Surface Weather Data on a 1-km Grid for North America, Version 3. http://dx.doi.org/10.3334/ORNLDAAC/1328
Thornton, P.E., M.M. Thornton, and R.S. Vose. 2016. Daymet: Annual Tile Summary Cross-Validation Statistics for North America, Version 3. ORNL DAAC, Oak Ridge, Tennessee, USA. https://doi.org/10.3334/ORNLDAAC/1348
Dataset Revisions
Note: The ORNL DAAC revised its methods for versioning datasets to be more consistent with data versioning practices at the NASA Earth Science Data and Information System (ESDIS) and the general Earth Science data community. With the revised versioning strategy, the dataset version number (including both major and minor version numbers) remain unchanged when a release only appends new data and existing data are not changed. At the time of publication of 2023 Daymet data, the version numbers of Daymet datasets, including the Version 4 and prior versions are updated as shown in the revision tables below.
ORNL DAAC Release Record for Version 3
|
ORNL DAAC Release Date
|
Daymet Product Version | Description |
|---|---|---|
| March 31, 2020 | Version 3 | This release added Station-Level Inputs and Model Predicted Values for North America for year 2019. |
| April 8, 2019 | This release added Station-Level Inputs and Model Predicted Values for North America for year 2018. | |
| July 6, 2018 | This release added Station-Level Inputs and Model Predicted Values for North America for year 2017. | |
| May 25, 2017 | This release added daily gridded mosaics for 2016 for each Daymet Version 3 variable. |