Documentation Revision Date: 2019-04-26
Dataset Version: 1
Summary
There are 7 data files in GeoTIFF (.tif) format, including estimated mean and standard deviation of forest aboveground biomass (Mg/ha) for three focal sites, and predicted forest aboveground biomass for the entire Paragominas municipality.
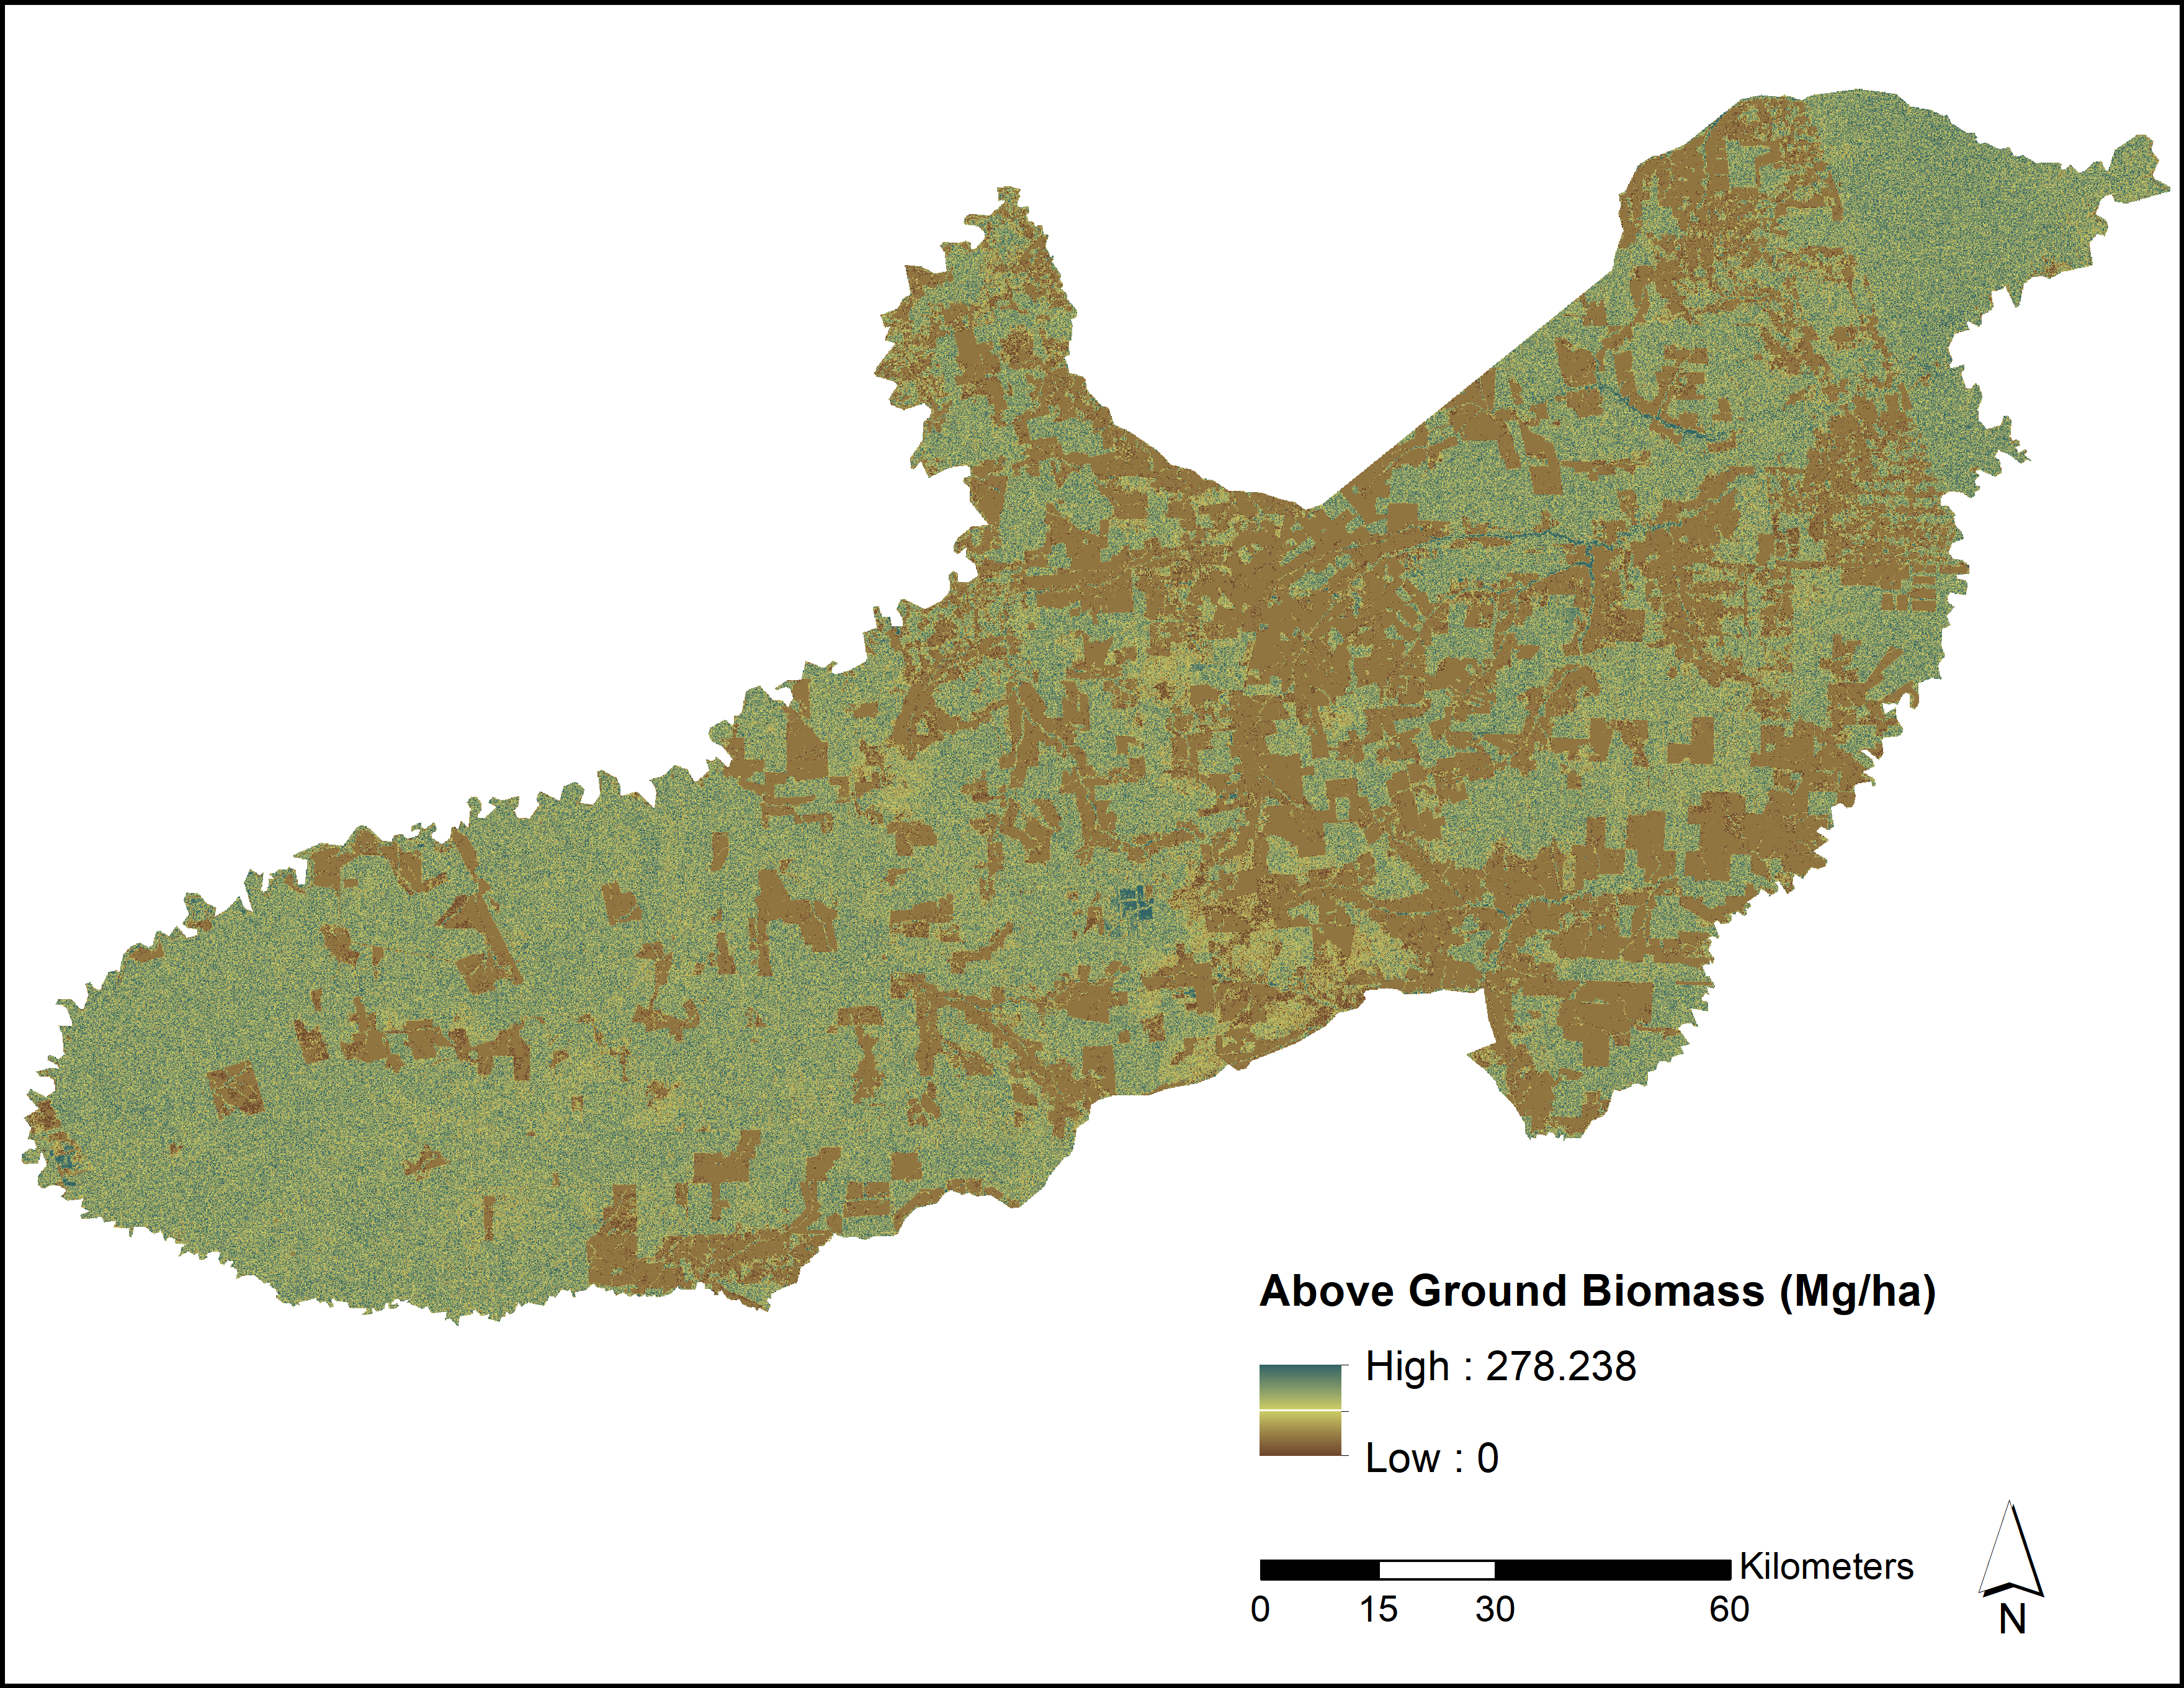
Figure 1. Assimilated predictions of forest aboveground biomass (megagrams of carbon per hectare) across the Paragominas Municipality, Brazil. (Source file: paragominas_predicted_agb.tif)
Citation
Keller, M.M., P. Duffy, and W. Barnett. 2019. LiDAR and PALSAR-Derived Forest Aboveground Biomass, Paragominas, Para, Brazil, 2012. ORNL DAAC, Oak Ridge, Tennessee, USA. https://doi.org/10.3334/ORNLDAAC/1648
Table of Contents
- Dataset Overview
- Data Characteristics
- Application and Derivation
- Quality Assessment
- Data Acquisition, Materials, and Methods
- Data Access
- References
Dataset Overview
This dataset provides estimates of forest aboveground biomass for three study areas and the entire Paragominas municipality, in Para, Brazil, in 2012. Aboveground biomass (in megagrams of carbon per hectare) was measured for inventory plots within the study (focal) areas, and then assimilated and modeled with LiDAR and PALSAR metrics using gradient boosting machines (GBM) to predict spatially explicit forest aboveground biomass and uncertainties for the entire focal areas. The PALSAR data across the three focal areas was combined and used in a GBM model to predict forest aboveground biomass across the entire Paragominas municipality.
Project: Carbon Monitoring System
The NASA Carbon Monitoring System (CMS) is designed to make significant contributions in characterizing, quantifying, understanding, and predicting the evolution of global carbon sources and sinks through improved monitoring of carbon stocks and fluxes. The System will use the full range of NASA satellite observations and modeling/analysis capabilities to establish the accuracy, quantitative uncertainties, and utility of products for supporting national and international policy, regulatory, and management activities. CMS will maintain a global emphasis while providing finer scale regional information, utilizing space-based and surface based data and will rapidly initiate generation and distribution of products both for user evaluation and to inform near-term policy development and planning.
Related Datasets:
dos-Santos, M.N., and M.M. Keller. 2016. CMS: Forest Inventory and Biophysical Measurements, Para, Brazil, 2012-2014. ORNL DAAC, Oak Ridge, Tennessee, USA. https://doi.org/10.3334/ORNLDAAC/1301
dos-Santos, M.N., and M.M. Keller. 2016. CMS: LiDAR Data for Forested Areas in Paragominas, Para, Brazil, 2012-2014. ORNL DAAC, Oak Ridge, Tennessee, USA. https://doi.org/10.3334/ORNLDAAC/1302
Acknowledgments:
This work was funded by NASA CMS grant NNH13ZDA001N.
Data Characteristics
Spatial Coverage: Paragominas Municipality, Para, Brazil
Spatial Resolution: 50 m, 100 m
Temporal Coverage: 2012-01-01 to 2013-12-31
Temporal Resolution: one time estimate
Study Area: (all latitudes and longitudes given in decimal degrees)
| Site | Westernmost Longitude |
Easternmost Longitude |
Northernmost Latitude |
Southernmost Latitude |
|---|---|---|---|---|
| Fazenda Andiroba (AND) | -46.84606389 | -46.82801944 | -2.531908333 | -2.577147222 |
| Fazenda Cauaxi (CAU) | -48.49631111 | -48.46831389 | -3.730113889 | -3.767252778 |
| Fazenda Nova Neonita (PAR) | -47.55837222 | -47.51065 | -3.306158333 | -3.329777778 |
| Paragominas, Brazil | -49.00363333 | -45.99809722 | -1.99755 | -4.006052778 |
Data File Information
There are 7 data files in GeoTIFF (.tif) format. Files are listed in the table below. Aboveground biomass data are provided in units of megagrams of carbon per hectare (Mg/ha)
| File name | Number of files | Description |
|---|---|---|
| site_predicted_agb_mean.tif | 3 | Mean predicted aboveground biomass across each of three focal sites ('and', 'cau', or 'par') using LiDAR and PALSAR metrics |
| site_predicted_agb_sd.tif | 3 | Standard deviation of the predicted aboveground biomass across each of three focal sites ('and', 'cau', or 'par') using LiDAR and PALSAR metrics |
| paragominas_predicted_agb.tif | 1 | Predicted aboveground biomass across the entire Paragominas municipality using PALSAR focal site metrics |
Data File Properties: The no data value for all files is -99999. There is one data band in each file.
| File names | Projection | Grid size | Columns | Rows |
|---|---|---|---|---|
| and_predicted_agb_mean.tif & and_predicted_agb_sd.tif | WGS 84 UTM Zone 23S | 100 meters | 20 | 50 |
| cau_predicted_agb_mean.tif & cau_predicted_agb_sd.tif | WGS 84 UTM Zone 22S | 100 meters | 31 | 41 |
| par_predicted_agb_mean.tif & par_predicted_agb_sd.tif | WGS 84 UTM Zone 23S | 100 meters | 53 | 26 |
| paragominas_predicted_agb.tif | WGS 84 | 0.000902292 degrees (50 m) | 3331 | 2226 |
Application and Derivation
Brazilian tropical forests contain approximately one-third of the global carbon stock in aboveground tropical forest biomass. This dataset can be used to monitor carbon stock changes and associated uncertainties for the Paragominas municipality, a jurisdiction in the eastern Brazilian Amazon with a high proportion of logged and burned degraded forests.
Quality Assessment
The assimilated data products at each of the three focal sites received estimates of uncertainty using a Bayesian hierarchical model, but the estimates are not provided in this dataset.
Data Acquisition, Materials, and Methods
Focal Site Analysis
Field data were collected from inventory plots at each of three focal sites in the Paragominas municipality of Brazil. Aboveground biomass (in megagrams of carbon per hectare) was estimated from inventory plot tree species, tree basal area, tree diameter at breast height, etc. Some of these measurement data are available in a related dataset: https://doi.org/10.3334/ORNLDAAC/1301.
The number of inventory plots for each focal site are:
| Focal site | Plots | Size |
|---|---|---|
| AND | 20 | 50 m x 50 m |
| CAU | 88 | 20 m x 125 m |
| PAR | 40 | 20 m x 125 m |
Additional data for each focal site, including LiDAR data are available in a related dataset: http://dx.doi.org/10.3334/ORNLDAAC/1302 .
Since the inventory plot sizes varied from the LiDAR and PALSAR grid cells, inventory plot data were processed to be 2,500 m2. Processing began by calculating an area-weighted average of each LiDAR metric. For instance, if a 20 m x 125 m inventory plot overlapped with six 50 m x 50 m LiDAR cells, the average of a particular LiDAR metric was computed using the weights implied by the relative proportions of the six overlapping LiDAR cells. PALSAR polarizations were used to calculate 10th, 50th, and 90th percentiles inside each inventory plot polygon using the same routine.
The data from the inventory plots were aggregated from 50 m to 100 m resolution to mitigate computational convergence issues during the Bayesian analysis. The resultant data included the following information for each inventory plot:
- inventory plot identification number
- spatial polygon size
- inventory data (aboveground biomass estimate)
- LiDAR 10th, 50th, and 90th percentile metrics and skew metrics for return height
- PALSAR 10th, 50th, and 90th percentile metrics for HH and HV polarizations
For each focal site analysis, the inventory data were modeled using gradient boosting machines (GBM) and the LiDAR and PALSAR metrics (75% training data, 25% test data) to predict aboveground biomass across the focal areas. The predictions were assimilated with the GBM test data using the Wikle and Berliner (2007) Hierarchical Bayesian Modeling approach.
Paragominas Analysis
To estimate aboveground biomass across the entire Paragominas municipality, the PALSAR metrics were used as model predictors. PALSAR data were combined across the focal areas, and a predictive GBM model was developed (90% training data, 10% test data) using the 10th, 50th, and 90th percentiles of the HH and HV PALSAR metrics. The input data and resultant prediction map are at 50 m resolution. LiDAR data are typically very precise, but also expensive to collect. Radar data, such as PALSAR, are often cheaper and more widely available.
Data Access
These data are available through the Oak Ridge National Laboratory (ORNL) Distributed Active Archive Center (DAAC).
LiDAR and PALSAR-Derived Forest Aboveground Biomass, Paragominas, Para, Brazil, 2012
Contact for Data Center Access Information:
- E-mail: uso@daac.ornl.gov
- Telephone: +1 (865) 241-3952
References
Wikle, C.K. and Berliner, L.M., 2007. A Bayesian tutorial for data assimilation. Physica D: Nonlinear Phenomena, 230(1-2), pp.1-16.