Documentation Revision Date: 2020-01-16
Dataset Version: 1
Summary
The DLEM 2.0 was driven by three downscaled general circulation models (GCM) and scenarios for land use and atmospheric CO2 concentration to predict changes in future riverine DIC fluxes. To maintain consistency with model products for the historical/contemporary period (1992–2010), the input data were statistically downscaled to a resolution of 5 arc min. Historical simulations produced by the DLEM before 2010 were used to evaluate model performances.
There are 13 data files in GeoTIFF format (.tif) which provide the spatial distribution of historical estimates of carbon and nitrogen leaching and future estimates of carbon estimates, and three files in comma-separated (.csv) format with estimated carbon and nitrogen MRB exports and river discharge data.
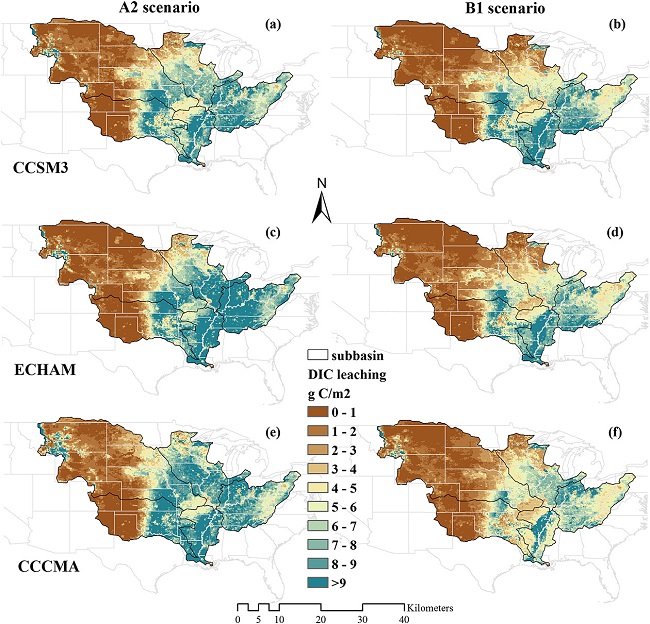
Figure 1. Spatial distribution of mean dissolved inorganic carbon (DIC) leaching (g c/m2/yr) in the 2090s estimated by S(ALL) simulation experiment (including future climate, elevated CO2, and land use changes). Climate change scenarios were derived from three climate models named CCSM3 (panels a and b), ECHAM (c and d), and CCCMA (e and f) under high (A2) and low (B1) emission scenarios, respectively. From Ren et al. (2015).
Citation
Tian, H., S.E. Lohrenz, S. Pan, W.J. Cai, and R. He. 2019. Export and Leaching of Carbon and Nitrogen from Mississippi River Basin, 1901-2099. ORNL DAAC, Oak Ridge, Tennessee, USA. https://doi.org/10.3334/ORNLDAAC/1699
Table of Contents
- Dataset Overview
- Data Characteristics
- Application and Derivation
- Quality Assessment
- Data Acquisition, Materials, and Methods
- Data Access
- References
Dataset Overview
This dataset provides estimates for export and leaching of dissolved inorganic carbon (DIC), dissolved organic carbon (DOC), total organic carbon (TOC), particulate organic carbon (POC), ammonium (NH4+), nitrate (NO3-), and total organic nitrogen (TON) from the Mississippi River Basin (MRB) to the Gulf of Mexico. The estimates are provided for a historical period of 1901-2014, and a future period of 2010-2099 (carbon estimates only) under two scenarios of high and low levels of population growth, economy, and energy consumption, respectively. The estimates are from the Dynamic Land Ecosystem Model 2.0 (DLEM 2.0). These data are applicable to studying how changes in multiple environmental factors (e.g., fertilizer application, land-use changes, climate variability, atmospheric CO2 and N deposition) affect the dynamics of leaching and export to the Gulf of Mexico.
The DLEM 2.0 was driven by three downscaled general circulation models (GCM) and scenarios for land use and atmospheric CO2 concentration to predict changes in future riverine DIC fluxes. To maintain consistency with model products for the historical/contemporary period (1992–2010), the input data were statistically downscaled to a resolution of 5 arc min. Historical simulations produced by the DLEM before 2010 were used to evaluate model performances.
Project: Carbon Monitoring System (CMS)
The NASA Carbon Monitoring System (CMS) is designed to make significant contributions in characterizing, quantifying, understanding, and predicting the evolution of global carbon sources and sinks through improved monitoring of carbon stocks and fluxes. The System will use the full range of NASA satellite observations and modeling/analysis capabilities to establish the accuracy, quantitative uncertainties, and utility of products for supporting national and international policy, regulatory, and management activities. CMS will maintain a global emphasis while providing finer scale regional information, utilizing space-based and surface-based data and will rapidly initiate generation and distribution of products both for user evaluation and to inform near-term policy development and planning.
Related Publications:
Ren, W., H. Tian, B. Tao, J. Yang, S. Pan, W.-J. Cai, S. E. Lohrenz, R. He, and C. S. Hopkinson. (2015). Large increase in dissolved inorganic carbon flux from the Mississippi River to Gulf of Mexico due to climatic and anthropogenic changes over the 21st century. J. Geophys. Res. Biogeosci., 120, 724-736, https://doi.org/10.1002/2014JG002761
Tao, B., H. Tian, W. Ren, J. Yang, Q. Yang, R. He, W. Cai, and S. Lohrenz. (2014). Increasing Mississippi river discharge throughout the 21st century influenced by changes in climate, land use, and atmospheric CO2. Geophys. Res. Lett., 41, 4978?4986, https://doi.org/10.1002/2014GL060361.
Tian, H., R. Xu, S. Pan, Y. Yao, W.-J. Cai, C. Hopkinson, D. Justic, S. E. Lohrenz, C. Lu, W. Ren, and J. Yang, Quantifying and attributing nitrogen delivery from the Mississippi- Atchafalaya River basin to the Gulf of Mexico since 1900. Global Biogeochemical Cycle. in review
Acknowledgement:
This study was supported by NASA’s Carbon Monitoring System Program under grant numbers NNX12AP84G, NNX14AO73G, and NASA Interdisciplinary Science Program grant number NNX10AU06G.
Data Characteristics
Spatial Coverage: Mississippi River Basin
Spatial Resolution: Carbon data are 5 arc minute; nitrogen data are 7.5 arc minute
Temporal Coverage: 1901-01-01 – 2099-12-31
Temporal Resolution: Annual
Study Area: (all latitudes and longitudes given in decimal degrees)
|
Site |
Westernmost Longitude |
Easternmost Longitude |
Northernmost Latitude |
Southernmost Latitude |
|---|---|---|---|---|
|
Mississippi River basin |
-126 |
-62 |
53.00 |
24.5 |
Data File Information
There are 16 data files with this dataset. This includes 13 files in GeoTIFF (.tif) format and three files in comma-separated format (.csv). The csv files provide estimates for river discharge and exports at the outlet of the Mississippi River Basin to the Gulf of Mexico.
Table 1. File names and descriptions
| File names | Units | Description |
|---|---|---|
| Historical Nitrogen Leaching | ||
| MRB_N_Hist_7p5arcmin_leachNH4.tif | g N/m2 | Estimates/spatial distribution for the period 1901-2014 for NH4 leaching from land at a resolution of 7.5 arc minutes |
| MRB_N_Hist_7p5arcmin_leachNO3.tif | g N/m2 | Estimates/spatial distribution for the period 1901-2014 for NO3 leaching from land at a resolution of 7.5 arc minutes |
| MRB_N_Hist_7p5arcmin_leachTON.tif | g N/m2 | Estimates/spatial distribution for the period 1901-2014 for total organic nitrogen (TON) leaching from land at a resolution of 7.5 arc minutes |
| Historical Carbon Leaching | ||
| MRB_C_Hist_5arcmin_leachTOC.tif | g C/m2 | Estimates/spatial distribution for the period 1901-2010 for total organic carbon (TOC) leaching from land at a resolution of 5 arc minutes |
| MRB_C_Hist_5arcmin_leachPOC.tif | g C/m2 | Estimates/spatial distribution for the period 1901-2010 for particulate organic carbon (POC) leaching from land at a resolution of 5 arc minutes |
| MRB_C_Hist_5arcmin_leachDOC.tif | g C/m2 | Estimates/spatial distribution for the period 1901-2010 for dissolved organic carbon (DOC) leaching from land at a resolution of 5 arc minutes |
| MRB_C_Hist_5arcmin_leachDIC.tif | g C/m2 | Estimates/spatial distribution for the period 1901-2010 for dissolved inorganic carbon ( DIC) leaching from land at a resolution of 5 arc minutes |
| Future estimates: The files below provide the future estimates of dissolved inorganic carbon (DIC) leaching from land from three Models for two scenarios (six combinations). A2 and B1 represent scenarios of high and low levels of population growth, economy, and energy consumption, respectively | ||
| MRB_C_Future_M3_B1_leachDIC.tif | g C/m2 | Estimates/spatial distribution of DIC leaching from land for the period 2010-2099 from the M3 B1 scenario |
| MRB_C_Future_M3_A2_leachDIC.tif | g C/m2 | Estimates/spatial distribution of DIC leaching from land for the period 2010-2099 from the M3 A2 scenario |
| MRB_C_Future_M2_B1_leachDIC.tif | g C/m2 | Estimates/spatial distribution of DIC leaching from land for the period 2010-2099 from the M2 B1 scenario |
| MRB_C_Future_M2_A2_leachDIC.tif | g C/m2 | Estimates/spatial distribution of DIC leaching from land for the period 2010-2099 from the M2 A2 scenario |
| MRB_C_Future_M1_B1_leachDIC.tif | g C/m2 | Estimates/spatial distribution DIC leaching from land for the period 2010-2099 from the M1 B1 scenario |
| MRB_C_Future_M1_A2_leachDIC.tif | g C/m2 | Estimates/spatial distribution of DIC leaching from land for the period 2010-2099 from the M1A2 scenario |
| CSV files | ||
| MRB_N_exports_discharge_1901_2014_125.csv | details in Table 2 | Estimates for the period 1901-2014 for river discharge, NH4, NO3, and total organic nitrogen (ton) exports |
| MRB_C_exports_discharge_2010_2099_5arcmin.csv | details in Table 3 | Estimates for river discharge and DIC export for the period 2010-2099. The estimates were produced by 3 models for two scenarios of high and low levels of population growth, economy, and energy consumption, respectively. |
| MRB_C_exports_discharge_1901_2010_5arcmin.csv | details in Table 4 | Estimates for the period 1901-2010 for exports and river discharge of particulate organic carbon (X=POC), dissolved organic carbon (X= DOC), and dissolved inorganic carbon (X= DIC) |
Properties of the GeoTIFF files
Datum: WGS 1984, EPSG: 4326
Map units: degree
Native datatype: Float 32
No data/missing data value: -9999
Scaling: 1
Spatial resolution of carbon data files: 0.08333 degrees
Spatial resolution of nitrogen data files: 0.125 degrees
Table 2. Variables in the file MRB_N_exports_discharge_1901_2014_125.csv
|
Variable name |
Units |
Description |
|
year |
YYYY |
Year of data estimates |
|
nh4 |
Gg /yr |
Estimated nitrogen export as NH4 at the outlet of the MRB basin for the period 1901-2014 |
|
no3 |
Gg /yr |
Estimated nitrogen export as NO3 at the outlet of the MRB basin for the period 1901-2014 |
|
ton |
Gg /yr |
Estimated total organic nitrogen export at the outlet of the MRB basin for the period 1901-2014 |
|
river_discharge |
km3/yr |
Estimated river discharge at the outlet of the MRB basin for the period 1901-2014 |
|
max_latitude |
Decimal degrees |
Northernmost latitude of study area |
|
min_latitude |
Decimal degrees |
Southernmost latitude of study area |
|
max_longitude |
Decimal degrees |
Easternmost longitude of study area |
|
min_longitude |
Decimal degrees |
Westernmost longitude of study area |
Table 3. Variables in the file MRB_C_exports_discharge_2010_2099_5arcmin.csv
This file provides estimates of river water discharge, and DIC exports from the Mississippi River Basin to the Gulf of Mexico for the period 2010-2099 produced by 3 models for two scenarios, A1 or A2 or B1 or B2. A2 and B1 represent scenarios of high and low levels of population growth, economy, and energy consumption, respectively.
|
Variable |
Unit |
Description |
|---|---|---|
|
year |
YYYY |
Year of estimate |
|
m1_a2_discharge |
km3/yr |
Estimated discharge under the M1-A2 scenario |
|
m1_b1_discharge |
km3/yr |
Estimated discharge under the M1-B1 scenario |
|
m2_a2_discharge |
km3/yr |
Estimated discharge under the M2-A2 scenario |
|
m2_b1_discharge |
km3/yr |
Estimated discharge under the M2-B1 scenario |
|
m3_a2_discharge |
km3/yr |
Estimated discharge under the M3-A2 scenario |
|
m3_b1_discharge |
km3/yr |
Estimated discharge under the M3-B1 scenario |
|
m1_a2_export |
Gg/yr |
Estimated exports of DIC under the M1-A2 scenario |
|
m1_b1_ export |
Gg/yr |
Estimated exports of DIC under the M1-B1 scenario |
|
m2_a2_ export |
Gg/yr |
Estimated exports of DIC under the M2-A2 scenario |
|
m2_b1_ export |
Gg/yr |
Estimated exports of DIC under the M2-B1 scenario |
|
m3_a2_ export |
Gg/yr |
Estimated exports of DIC under the M3-A2 scenario |
|
m3_b1_ export |
Gg/yr |
Estimated exports of DIC under the M3-B1 scenario |
|
max_latitude |
Decimal degrees |
Northernmost latitude of study area |
|
min_latitude |
Decimal degrees |
Southernmost latitude of study area |
|
max_longitude |
Decimal degrees |
Easternmost longitude of study area |
|
min_longitude |
Decimal degrees |
Westernmost longitude of study area |
Table 4. Variables in the file MRB_C_exports_discharge_1901_2010_5arcmin.csv
|
Variable name |
Units |
Description |
|
year |
YYYY |
Year of data estimates |
|
doc_export |
Gg/yr |
Estimated exports of dissolved organic C (DOC) at the outlet of the MRB basin for the period 1901-2010 |
|
poc_export |
Gg /yr |
Estimated exports of particulate organic C (POC) at the outlet of the MRB basin for the period 1901-2010 |
|
dic_export |
Gg /yr |
Estimated exports of dissolved inorganic C (DIC) at the outlet of the MRB basin for the period 1901-2010 |
|
river_discharge |
km3/yr |
Estimated river discharge at the outlet of the MRB basin for the period 1901-2010 |
|
max_latitude |
Decimal degrees |
Northernmost latitude of study area |
|
min_latitude |
Decimal degrees |
Southernmost latitude of study area |
|
max_longitude |
Decimal degrees |
Easternmost longitude of study area |
|
min_longitude |
Decimal degrees |
Westernmost longitude of study area |
Application and Derivation
This study explored how changes in multiple environmental factors would affect river discharge and uncertainties associated with climate models, emission scenarios, and process representation in ecosystem modeling. It demonstrates the importance of land use change and atmospheric CO2 concentrations in projecting future hydrologic processes (Tao et al., 2014).
Quality Assessment
There were large differences in projected magnitude of DIC fluxes between high and low emission scenarios. Moreover, it can be anticipated that the simulations of DIC export produced in this study may be subject to modification as new emission scenarios are generated.
Simplified processes in the DLEM as well as in other models may introduce additional uncertainty in estimate of DIC fluxes. Model representation of in-stream processes of the nitrogen cycle is overly simplified. Refer to Ren et al. (2015) for additional information.
Data Acquisition, Materials, and Methods
Study area
The Mississippi River has the third largest drainage basin in the world, over 3.2 × 10⁶ km2 in size and constitutes nearly 80% of the United States freshwater discharge into the Gulf of Mexico. Parts or all of 31 states plus two Canadian provinces drain into the Mississippi River, totaling 48% of the contiguous United States. Along with being the largest U.S. drainage basin, the Mississippi also constitutes borders for 10 states. The major subbasins in the Mississippi River basin include Upper/Lower Mississippi, Upper/Lower Missouri, Upper/Lower Ohio, Arkansas, and Red and Ouachita. The Mississippi River basin covers a wide range of climatic and topographic regimes across the United States, ranging from mesic temperate forests in the east to dry shrublands and irrigated agriculture in the west. Roughly 30% of the basin is currently covered in croplands (Foley et al., 2013).
Model datasets
The DLEM 2.0 driven by downscaled general circulation model (GCM) climate scenarios as well as scenarios for land use and atmospheric CO2 concentration, was used to predict changes in future riverine DIC fluxes from the Mississippi River to the Gulf of Mexico during 2010–2099.
Scenarios for the model simulations were constructed for climate, land use, and atmospheric CO2 data that were consistent with Intergovernmental Panel on Climate Change (IPCC) SRES A2 and B1 assumptions. A2 and B1 scenarios represent high and low levels of population growth, economy, and energy consumption, respectively, and therefore are on opposite ends of the spectrum regarding projected temperature and atmospheric CO2 concentration increase. Projected future climate data were adapted from three GCMs, Community Climate System Model version 3.0 (CCSM3), European Centre/Hamburg (ECHAM), and Canadian Centre for Climate Modelling and Analysis (CCCMA)). The daily simulated climate variables included minimum temperature, maximum temperature, and precipitation. To maintain consistency with model products for the historical/contemporary period (1992–2010), the input data were statistically downscaled to a resolution of 5 arc min. The projected CO2 concentrations under the A2 and B1 scenarios were derived from the IPCC Data Distribution Center (http://www.ipcc-data.org/observ/ddc_co2.html). Spatially explicit land use databases from 1992 to 2099 under the A2 and B1 scenarios were derived from the Forecasting Scenarios of Future Land Cover (FORE-SCE) model (Sohl et al., 2012).
Other data sets, including historical nitrogen deposition, tropospheric ozone, land management practices (e.g., rotation, harvest, nitrogen fertilization, and irrigation), river network, soil, and topographic layer, were consistent with our previous work (Liu et al., 2013; Tian et al., 2010; Xu et al., 2012).
Model simulations
Three types of simulations were examined. The first type (SALL, six simulations) examined responses of DIC export to all simulated future environmental changes including climate, CO2, and land use under the two emission scenarios. The second type (SClimate + LUC, SClimate + CO2, and SCO2 + LUC) considered the combined effects of two factors at a time. In those simulations, two driving factors were allowed to change over time while holding the third one constant at an initial baseline level. The third type of simulation experiment (SClimate, SLUC, and SCO2) examined responses of DIC export to single factor impacts, such that only one factor was allowed to change over time while the other two factors were held constant.
All simulations began with an equilibrium run, in which all other environmental conditions except climate are held to those for the year of 1991, including land use, atmospheric CO2 concentration, and nitrogen deposition, nitrogen fertilizer rate, while the average between 1991 and 2010 was used for climate conditions. Three spin-ups over the 20-year period (1991–2010) were made to reduce the biases in the transient runs, and the model was then run using the time series of input data sets for the different combination of scenarios described previously. Historical simulations before 2010 were used to evaluate model performances.
Refer to Ren et al., 2015 and Tao et al., 2014 for additional details.
Data Access
These data are available through the Oak Ridge National Laboratory (ORNL) Distributed Active Archive Center (DAAC).
Export and Leaching of Carbon and Nitrogen from Mississippi River Basin, 1901-2099
Contact for Data Center Access Information:
- E-mail: uso@daac.ornl.gov
- Telephone: +1 (865) 241-3952
References
Foley, J.A., C.J. Kucharik, T.E. Twine, M.T. Coe, and S.D. Donner. (2013). Land use, land cover, and climate change across the Mississippi basin: Impacts on selected land and water resources, in Ecosystems and Land Use Change, edited by R. DeFries, G. Asner, and R. Houghton, pp. 249– 261, AGU, Washington, D. C., https://doi.org/10.1029/153GM19.
Liu, M., H. Tian, Q. Yang, J. Yang, X. Song, S.E. Lohrenz, and W. Cai. (2013). Long-term trends in evapotranspiration and runoff over the drainage basins of the Gulf of Mexico during 1901–2008, Water Resour. Res., 49, 1988– 2012, https://doi.org/10.1002/wrcr.20180
Ren, W., H. Tian, B. Tao, J. Yang, S. Pan, W.-J. Cai, S.E. Lohrenz, R. He, and C.S. Hopkinson. (2015). Large increase in dissolved inorganic carbon flux from the Mississippi River to Gulf of Mexico due to climatic and anthropogenic changes over the 21st century,J. Geophys. Res. Biogeosci., 120, 724-736, https://doi.org/10.1002/2014JG002761.
Sohl, T., B.M. Sleeter, Z. Zhu, K.L. Saylor, S. Bennett, M. Bouchard, R. Reker, T. Hawbaker, A. Wein, S. Liu, R. Kanengieter, and W. Acevedo. (2012). A land-use and land-cover modeling strategy to support a national assessment of carbon stocks and fluxes, Appl. Geogr., 34, 111– 124, https://doi.org/10.1016/j.apgeog.2011.10.019.
Tian, H. Q., X. Xu, M. Liu, W. Ren, C. Zhang, G. Chen, and C. Lu. (2010). Spatial and temporal patterns of CH4 and N2O fluxes in terrestrial ecosystems of North America during 1979–2008: Application of a global biogeochemistry model, Biogeosciences, 7(9), 2673– 2694, https://doi.org/10.5194/bg-7-2673-2010.
Tao, B., H. Tian, W. Ren, J. Yang, Q. Yang, R. He, W. Cai, and S. Lohrenz. (2014). Increasing Mississippi river discharge throughout the 21st century influenced by changes in climate, land use, and atmospheric CO2, Geophys. Res. Lett., 41, 4978?4986, https://doi.org/10.1002/2014GL060361.
Xu, X. F., H.Q. Tian, G.S. Chen, M.L. Liu, W. Ren, C.Q. Lu, and C. Zhang. (2012). Multifactor controls on terrestrial N2O flux over North America from 1979 through 2010, Biogeosciences, 9(4), 1351– 1366, https://doi.org/10.5194/bg-9-1351-2012.