Documentation Revision Date: 2022-08-04
Summary
The annual wildland fire emissions of carbon and CO2 (tonnes) are expressed as GeoTIFFs of 0.01 degree (~1-km) spatial resolution. The complete set of carbon emissions, PM, and fuel estimates are provided as ESRI Shapefiles. Emissions were estimated using the U.S. Forest Service Consume model (Prichard et al., 2009).
User's Note: The contents of this data set do not represent the full functionality of the WFEIS tools (http://wfeis.mtri.org/).
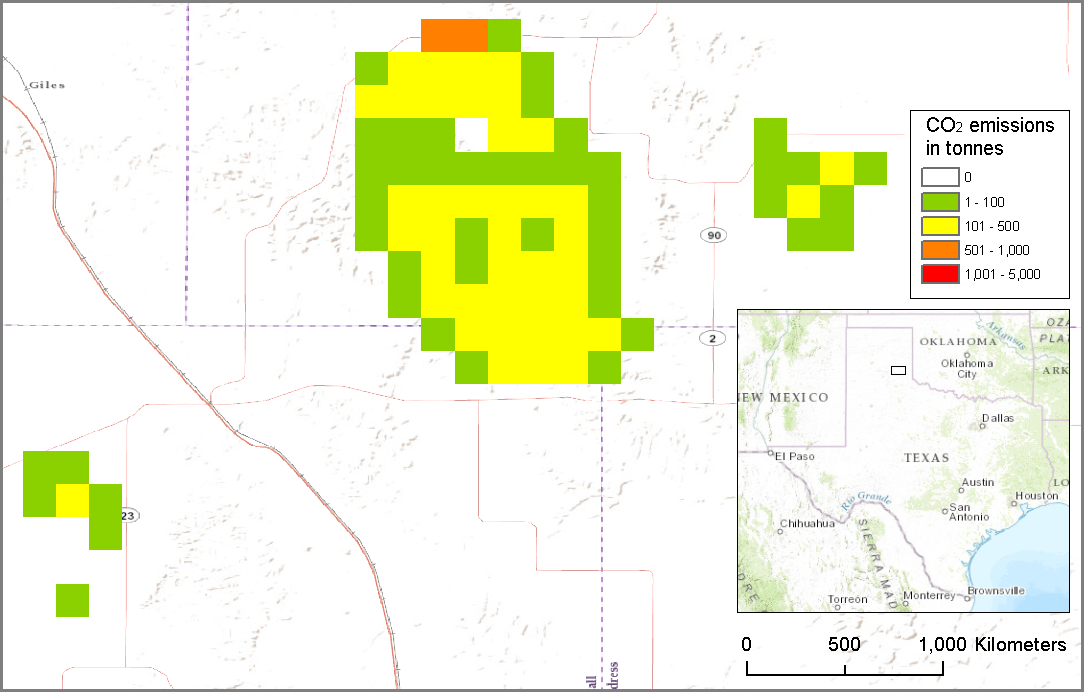
Figure 1. CO2 emissions in tonnes from a northern Texas fire in 2001 estimated by the Wildland Fire Emissions Information System (WFEIS v0.5).
Citation
French, N.H.F., D. McKenzie, T. Erickson, B. Koziol, M. Billmire, K.A. Endsley, N.K.Y. Scheinerman, L.K. Jenkins, M.E. Miller, R. Ottmar, and S. Prichard. 2016. Annual wildland fire emissions (WFEIS v0.5) for Conterminous US and Alaska, 2001-2013. ORNL DAAC, Oak Ridge, Tennessee, USA. https://doi.org/10.3334/ORNLDAAC/1306
Table of Contents
- Dataset Overview
- Data Characteristics
- Application and Derivation
- Quality Assessment
- Data Acquisition, Materials, and Methods
- Data Access
- References
Dataset Overview
Project: Carbon Monitoring System (CMS)
Investigators: Nancy H.F. French, Donald McKenzie, Tyler Erickson, Benjamin Koziol, Michael Billmire, K. Arthur Endsley, Naomi K. Yager Scheinerman, Liza Jenkins, Mary Ellen Miller, Roger Ottmar, Susan Prichard
This data set contains modeled annual wildland fire emissions from 2001 to 2013 for the conterminous U.S. and Alaska distributed as GeoTIFFs of 0.01 degrees (~1-km) resolution and ESRI shapefiles. Fires are mapped to within 8 days of the initial burn in 500-m grid cells using the MODIS MCD64A1 burned area product. Accurate burn dates for individual fire events allow for consideration of fuel conditions driven by weather, such as fuel moisture. Fuel availability is mapped by strata and fire potential to 1-km cells using the Fuel Characteristic Classification System (FCCS; Ottmar et al. 2007). Emissions were estimated by the Consume model which relates fuel loadings from the FCCS and weather-based fuel moisture conditions at the time of the burn to fuel consumption to quantify the various types of emissions (Prichard et al., 2009). The spatial data files track the location and magnitude of the various wildland fire emissions types by year.
This data set was produced using the Wildland Fire Emissions Information System (WFEIS) Emissions Calculator (http://wfeis.mtri.org/) hosted by Michigan Tech Research Institute and supported through grants from the NASA Carbon Cycle Science Program, the NASA Applications Program, and the NASA Carbon Monitoring Program. The WFEIS is a web-based tool for computing wildland fire emissions across CONUS and Alaska at landscape to regional scales from 1984 through 2013. This data set and the WFEIS tool are resources for fire researchers and atmospheric scientists to study how past fires have contributed to emissions that influence air quality and carbon cycling.
CMS: The CMS is designed to make significant contributions in characterizing, quantifying, understanding, and predicting the evolution of global carbon sources and sinks through improved monitoring of carbon stocks and fluxes. The system will use the full range of NASA satellite observations and modeling/analysis capabilities to establish the accuracy, quantitative uncertainties, and utility of products for supporting national and international policy, regulatory, and management activities. CMS will maintain a global emphasis while providing finer scale regional information, utilizing space-based and surface-based data.
Data Characteristics
Spatial Coverage
CONUS and Alaska
Spatial Resolution
- GeoTIFFs are provided at 0.01 degree horizontal resolution (approximately 1-km).
-
Features in the ESRI shapefiles represent areas of equal modeled emissions within the mapped fires.
Temporal Coverage
Data covers 2001 to 2013.
Temporal Resolution
- Each GeoTIFF and Shapefile represents the collection of fires that occurred during a given year.
Study Area (All latitudes and longitudes are given in decimal degrees.)
|
Site |
Westernmost Longitude |
Easternmost Longitude |
Northernmost Latitude |
Southernmost Latitude |
|
CONUS |
-126.90 |
-65.00 |
50.00 |
24.20 |
|
Alaska |
-178.22 |
-129.99 |
71.41 |
51.58 |
Data File Information
GeoTIFFs
Annual carbon and CO2 emissions estimates in tonnes are provided as 78 GeoTIFFs at 0.01 degree spatial resolution.
- For Alaska, one GeoTIFF is included per emission type (carbon and CO2) per year (13) for a total of 26.
- For the CONUS, two GeoTIFFs are included per emission type (carbon and CO2) - one depicting emissions from natural fuels and the other combining emissions from both natural and agricultural fuels - per year (13) for a total of 52.
GeoTIFFs are named as follows:
CONUS:
- conusYYYYcarbon_tonnes.tif
- conusYYYYcarbon_tonnes_w_ag.tif
- conusYYYYco2_tonnes.tif
- conusYYYYco2_tonnes_w_ag.tif
Alaska:
- alaskaYYYYcarbon_tonnes.tif
- alaskaYYYYco2_tonnes.tif
where:
YYYY is the year (2001 - 2013) and
"_w_ag" appended indicates the inclusion of emissions from agricultural fuels.
Spatial Data Properties
- Raster Properties
- Number of Bands: 1
- Raster Format: GeoTIFF (.tif)
- Number Columns: 6190 (CONUS) and 4823 (Alaska)
- Number Rows: 2580 (CONUS) and 1983 (Alaska)
- Data Type: Float
- Cell Size: 0.01 degrees
ESRI shapefiles
ESRI shapefiles include emissions estimates for carbon, CO, CO2, CH4, NMHCs, PM, PM2.5, and PM10 as well as measures of aboveground biomass, total fuel availability, and consumption. Estimates from a single fire may be represented by multiple features within each shapefile.
- For Alaska, emissions from natural fuel sources are included in 13 shapefiles.
- For CONUS, emissions from natural fuels and combined emissions from both natural and agricultural fuels are represented as pairs of shapefiles for each year, for a total of 26. Table 1 describes the measured parameters contained within each shapefile.
Table 1. Shapefile attribute descriptions
| Attribute Name | Attribute Description | Units |
| FID | Shapefile feature ID | NA |
| Shape | Shapefile feature type | NA |
| id | Unique WFEIS identifier | NA |
| date | YYYYMMDD | NA |
| fuelbed)ec | Ecoregion parameter used by Consume ("western", "eastern", or "southern") | NA |
| fuel_moist | 1000-hr fuel moisture | % |
| fuel_moi_1 | Duff fuel moisture | % |
| fuelbed_id | ID of MODIS-enhanced FCCS fuelbed | NA |
| fccs_id | ID of FCCS fuelbed type | NA |
| modis_cano | MODIS-derived percent canopy of the fuelbed | % |
| canopy_con | Percentage of canopy consumption | % |
| area_km2 | Burned area | km2 |
| area_ac | Burned area | acres |
| nmhc_tonne | Non-methane hydrocarbon emissions | tonnes |
| co2_tonnes | Carbon dioxide emissions | tonnes |
| co_tonnes | Carbon monoxide emissions | tonnes |
| pm10_tonne | Emissions of particulate matter (PM) <10 micrometers diameter | tonnes |
| ch4_tonnes | Methane emissions | tonnes |
| pm25_tonne | Emissions of PM <2.5 micrometers diameter | tonnes |
| pm_tonnes | Total emissions of PM | tonnes |
| consumptio | Fuel consumptions | tonnes |
| carbon_ton | Carbon emissions | tonnes |
| fuel_avail | Total fuel available | tonnes |
| total_above | Total above ground biomass | tonnes |
Shapefile Names:
Each shapefile includes 4 files (.shp, .shx, .prj, .dbf) in a zip archive named as follows:
CONUS:
- conusYYYY.zip
- conusYYYY_w_ag.zip
Alaska:
- alaskaYYYY.zip
where YYYY is the year 2001 - 2013 and "_w_ag" is appended to indicate the inclusion of emissions from agricultural fuels.
Spatial Data Properties
- Vector Properties
- Vector Format: Shapefile (.shp)
- Geometry Type: Polygon
- Representative Area: Variable; based on intersection of input features
Spatial Reference System for both GeoTIFFs and Shapefiles
Projected Coordinate System: WGS_1984
Geographic Coordinate System: GCS_WGS_1984
Datum: D_WGS_1984 SPHEROID=D_WGS_1984
Semimajor Axis = 6378137.0
Semiminor Axis = 6378137.0
Inverse Flattening = 298.257223563
Prime Meridian: Greenwich (0.0)
Angular Unit = Degree (0.0174532925199433)
Shapefile Interpretation:
Features were aggregated by each unique set of input parameters (date, fuelbed ecoregion, 1000hr fuel moisture, duff fuel moisture, and fuelbed id) because they result in areas with equal emissions estimates. Figure 2 shows features within conus2001.shp that make up the burned area from a northern Texas fire. The features are colored by unique value for each of the five input parameters. This is the same fire as shown in Figure 1.
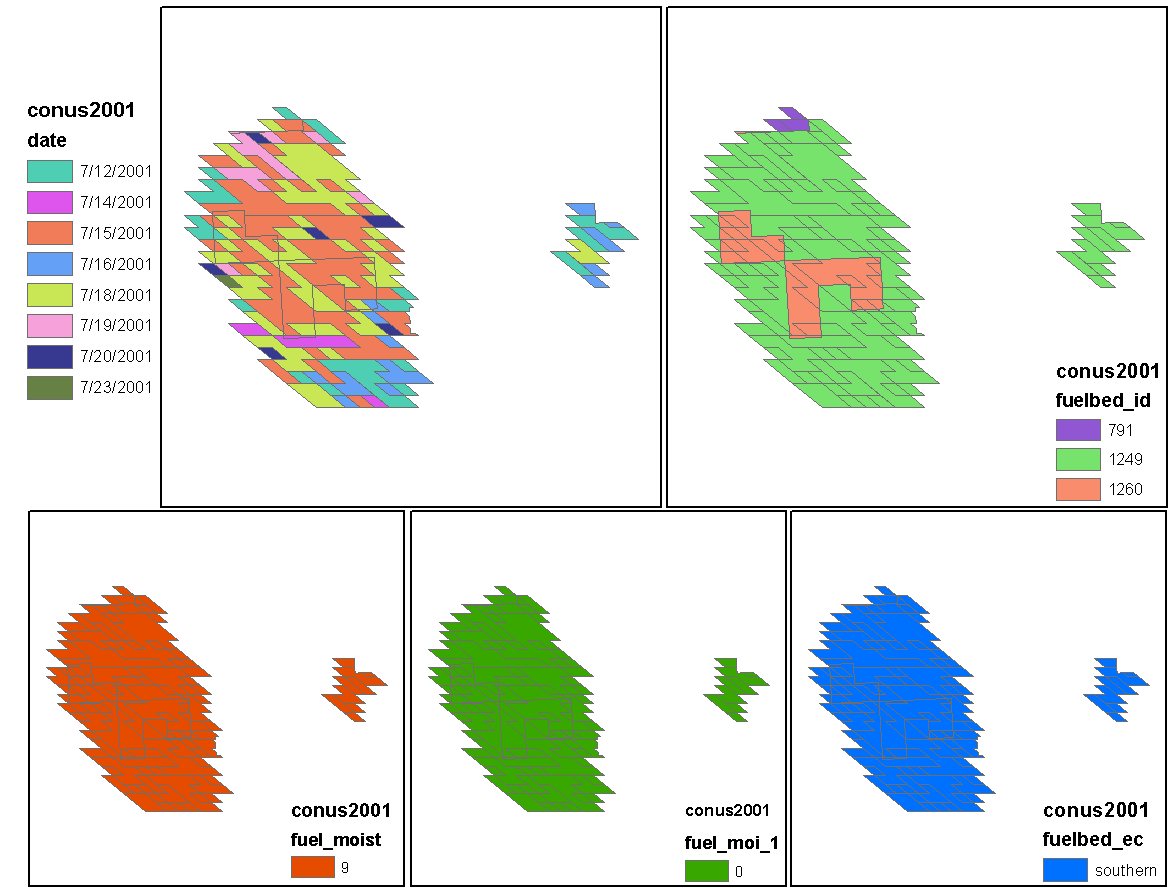
Figure 2. This figure illustrates the common input parameters used to aggregate features within the shapefiles. Each unique set of values for these five parameters result in equal modeled emissions estimates.
Application and Derivation
This annual fire emissions product was output by the WFEIS (French et al., 2014) with full coverage of the CONUS and Alaska. Researchers might use this data set to examine variability of emissions from one region to another or across one region over time. The spatial data files track the location and magnitude of the various wildland fire emissions types by year.
Quality Assessment
No uncertainty estimates are published for this particular data set; however, a variety of outputs from the WFEIS tool have been compared with published emissions estimates from the Global Fire Emissions Database version 3 (GFED; van der Werf et al., 2010). WFEIS emissions estimates were higher in some years and lower in others compared to those produced by the GFED, but similar overall. The results of this comparison are illustrated in Figure 3. WFEIS and GFED both use the MODIS MCD46A1 burned area product. Assessment of the uncertainty of the FCCS is underway by the Michigan Tech Research Institute and the U.S. Forest Service and funded by the Joint Fire Science Program.
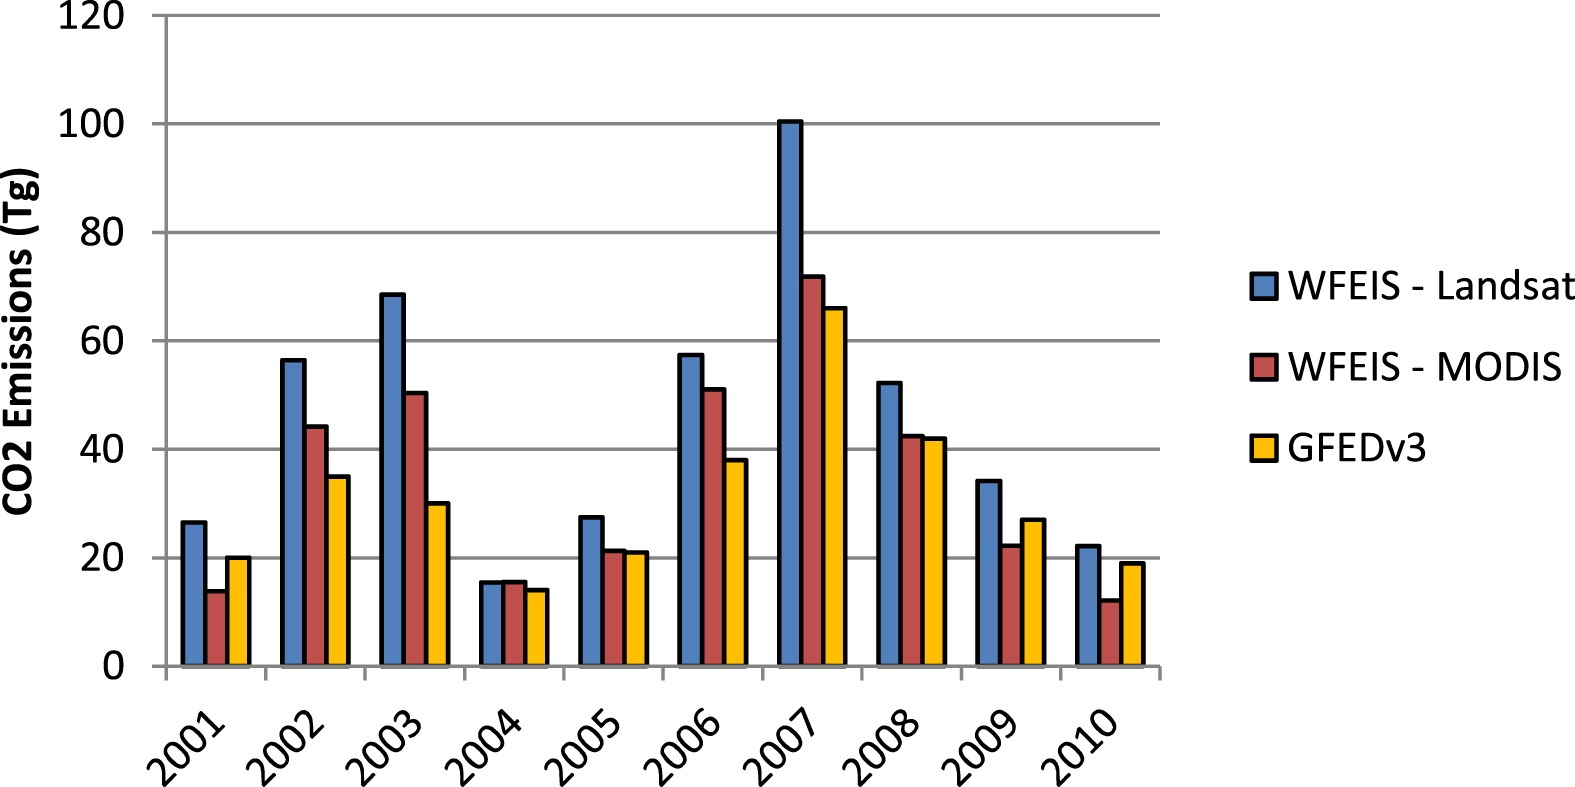
Figure 3. Comparison of CO2 emissions computed within WFEIS (using both the MODIS and Landsat burned area products) to results from the GFEDv3 database (van der Werf et al. 2010).
Data Acquisition, Materials, and Methods
The WFEIS uses the Consume model to produce yearly fire emissions products contained in this data set. The Consume emissions model (http://www.fs.fed.us/pnw/fera/fft/consumemodule.shtml) was developed by the U.S.D.A. Forest Service and uses inputs from derived burned area products, vegetation maps, and weather station readings to estimate fuel consumption based on loadings and moisture (Prichard et al., 2009). A diagram of the Consume workflow employed by the WFEIS is seen in Figure 4.
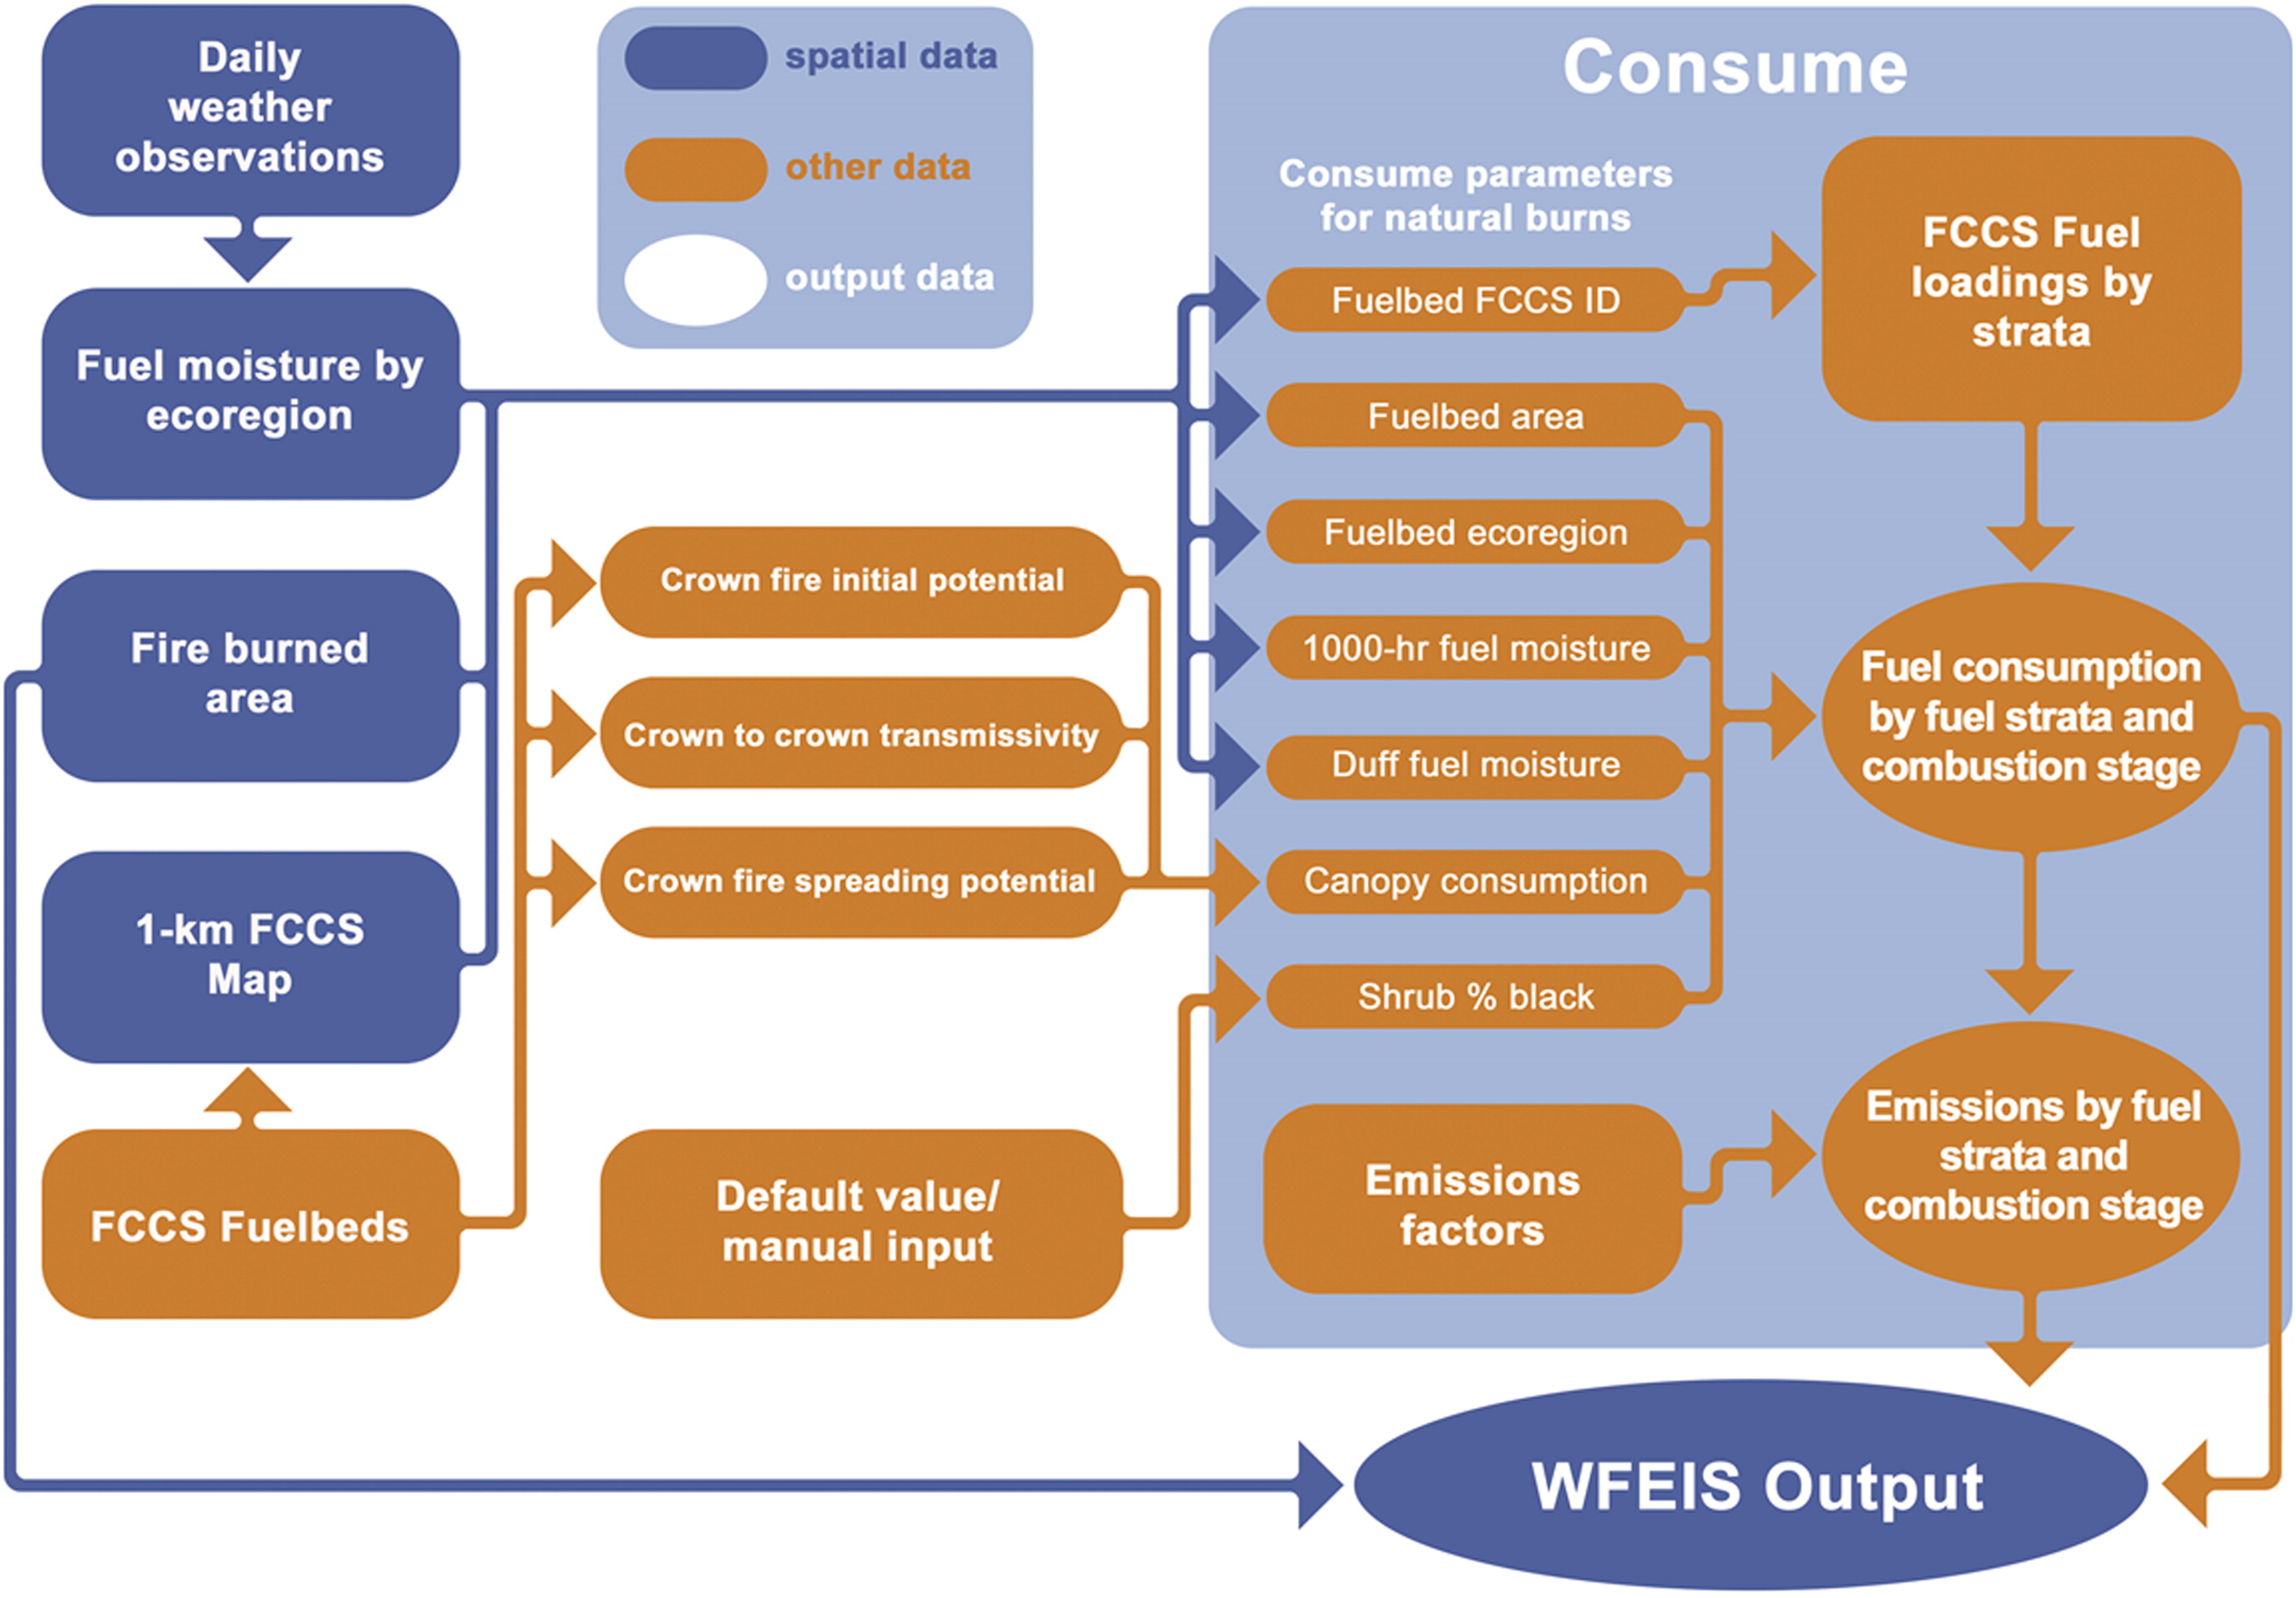
Figure 4. Schematic of the Consume model used by WFEIS. Source French et al. (2014)
Consume took inputs from the following source data to generate this data set:
- MODIS MCD64A1 burned area product: Polygons of burned area were derived from the MODIS MCD64A1 burned area product to define the spatial and temporal extent of fires occurring in the CONUS and Alaska between 2001 and 2013. MODIS MCD64A1 takes advantage of the twice-daily global coverage of the MODIS sensors to resolve fire timing within one day (Giglio et al., 2010; http://modis-fire.umd.edu/pages/BurnedArea.php).
- Fuel Characteristic Classification System: Fuel availability for the mapped fires was determined using the FCCS. The FCCS is a system for describing fuel beds based on their composition and structure (FCCS; Ottmar et al., 2007; http://www.fs.fed.us/pnw/fera/fft/index.shtml).
- 1000-h time-lag fuel moisture: 1000-h fuels are large, dead woody debris 7.6 to 20.0 cm in diameter. Moisture content is tracked by the U.S. National Fire Danger Rating System (NFDRS) using weather data for the previous 7 days (Ottmar and Sandberg, 1985) and used to produce maps of daily fuel moisture retention by ecoregion (Bailey's level 2).
- Duff fuel moisture: Percentage duff fuel moisture is based on the duff moisture code (DMC) of the Canadian Fire Weather Index (FWI) system. The FWI DMC is a numerical rating of the fuel moisture in loosely compacted duff at a depth of 10 to 20 cm and in medium weight surface fuels (van Wagner, 1987). The FWI DMC is converted to percent duff fuel moisture according to the following equations (Lawson et al., 1997):
- % duff fuel moisture (CONUS) = e[(DMC - 244.7) / - 43.4] + 20
- % duff fuel moisture (Alaska) = e[(DMC - 149.6) / - 20.9]
- Percent canopy consumption: Also termed "combustion completeness," percent canopy consumption is the weighted average of three FCCS crown fire potential metrics: 1) crown fire initial potential (CFIP); 2) crown to crown transmissivity (C2CT); and, 3) crown fire spreading potential (CFSP). If CFIP is less than or equal to 3, then canopy consumption is zero. If CFIP is greater than 3:
- canopy consumption % = [(C2CT * 0.5) + (CFSP * 0.5)] * 10
- Shrub blackened was left at the default 50%. This is a user-specified parameter set based on field observations.
Based on consumption estimates, the Consume model uses coded emissions factors compiled by the Forest Service to calculate emissions of CO, CO2, CH4, particulates (PM2.5 and PM10), and non-methane hydrocarbons by fuel stratum and combustion stage (flaming, smoldering, and residual burning). Emission factors used by Consume are available from the WFEIS webpage: http://wfeis.mtri.org/media/img/A3-EmissionFactors.pdf). See French et al. (2014) for more details about the development of this dataset
Data Access
These data are available through the Oak Ridge National Laboratory (ORNL) Distributed Active Archive Center (DAAC).
Annual wildland fire emissions (WFEIS v0.5) for Conterminous US and Alaska, 2001-2013
Contact for Data Center Access Information:
- E-mail: uso@daac.ornl.gov
- Telephone: +1 (865) 241-3952
References
French, N.H.F., D. McKenzie, T. Erickson, B. Koziol, M. Billmire, K.A. Endsley, N.K. Yager Scheinerman, L. Jenkins, M.E. Miller, R. Ottmar, and S. Prichard. 2014. Modeling Regional-Scale Wildland Fire Emissions with the Wildland Fire Emissions Information System, Earth Interact., 18, 1–26, doi: http://dx.doi.org/10.1175/EI-D-14-0002.1
Giglio, L., J.T. Randerson, G.R. van der Werf, P.S. Kasibhatla, G.J. Collatz, D.C. Morton, and R.S. DeFries. 2010. Assessing variablity and long-term trends in burned area by merging multiple satellite fire products, Biogeosciences, 7, 1171–1186, doi:10.5194/bg-7-1171-2010.
Lawson, B. D., G. N. Dalrymple, and B. C. Hawkes. 1997. Predicting forest floor moisture contents from duff moisture code values, Forestry Research Applications Pacific Forestry Centre Technology Transfer Note 6, 4 pp.
Ottmar, R.D., D.V. Sandberg. 1985. Calculating moisture content of 1000-hour timelag fuels in western Washington and western Oregon, USDA Forest Service Research Paper PNW-336, 20 pp.
Ottmar, R. D., D.V. Sandberg, C.L. Riccardi, and S.J. Prichard. 2007. An overview of the Fuel Characteristic Classification System (FCCS)- Quantifying, classifying, and creating fuelbeds for resource planning, Canadian Journal for Res., 37, 2383-2393, doi:10.1139/X07-077.
Prichard, S.J., R.D. Ottmar, and G.A. Anderson. 2009. Consume 3.0 user’s guide, USDA Forest Service Pacific Wildland Fire Sciences Laboratory Rep., 239 pp.
van der Werf, G. R., J.T. Randerson, L. Giglio, G.J. Collatz, M. Mu, P.S. Kasibhatla, D.C. Morton, R.S. DeFries, Y.Jin, and T.T. van Leeuwen. 2010. Global fire emissions and the contribution of deforestation, savanna, forest, agricultural, and peat fires (1997–2009), Atmos. Chem. Phys., 10,707–111, doi:10.5194/acp-10-11707-2010.
van Wagner, C. E. 1987. Development and structure of the Canadian Forest Fire Weather Index System, Canadian Forest Service Forestry Tech. Rep. 35, 48 pp.