Documentation Revision Date: 2017-10-27
Data Set Version: 1
Summary
This dataset contains 258 data files in GeoTIFF (*.tif) file format and one compressed shapefile (*.zip) providing the file footprints. The source LiDAR data files are provided in a related dataset.
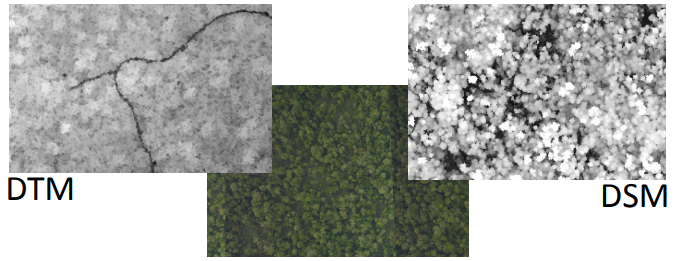
Figure 1. Digital terrain model (DTM) and digital surface model (DSM) generated for the Mawas region of Central Kalimantan, Indonesia on the island of Borneo (from Hagen 2015).
Citation
Melendy, L., S. Hagen, F.B. Sullivan, T. Pearson, S.M. Walker, P. Ellis, Kustiyo, K.A. Sambodo, O. Roswintiarti, M. Hanson, A.W. Klassen, M.W. Palace, B.H. Braswell, G.M. Delgado, S.S. Saatchi, and A. Ferraz. 2017. CMS: LiDAR-derived Canopy Height, Elevation for Sites in Kalimantan, Indonesia, 2014. ORNL DAAC, Oak Ridge, Tennessee, USA. https://doi.org/10.3334/ORNLDAAC/1540
Table of Contents
- Data Set Overview
- Data Characteristics
- Application and Derivation
- Quality Assessment
- Data Acquisition, Materials, and Methods
- Data Access
- References
Data Set Overview
This dataset provides canopy height and elevation data products derived from airborne LiDAR data collected over 90 sites on the island of Borneo in late 2014. The sites cover approximately 100,000 hectares of forested land in Kalimantan, Indonesia. The data were produced as part of an effort to establish a national forest monitoring system for Indonesia that uses a combination of remote sensing and ground-based forest carbon inventory approaches.
Project: Carbon Monitoring System (CMS)
The NASA Carbon Monitoring System is designed to make significant contributions in characterizing, quantifying, understanding, and predicting the evolution of global carbon sources and sinks through improved monitoring of carbon stocks and fluxes. The System will use the full range of NASA satellite observations and modeling/analysis capabilities to establish the accuracy, quantitative uncertainties, and utility of products for supporting national and international policy, regulatory, and management activities. CMS will maintain a global emphasis while providing finer scale regional information, utilizing space-based and surface-based data and will rapidly initiate generation and distribution of products both for user evaluation and to inform near-term policy development and planning.
Related Data Set:
Melendy, L., S. Hagen, F.B. Sullivan, T. Pearson, S.M. Walker, P. Ellis, Kustiyo, K.A. Sambodo, O. Roswintiarti, M. Hanson, A.W. Klassen, M.W. Palace, B.H. Braswell, G.M. Delgado, S.S. Saatchi, and A. Ferraz. 2017. CMS: LiDAR Data for Forested Sites on Borneo Island, Kalimantan, Indonesia, 2014. ORNL DAAC, Oak Ridge, Tennessee, USA. https://doi.org/10.3334/ORNLDAAC/1518
Related Publication:
Melendy, L., S.C. Hagen, F.B. Sullivan, T.R.H. Pearson, S.M. Walker, P. Ellis, Kustiyo, Ari Katmoko Sambodo, O. Roswintiarti, M. Hanson, A.W. Klassen, M. Palace, R. Braswell, G. Delgado, S. Saatchi, and A. Feraz. 2017. Automated method for measuring the extent of selective logging damage with airborne LiDAR data. Remote Sensing of Environment. In Review.
Acknowledgements:
This study was funded by NASA Carbon Monitoring System (Grant number: NNX13AP88G) under the title of “Operational multi-sensor design for national scale forest carbon monitoring to support REDD+ MRV systems” (Project Lead: Stephen Hagen).
Data Characteristics
Spatial Coverage: Sites in Kalimantan province, Indonesia
Spatial Resolution: 1-meter
Temporal Coverage: 20141018 - 20141130
Temporal Resolution: Each study site was surveyed once
Study Area (These coordinates encompass the approximate locations of the study sites and may not match the extents of the data files. All latitude and longitude given in decimal degrees.)
|
Site |
Westernmost Longitude |
Easternmost Longitude |
Northernmost Latitude |
Southernmost Latitude |
|---|---|---|---|---|
|
Kalimantan, Indonesia |
109.81 |
118.00 |
3.21 |
-2.76 |
Data File Information
There are 258 files in GeoTIFF (*.tif) format included in this dataset. A digital surface model (DSM), digital terrain model (DTM), and canopy height model (CHM) are provided for each of the 90 surveyed areas. Spatial reference properties for the data files are listed below. Data files are named as follows:
Polygon_<siteid>_utm_<zone>_<metric>.tif
siteid = three-digit site identifier (corresponds to siteID attribute in indonesia_lidar_footprints.shp)
zone = UTM Zone
metric = Type of elevation data provided in the file (CHM, DTM, DSM)
Spatial Reference Properties
Geographic Coordinate System: GCS_DGN95
Angular Unit: Degree (0.0174532925199433)
Prime Meridian: Greenwich (0.0)
Datum: D_Datum_Geodesi_Nasional_1995
Spheroid: WGS_1984
Semimajor Axis: 6378137.0
Semiminor Axis: 6356752.314245179
Inverse Flattening: 298.257223563
UTM Zones 49N, 49S, 50N, 50S
Spatial Data Properties
Spatial Representation Type: Raster
Pixel Depth: 32 bit
Pixel Type: float
Compression Type: LZW
Number of Bands: 1
Raster Format: TIFF
No Data Value: -9999
Scale Factor: 1
The survey footprints are provided as a compressed shapefile (in indonesia_lidar_footprints.zip) and identified by the “siteID” attribute. Shapefile attribute names and descriptions are given in Table 1.
The shapefile is also provided as a companion file in kmz (*.kmz) format for viewing in Google Earth.
Table 1. Shapefile (indonesia_lidar_footprints.shp) attribute names, units, and descriptions.
|
Attribute Name |
Units |
Descriptions |
|
siteID |
|
three-digit site identifier |
|
sid_int |
|
siteID converted to integer format |
|
Specs |
ppm2 |
LiDAR data were collected according to five different sets of specifications, primary focused on point density: 1) 4.03 points per square meter (ppm2) excluding overlap; 2) 5.75 ppm2; 3) 6.02 ppm2; 4) 10.05 ppm2; 5) no specification |
|
area_ha |
hectare |
Approximate site area |
|
LiDAR_Line |
YYMMDD |
Survey date; YY = 2014 |
Application and Derivation
The data were produced as part of an effort to establish a national forest monitoring system for Indonesia. Future goals of the project include mapping forest carbon stocks across Kalimantan and estimating forest carbon flux associated with logging.
Quality Assessment
Uncertainty associated with this data has not been analyzed.
Data Acquisition, Materials, and Methods
This dataset was produced as part of an effort to establish a national forest monitoring system for Indonesia that uses a combination of remote sensing and ground-based forest carbon inventory approaches. The effort was led by Applied GeoSolutions (http://www.appliedgeosolutions.com/) and funded through NASA's Carbon Monitoring System project with support from Winrock (https://www.winrock.org/), NASA's Jet Propulsion Laboratory, the University of New Hampshire, Wageningen University, and the University of Virginia.
Data Acquisition
Airborne LiDAR observations were collected over 104,000 hectares of forest across Kalimantan, Indonesia on the island of Borneo between 18 October and 30 November 2014 by Jakarta-based company Surtech (http://www.surtech-group.com/). The data were collected at point densities ranging between 4- and 10-ppm.
Product Derivation
The digital surface models (DSM), digital terrain models (DTM), and canopy height models (CHM) were generated from the raw LiDAR observations using the multi-stage processing routine depicted in Figure 2. The workflow uses the “pdal_ground” and “points2grid“ functions available through the open source Point Data Abstraction Library (PDAL; https://www.pdal.io).
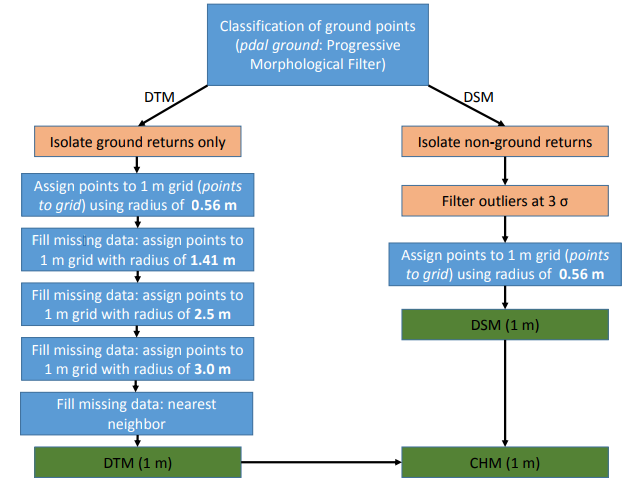
Figure 2. Workflow for generating DTM, DSM, and CHM from LiDAR point cloud data (from Hagen 2015).
Data Access
These data are available through the Oak Ridge National Laboratory (ORNL) Distributed Active Archive Center (DAAC).
CMS: LiDAR-derived Canopy Height, Elevation for Sites in Kalimantan, Indonesia, 2014
Contact for Data Center Access Information:
- E-mail: uso@daac.ornl.gov
- Telephone: +1 (865) 241-3952
References
Hagen, S., F.B. Sullivan, S. Saatchi, T. Pearson, M. Palace, B.H. Braswell, S. Brown, W.A. Salas, M. Hanson. 2015. Forest Monitoring in Indonesia: Using an extensive LiDAR data set to map forest carbon stock and logging impacts. Poster for the American Geophysical Union 2015 conference. Poster is include as a companion file: Hagen_2015_AGU_poster.pdf
Melendy, L., S.C. Hagen, F.B. Sullivan, T.R.H. Pearson, S.M. Walker, P. Ellis, Kustiyo, Ari Katmoko Sambodo, O. Roswintiarti, M. Hanson, A.W. Klassen, M. Palace, R. Braswell, G. Delgado, S. Saatchi, and A. Feraz. 2017. Automated method for measuring the extent of selective logging damage with airborne LiDAR data. Remote Sensing of Environment. In Review.