Documentation Revision Date: 2020-01-09
Dataset Version: 1
Summary
The gridded products were produced by upscaling annual soil respiration estimates from the SRDB version 3. This was accomplished by fitting a QRF algorithm to over 2,500-point observations and corresponding 1-km spatially distributed climate (annual temperature, annual and seasonal precipitation) and vegetation covariates. The data units are in g C m^-2 y^-1 based on the mean of the predicted distributions at each pixel. The prediction uncertainty is based on the standard deviation of the predicted distributions at each pixel. Annual Rh, the microbially-derived component of Rs, was estimated from the predicted annual Rs using empirical relationships derived by two meta-analyses using equations from Bond-Lamberty et al. (2004) and Subke et al. (2006).
There are six data files in GeoTIFF (.tif) format with this dataset.
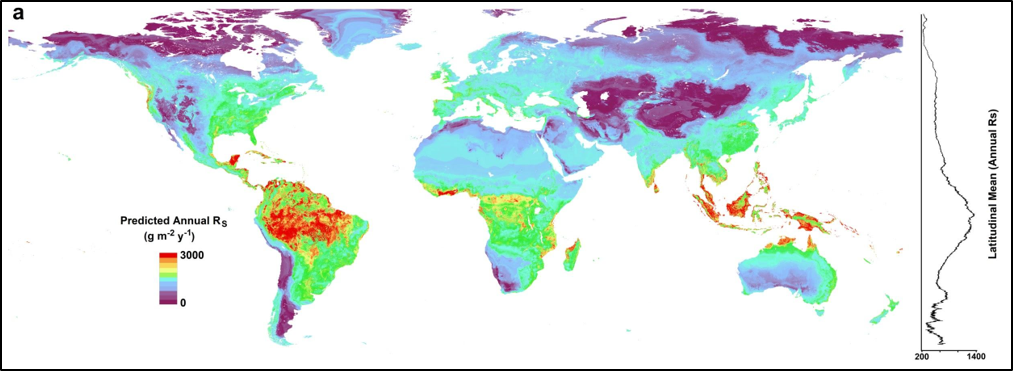
Figure 1. A global map of predicted annual soil respiration (Rs) at 1-km spatial resolution created by applying the QRF model to gridded covariates. To the right is a plot of the latitudinal mean predicted annual Rs. (Figure from Warner et al., In Review).
Citation
Warner, D.L., B.P. Bond-Lamberty, J. Jian, E. Stell, and R. Vargas. 2019. Global Gridded 1-km Annual Soil Respiration and Uncertainty Derived from SRDB V3. ORNL DAAC, Oak Ridge, Tennessee, USA. https://doi.org/10.3334/ORNLDAAC/1736
Table of Contents
- Dataset Overview
- Data Characteristics
- Application and Derivation
- Quality Assessment
- Data Acquisition, Materials, and Methods
- Data Access
- References
Dataset Overview
This dataset provides six global gridded (mapped) products at 1-km resolution of predicted annual soil respiration (Rs) and associated uncertainty, maps of the lower and upper quartiles of the prediction distributions, and two derived annual heterotrophic respiration (Rh) maps. A machine learning approach was used to derive the predicted Rs and uncertainty data using a quantile regression forest (QRF) algorithm trained with observations from the global Soil Respiration Database (SRDB) version 3 spanning from 1961 to 2011. The two Rh maps were derived from the predicted Rs with two different empirical equations. These products were produced to support carbon cycle research at local- to global-scales, and highlight the immense spatial variability of soil respiration and our ability to predict it across the globe.
The gridded products were produced by upscaling annual soil respiration estimates from the SRDB version 3. This was accomplished by fitting a QRF algorithm to over 2,500-point observations and corresponding 1-km spatially distributed climate (annual temperature, annual and seasonal precipitation) and vegetation covariates. The data units are in g C m^-2 y^-1 based on the mean of the predicted distributions at each pixel. The prediction uncertainty is based on the standard deviation of the predicted distributions at each pixel. Annual Rh, the microbially-derived component of Rs, was estimated from the predicted annual Rs using empirical relationships derived by two meta-analyses using equations from Bond-Lamberty et al. (2004) and Subke et al. (2006).
Project: Carbon Monitoring System
The NASA Carbon Monitoring System (CMS) is designed to make significant contributions in characterizing, quantifying, understanding, and predicting the evolution of global carbon sources and sinks through improved monitoring of carbon stocks and fluxes. The System will use the full range of NASA satellite observations and modeling/analysis capabilities to establish the accuracy, quantitative uncertainties, and utility of products for supporting national and international policy, regulatory, and management activities. CMS will maintain a global emphasis while providing finer scale regional information, utilizing space-based and surface-based data and will rapidly initiate generation and distribution of products both for user evaluation and to inform near-term policy development and planning.
Related Publications:
Warner D.L., B. Bond-Lamberty, J. Jian, E. Stell, and R. Vargas. 2019. Spatial predictions and associated uncertainty of annual soil respiration at the global scale. Global Biogeochemical Cycles. https://doi.org/10.1029/2019GB006264
Bond-Lamberty, B., V.L. Bailey, M. Chen, C.M. Gough, and R. Vargas. (2018). Globally rising soil heterotrophic respiration over recent decades. Nature, 560(7716), 80–83. https://doi.org/10.1038/s41586-018-0358-x
Related Dataset:
Bond-Lamberty, B.P., and A.M. Thomson. 2018. A Global Database of Soil Respiration Data, Version 4.0. ORNL DAAC, Oak Ridge, Tennessee, USA. https://doi.org/10.3334/ORNLDAAC/1578
NOTE: This study used SRDB Version 3. The data were accessed from commit number 651770 in GitHub, https://github.com/bpbond/srdb
Acknowledgement:
This work was funded by NASA’s Carbon Monitoring System program with grant number 80NSSC18K0173.
Data Characteristics
Spatial Coverage: Global. Antarctica is not included due to a scarcity of data.
Spatial Resolution: 0.008333 x 0.008333 degree or approximately 1 km2
Temporal Coverage: One time estimate based on input data from 1963-01-01 to 2011-12-31.
Temporal Resolution: One time annual estimate.
Study Area: Global
Data File Information
There are six data files with this dataset in GeoTIFF (.tif) format. All data are in units of g C m^-2 y^-1 with a no data value of -9999 and no scale factor. The resolution for all products is 0.008333 x 0.008333 degree or approx 1-km. Spatial Datum: WGS 1984 (EPSG: 4326)
Table 1. File names and descriptions
| File names | Description |
| soil_resp_mean_quantile_regress_forest.tif | Predicted annual soil respiration based on the mean of the regression forest prediction distributions at each pixel. |
| soil_resp_std_dev_quantile_regress_forest.tif | Prediction uncertainty based on the standard deviation of the regression forest prediction distributions at each pixel. Grid values are not adjusted to correct for curvature distortion of true pixel surface area. |
| soil_resp_Q25_quantile_regress_forest.tif | Lower quartile of the regression forest prediction distributions |
| soil_resp_Q75_quantile_regress_forest.tif | Upper quartile of the regression forest prediction distributions |
| heterotrophic_resp_Bond_Lamberty_2004.tif | Predicted annual heterotrophic respiration derived from empirical equations of Bond-Lamberty et al. (2004) |
| heterotrophic_resp_Subke_2006.tif | Predicted annual heterotrophic respiration derived from empirical equations of Subke et al. (2006) |
Application and Derivation
This study provides predictions of Rs (and associated prediction uncertainty) at unprecedentedly high spatial resolution across the globe that could help constrain local-to-global process-based models. Furthermore, it provides insights into the large variability of Rs and Rh across vegetation classes and identifies regions and vegetation types with poor model performance that should be prioritized for future data collection (Warner et al., 2019 In Review).
Quality Assessment
Training data were filtered to remove outliers and observations of extreme soil respiration rates from small features (e.g., ant hills, cracks in pavement). The model parameters were tuned via 5 repetitions of 10-fold cross validations. Final model R-squared, RMSE, and MAE were 0.63, 305.2 g C m^-2 y^-1, and 141 g C m^-2 y^-1, respectively. The use of the quantile regression forest model used to make spatial predictions allowed us to examine the consistency of model output at each pixel, providing spatially distribution of model prediction uncertainty as well. These modeled products are derived from observations from the Soil Respiration Database, which contains many different studies and measurement techniques, all of which contain some degree of uncertainty. Similarly, the covariate grids used for spatial upscaling may contain some degree of uncertainty. These sources of uncertainty are highly difficult to quantify for end products and remain a challenge for global ecological models.
Data Acquisition, Materials, and Methods
Please refer to Warner et al. (2019 In Review) and Bond-Lamberty et al. (2018) for additional details.
Global Rs measurements and environmental covariates
Data were used from the SRDB version 3.0 covering the years 1961-2011 (commit number 651770 in GitHub, https://github.com/bpbond/srdb) of the soil respiration database (SRDB) (Bond-Lamberty and Thomson, 2010).
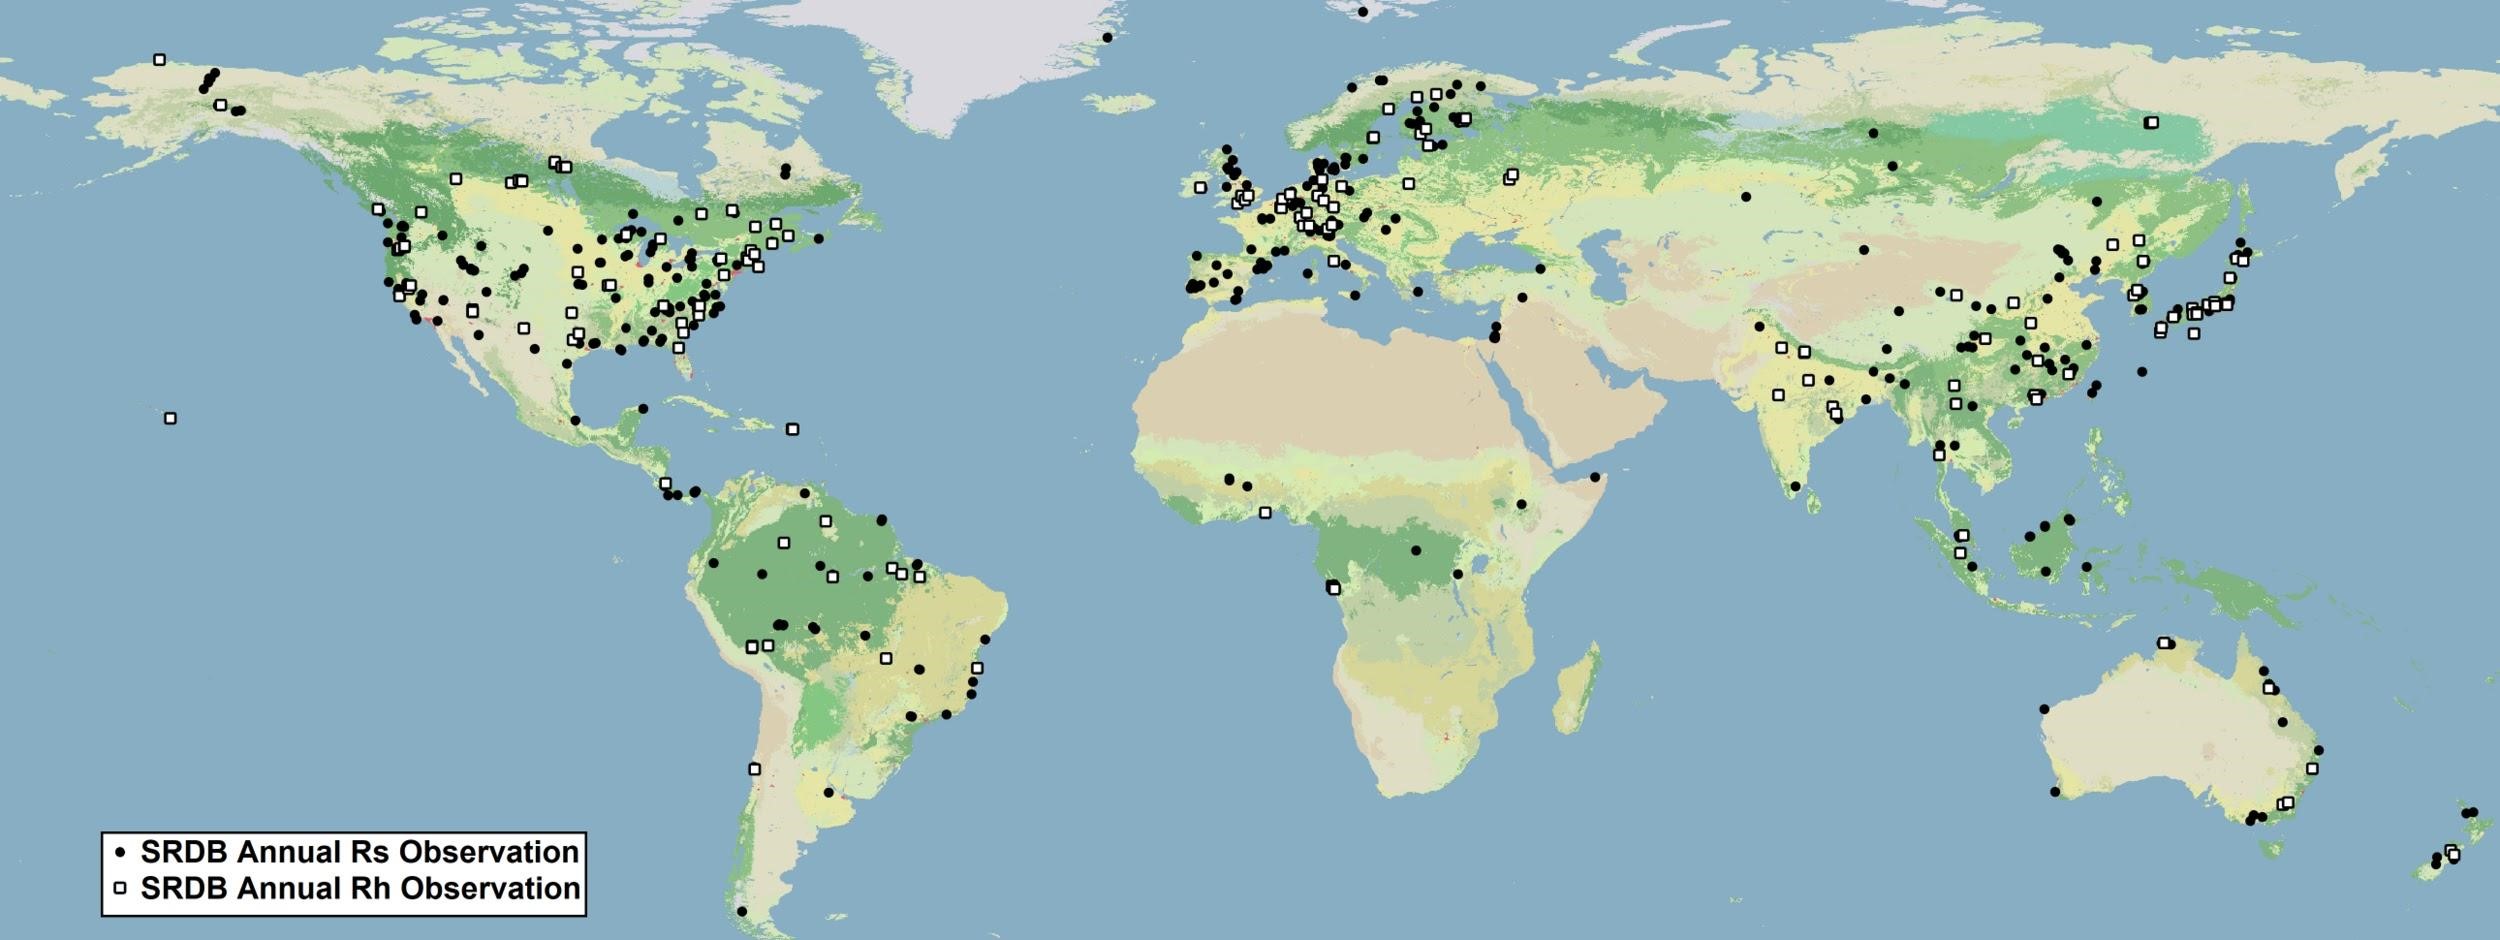
Figure 2. Global distribution of entries in the SRDB used in this study. Black points represent observations used to build the predictive model, white points represent studies that include observations of heterotrophic respiration (Rh) (Warner et al., 2019 In Review).
The SRDB data were filtered to remove studies that employed experimental manipulations, as well as studies that focused on extremely high Rs values from small scale features like ant mounds or fractures along urban pavement. This yielded a set of 2,657 input observations of annual Rs around the world (Fig 2). Prediction factors were represented by 17 globally distributed climatological, phenological, and geophysical predictors from worldgrids.org (last accessed Jan. 2018). These data come from three main sources: climate surfaces, remote sensing, and digital terrain analysis. Data were then coupled with data from the SRDB by extracting corresponding predictor grid pixel values to Rs observation coordinates. Spatial covariates were masked to remove open surface water bodies using the Global Lakes and Wetlands Database (Lehner and Doll, 2004). Antarctica was excluded from this analysis due to a lack of available data (Warner et al., 2019 In Review).
This initial set of potential predictors was refined to a set of highly important predictor variables via Variable Selection Using Random Forests (Genuer et al., 2010). This set was pared down via a stepwise series of random forest models that add variables based on their importance. Variables are only retained in the final predictor set if their addition to the model reduces out-of-bag error below a certain threshold, with the intent of reducing model uncertainty as well as predictor redundancy (Genuer et al., 2010).
Modeling global Rs
A quantile regression forest model (QRF) (Meinshausen, 2006) was used to predict global Rs trained using the selected environmental covariates (i.e., predictors) with the 2,657 input Rs observations from the SRDB. The final model was then trained using all input data, and model performance evaluated based on its R2, root mean squared error (RMSE), and mean absolute error (MAE). The final model was extrapolated to the globally distributed spatial environmental covariates to make a prediction of mean annual Rs at each 1-km pixel. The mean of the conditional prediction distribution of the QRF was used as the final prediction for each pixel, while the standard deviation of this distribution was used as an indicator of individual prediction uncertainty.
The lower and upper quartiles of the prediction distributions are provided as separate products with this dataset..
Calculation of heterotrophic respiration from model predictions
In addition to predicting annual Rs, the model predictions fit observations of heterotrophic respiration (Rh), the microbially-derived component of Rs, were investigated. Annual Rh was estimated from predicted annual Rs (in units of g C m-2 y-1) using empirical relationships derived by two meta-analyses with the following equations:
|
Equation |
Source |
|---|---|
|
ln(Rh) = 1.22 + 0.73ln(Rs) |
Bond-Lamberty et al., 2004 |
|
Rh/Rs = -0.138ln(Rs) + 1.482 |
Subke et al., 2006 |
Then, field observations of Rh were compared to the pixel values of estimated Rh (derived from two different empirical relationships) to assess the suitability of this global 1x1-km Rs data product to infer global Rh at 1x1-km resolution.
Data Access
These data are available through the Oak Ridge National Laboratory (ORNL) Distributed Active Archive Center (DAAC).
Global Gridded 1-km Annual Soil Respiration and Uncertainty Derived from SRDB V3
Contact for Data Center Access Information:
- E-mail: uso@daac.ornl.gov
- Telephone: +1 (865) 241-3952
References
Bond-Lamberty, B., V.L. Bailey, M. Chen, C.M. Gough, and R. Vargas. (2018). Globally rising soil heterotrophic respiration over recent decades. Nature, 560(7716), 80–83. https://doi.org/10.1038/s41586-018-0358-x
Bond-Lamberty, B., and A.M. Thomson. (2010). A global database of soil respiration data. Biogeosciences , 7, 1915–1926. https://doi.org/10.5194/bg-7-1915-2010
Bond-Lamberty, B., C. Wang, and S.T. Gower. (2004). A global relationship between the heterotrophic and autotrophic components of soil respiration? Global Change Biology, 10(10), 1756–1766. https://doi.org/10.1111/j.1365-2486.2004.00816.x
Channan, S., K. Collins, and W.R. Emanuel. (2014). Global mosaics of the standard MODIS land cover type data. University of Maryland and the Pacific Northwest National Laboratory, College Park, Maryland, USA. Available from https://tiles.arcgis.com/tiles/HVjI8GKrRtjcQ4Ry/arcgis/rest/services/Global_Land_Cover_Land_Use_Systems/MapServer
Genuer, R., J.M. Poggi, and C. Tuleau-Malot. (2010). Variable selection using random forests. Pattern Recognition Letters, 31(14), 2225–2236. https://doi.org/10.1016/j.patrec.2010.03.014
Lehner, B., and P. Doll. (2004). Development and validation of a global database of lakes, reservoirs and wetlands. Journal of Hydrology. https://doi.org/10.1016/j.jhydrol.2004.03.028
Meinshausen, N. (2006). Quantile Regression Forests. Journal of Machine Learning Research: JMLR, 7(Jun), 983–999. Retrieved from http://www.jmlr.org/papers/volume7/meinshausen06a/meinshausen06a.pdf
Subke, J.A., I. Inglima, and M.F. Cotrufo. (2006). Trends and methodological impacts in soil CO2 efflux partitioning: A metaanalytical review. Global Change Biology, 12(2), 921–943. https://doi.org/10.1111/j.1365-2486.2006.01117.x
Warner D.L., B. Bond-Lamberty, J. Jian, E. Stell, and R. Vargas. 2019. Spatial predictions and associated uncertainty of annual soil respiration at the global scale. Global Biogeochemical Cycles. https://doi.org/10.1029/2019GB006264