Documentation Revision Date: 2017-11-20
Data Set Version: 2
Summary
The flux estimates represent gridded annual carbon fluxes associated with global livestock, summed over all livestock types. The quantities of carbon flux in each grid cell are represented in two ways: (1) the carbon fluxes distributed to each gridcell were divided by the gridcell total surface area, resulting in average emissions per m2 across the entire gridcell (g C/m2/yr). As such, these fluxes per area are not additive. And (2), where annual carbon fluxes associated with a source were summed over all types for the grid cell (Mg C/yr). The total surface area of the grid cells is provided.
There are 56 comma-separated (.csv) files with this data set. The data files are arranged by year and further arranged by solids and gases. Files are further separated by average carbon fluxes per unit of total area and annual carbon fluxes summed over all types. There are four sets of 14 annual data files
There are four (4) NetCDF format files with this data set. Each file contains yearly flux estimates for the entire date range and for either solids or gases and either average carbon fluxes per unit of total area or annual carbon fluxes summed over all types. Note that each NetCDf file contains the same data as the set of the 14 corresponding flux *.csv files.
Revision Note: The four NetCDF format files were added to this dataset in November 2017. There were no changes to data content.
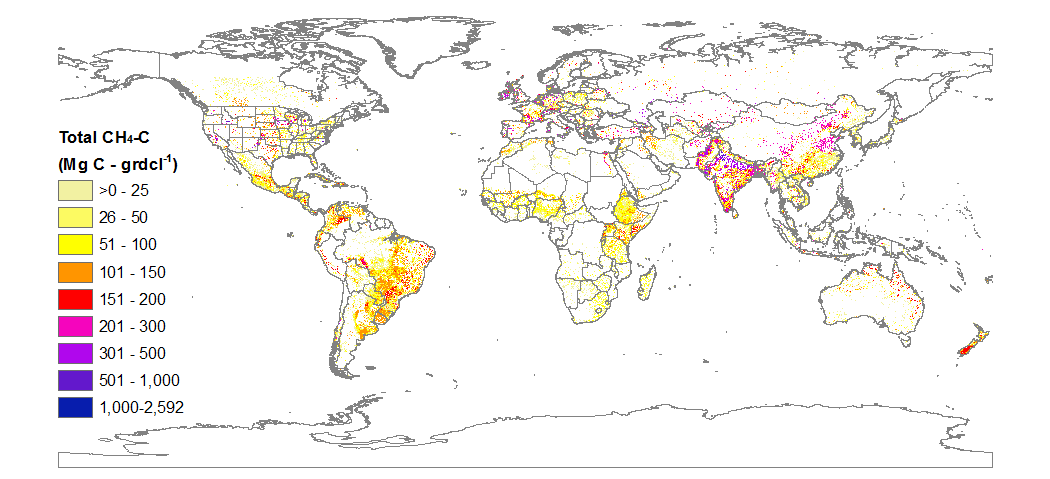
Figure 1. Total livestock methane emissions in 2011, downscaled to 0.05 x 0.05 degree resolution, for the globe (figure from Wolf et al. 2017).
Citation
Wolf, J., G. Asrar, and T.O. West. 2017. CMS: Global Carbon Fluxes Associated with Livestock Feed and Emissions, 2000-2013. ORNL DAAC, Oak Ridge, Tennessee, USA. https://doi.org/10.3334/ORNLDAAC/1329
Table of Contents
- Data Set Overview
- Data Characteristics
- Application and Derivation
- Quality Assessment
- Data Acquisition, Materials, and Methods
- Data Access
- References
- Data Set Revisions
Data Set Overview
These data represent gridded annual carbon fluxes associated with global livestock, summed over all livestock types. These fluxes can be summed across multiple grid cells to obtain totals for any given areas. All fluxes are presented in units of carbon, e.g. the amount of carbon contained in gaseous methane (CH4-C) or carbon dioxide (CO2-C) emissions. These flux estimates were based on livestock populations reported by the Food and Agriculture Organization (FAO) and the United States Department of Agriculture National Agricultural Statistics Service (USDA NASS), and on new coefficients for livestock C intake, manure production, and CH4 and CO2 emissions per animal, developed by Wolf et al. (2017), along with previously published coefficients [IPCC, 2006] (for methane emissions associated with non-dairy cattle enteric fermentation, and with manure management and enteric fermentation in bison, goats, sheep, camels, camelids, and poultry). The livestock populations used are constrained at the national level for most nations; at the state or province level for Argentina, Brazil, Canada, Chile, China, India, Kazakhstan, Mexico, and Russia; and at the county level for the United States.
Project: Carbon Monitoring System (CMS)
The NASA Carbon Monitoring System (CMS) is designed to make significant contributions in characterizing, quantifying, understanding, and predicting the evolution of global carbon sources and sinks through improved monitoring of carbon stocks and fluxes. The System will use the full range of NASA satellite observations and modeling/analysis capabilities to establish the accuracy, quantitative uncertainties, and utility of products for supporting national and international policy, regulatory, and management activities. CMS will maintain a global emphasis while providing finer scale regional information, utilizing space-based and surface-based data and will rapidly initiate generation and distribution of products both for user evaluation and to inform near-term policy development and planning.
Related Publication:
Wolf, J., G. R. Asrar, and T. O. West. 2017. Revised Methane Emissions Factors and Spatially Distributed Annual Carbon Fluxes for Global Livestock. Carbon Balance and Management. 12:16. https://doi.org/10.1186/s13021-017-0084-y
Related Dataset:
Wolf, J., T.O. West, Y. Le Page, G. Kyle, X. Zhang, G.J. Collatz, and M.L. Imhoff. 2015. CMS: Carbon Fluxes from Global Agricultural Production and Consumption, 2005-2011. ORNL DAAC, Oak Ridge, Tennessee, USA. https://dx.doi.org/10.3334/ORNLDAAC/1279
Note: The data provided here were derived using a different coefficient than the Wolf et al. (2015) data set listed above, although most other methods were the same.
Data Characteristics
Spatial Coverage: Global
Spatial Resolution: 0.05 degree x 0.05 degree grid
Temporal Coverage: Data covers years 2000 to 2013.
Temporal Resolution: Annual
Study Area (All latitudes and longitudes are given in decimal degrees)
|
Site |
Westernmost Longitude |
Easternmost Longitude |
Northernmost Latitude |
Southernmost Latitude |
|---|---|---|---|---|
|
Global |
-180 |
180 |
90 |
-90 |
Data File Information
There are 56 comma-separated (.csv) files with this data set. The data files are arranged by year and further arranged by solids and gases. Files are further separated by average carbon fluxes per unit of total area and annual carbon fluxes summed over all types. There are four sets of 14 annual data files.
There are four NetCDF format (.nc4) files with this data set. Each file contains yearly flux estimates for the entire date range and for either solids or gases and either average carbon fluxes per unit of total area or annual carbon fluxes summed over all types.
Note that each NetCDF file contains the same data as the set of the 14 corresponding flux *.csv files.
|
.csv files |
NetCDF files |
|---|---|
|
|
|
|
FLUXES PER AREA One file per year (YYYY), 2000-2013. 14 files total for each solid or gas set of *.csv files. |
All years have been combined into one *.nc4 file. |
|
lvst_solids_gCm2_YYYY.csv |
Global_Livestock_Solids_Carbon_Flux_Per_Area_2000-2013.nc4 |
|
lvst_gases_gCm2_YYYY.csv |
Global_Livestock_Gases_Carbon_Flux_Per_Area_2000-2013.nc4 |
|
|
|
|
FLUXES PER GRIDCELL One file per year (YYYY), 2000-2013. 14 files total for each solid or gas set of *.csv files. |
All years have been combined into one *.nc4 file. |
|
lvst_solids_MgC_YYYY.csv |
Global_Livestock_Solids_Carbon_Flux_Per_Gridcell_2000-2013.nc4 |
|
lvst_gases_MgC_YYYY.csv
|
Global_Livestock_Gases_Carbon_Flux_Per_Gridcell_2000-2013.nc4 |
NetCDF Files:
The NetCDF format files are version 4 (*.nc4) with internal compression. Even so, the files range in size from 0.5 to 1.0 GB.
Variable definitions: The variables in each *.nc4 file are the same as the content of the corresponding set of *.csv files. For variables, descriptions, and units, please refer to the tables below.
Spatial Data Properties:
Spatial Representation Type: Raster
Pixel Depth: 32 bit
Pixel Type: float
Number of Bands: 14
Band Information: time
Raster Format: netCDF
No Data Value: -9999
Scale Factor: 1
Offset: none
Number Columns: 7200
Column Resolution: 0.05 degree
Number Rows: 3600
Row Resolution: 0.05 degree
Extent in the item's coordinate system
North: 90
South: -90
West: -180
East: 180
Spatial Reference Properties
xll corner: -179.975
yll corner: -89.975
Cell Geometry: area
Point in Pixel: center
Temporal Extent: Yearly data from 2000 through 2013
CSV files:
There are fifty-six data files provided in csv format (*.csv) of annual estimated carbon fluxes associated with global livestock, summed over all livestock types.
- In one set of files, spatial distribution of livestock carbon fluxes (g C/m2), the carbon fluxes distributed to each gridcell were divided by the gridcell total surface area, resulting in average emissions per m2 across the entire gridcell. As such, these fluxes per area are not additive.
- In another set of files, spatial distribution of livestock carbon fluxes (Mg C) per gridcell, these fluxes can be summed across multiple gridcells to obtain totals for any given areas (e.g. county, state, or national totals).
Note that each .csv file has 6,138,778 data rows and 1 row of column headings.
Data files and variable descriptions:
1.) Spatial Distribution of livestock carbon fluxes (g C/m2):
a.) There are 14 files that have the naming convention:
lvst_solids_gCm2_YYYY.csv
where YYYY = year 2000 - 2013
These files provide global annual carbon estimates in the annual amount of livestock feed intake (fodder and forage), and in livestock manure, as well as the standard deviations for those estimates. All quantities of carbon distributed to each grid cell were divided by the total grid cell area, resulting in average carbon fluxes per unit of total area, provided in gC/m2/yr. Variables, description, and units for these files:
|
Variable |
Description |
Units |
|---|---|---|
|
longitude |
Longitude at the center of the 0.05°x0.05°gridcell described in that row. Negative longitudes are west of the Prime Meridian. |
Decimal degrees |
|
latitude |
Latitude at the center of the 0.05°x0.05°gridcell described in that row. |
Decimal degrees |
|
feed_gCm2 |
Annual amount of livestock feed intake, including fodder and forage, distributed to the gridcell, in grams carbon per square meter of livestock area. |
g C m-2yr-1 |
|
feed_SD_gCm2 |
The standard deviation of livestock feed intake distributed to the gridcell, in grams carbon per square meter of livestock area. |
g C m-2yr-1 |
|
fodder_gCm2 |
Annual amount of livestock fodder intake distributed to the gridcell, in grams carbon per square meter of livestock area. |
g C m-2yr-1 |
|
fodder_SD_gCm2 |
Standard deviation of livestock fodder intake distributed to the gridcell, in grams carbon per square meter of livestock area. |
g C m-2yr-1 |
|
forage_gCm2 |
Annual amount of livestock forage distributed to the gridcell, in grams carbon per square meter of livestock area. |
g C m-2yr-1 |
|
forage_SD_gCm2 |
Standard deviation of livestock forage distributed to the gridcell, in grams carbon per square meter of livestock area. |
g C m-2yr-1 |
|
manure_gCm2 |
Amount of carbon in livestock manure production distributed to the gridcell, in grams carbon per square meter of livestock area. |
g C m-2yr-1 |
|
manure_SD_gCm2 |
Standard deviation of livestock manure carbon production distributed to the gridcell, in grams carbon per square meter of livestock area. |
g C m-2yr-1 |
b.) There are 14 files that have the naming convention:
lvst_gases_gCm2_YYYY
where YYYY = year 2000 - 2013
These files provide global annual estimates of carbon in CH4 emissions resulting from enteric fermentation and manure, and in CO2 resulting from livestock respiration and manure, as well as the standard deviation for those estimates. All quantities of carbon distributed to each grid cell were divided by the total grid cell area, resulting in average carbon fluxes per unit of total area, provided in gC/m2/yr. Variables, description, and units for these files:
|
Variable |
Description |
Units |
|---|---|---|
|
longitude |
Longitude at the center of the 0.05°x0.05°gridcell described in that row. Negative longitudes are west of the Prime Meridian. |
Decimal degrees |
|
latitude |
Latitude at the center of the 0.05°x0.05°gridcell described in that row. |
Decimal degrees |
|
efCH4_gCm2 |
Livestock enteric fermentation CH4-C emissions per gridcell surface area, in grams carbon per square meter of livestock area. |
g C m-2yr-1 |
|
efCH4_SD_gCm2 |
Standard deviation of livestock enteric fermentation CH4-C per gridcell surface area, in grams carbon per square meter of livestock area. |
g C m-2yr-1 |
|
mmCH4_gCm2 |
Livestock manure management CH4-C emissions per gridcell surface area, in grams carbon per square meter of livestock area. |
g C m-2yr-1 |
|
mmCH4_SD_gCm2 |
Standard deviation of livestock manure management CH4-C emissions per gridcell surface area, in grams carbon per square meter of livestock area. |
g C m-2yr-1 |
|
totCH4_gCm2 |
Total livestock CH4-C emissions per gridcell surface area, in grams carbon per square meter of livestock area. Includes manure management and enteric fermentation CH4-C emissions. |
g C m-2yr-1 |
|
totCH4_SD_gCm2 |
Standard deviation of total livestock CH4-C emissions per gridcell surface area, in grams carbon per square meter of livestock area. |
g C m-2yr-1 |
|
rspCO2_gCm2 |
Amount of livestock respiration CO2-C emissions per gridcell surface area, in grams carbon per square meter of livestock area. |
g C m-2yr-1 |
|
rspCO2_SD_gCm2 |
Standard deviation of livestock respiration CO2-C emissions per gridcell surface area, in grams carbon per square meter of livestock area. |
g C m-2yr-1 |
|
mmCO2_gCm2 |
Amount of manure management CO2-C per gridcell surface area, in grams carbon per square meter of livestock area. |
g C m-2yr-1 |
|
mmCO2_SD_gCm2 |
Standard deviation of manure management CO2-C emissions per gridcell surface area, in grams carbon per square meter of livestock area. |
g C m-2yr-1 |
|
totCO2_gCm2 |
Total livestock CO2-C emissions per gridcell surface area, in grams carbon per square meter of livestock area. Includes CO2-C from manure management and livestock respiration. |
g C m-2yr-1 |
|
totCO2_SD_gCm2 |
Standard deviation of total livestock CO2-C emissions per gridcell surface area, in grams carbon per square meter of livestock area. |
g C m-2yr-1 |
2,) Spatial Distribution of livestock carbon fluxes (Mg C) per gridcell
a.) There are 14 files with the naming convention:
lvst_solids_MgC_YYYY
where YYYY = year 2000 - 2013
These files provide global annual carbon estimates in the annual amount of livestock feed intake (fodder and forage), and in livestock manure, as well as the standard deviations for those estimates, distributed to the gridcells, provided in Mg C/yr. Variables, description, and units for these files:
|
Variables |
Description |
Units |
|---|---|---|
|
longitude |
Longitude at the center of the 0.05°x0.05°gridcell described in that row. Negative longitudes are west of the Prime Meridian. |
Decimal degrees |
|
latitude |
Latitude at the center of the 0.05°x0.05°gridcell described in that row. |
Decimal degrees |
|
lvstk_km2 |
The area assigned to livestock per gridcell |
km2 |
|
feed_MgC |
Annual amount of livestock feed intake, including fodder and forage, distributed to the gridcell, in megagrams carbon. |
Mg C yr-1 |
|
feed_SD_MgC |
The standard deviation of livestock feed intake distributed to the gridcell, in megagrams carbon. |
Mg C yr-1 |
|
fodder_MgC |
Annual amount of livestock fodder intake distributed to the gridcell, in megagrams carbon. |
Mg C yr-1 |
|
fodder_SD_MgC |
Standard deviation of livestock fodder intake distributed to the gridcell, in megagrams carbon. |
Mg C yr-1 |
|
forage_MgC |
Annual amount of livestock forage distributed to the gridcell, in megagrams carbon. |
Mg C yr-1 |
|
forage_SD_MgC |
Standard deviation of livestock forage distributed to the gridcell, in megagrams carbon. |
Mg C yr-1 |
|
manure_MgC |
Amount of carbon in livestock manure production distributed to the gridcell, in megagrams carbon. |
Mg C yr-1 |
|
manure_SD_MgC |
Standard deviation of livestock manure carbon production distributed to the gridcell, in megagrams carbon. |
Mg C yr-1 |
b.) There are 14 files with the naming convention:
lvst_gases_MgC_YYYY
where YYYY = year 2000 - 2013
This file provides global gridded annual estimates of carbon in CH4 emissions resulting from enteric fermentation and manure, and in CO2 resulting from livestock respiration and manure, as well as the standard deviation for those estimates; distributed in the grid cell, provided in megagrams of carbon per year (Mg C/yr). Variables, description, and units for these files:
|
Heading |
Description |
Units |
|---|---|---|
|
longitude |
Longitude at the center of the 0.05°x0.05°gridcell described in that row. Negative longitudes are west of the Prime Meridian. |
Decimal degrees |
|
latitude |
Latitude at the center of the 0.05°x0.05°gridcell described in that row. |
Decimal degrees |
|
lvstk_km2 |
The area assigned to livestock per gridcell. |
km2 |
|
efCH4_MgC |
Livestock enteric fermentation CH4-C emissions distributed to the gridcell, in megagrams carbon. |
Mg C yr-1 |
|
efCH4_SD_MgC |
Standard deviation of livestock enteric fermentation CH4-C distributed to the gridcell, in megagrams carbon. |
Mg C yr-1 |
|
mmCH4_MgC |
Livestock manure management CH4-C emissions distributed to the gridcell, in megagrams carbon. |
Mg C yr-1 |
|
mmCH4_SD_MgC |
Standard deviation of livestock manure management CH4-C emissions distributed to the gridcell, in megagrams carbon. |
Mg C yr-1 |
|
totCH4_MgC |
Total livestock CH4-C emissions distributed to the gridcell, in megagrams carbon. Includes manure management and enteric fermentation CH4-C emissions. |
Mg C yr-1 |
|
totCH4_SD_MgC |
Standard deviation of total livestock CH4-C emissions distributed to the gridcell, in megagrams carbon. |
Mg C yr-1 |
|
rspCO2_MgC |
Amount of livestock respiration CO2-C emissions distributed to the gridcell, in megagrams carbon. |
Mg C yr-1 |
|
rspCO2_SD_MgC |
Standard deviation of livestock respiration CO2-C emissions distributed to the gridcell, in megagrams carbon. |
Mg C yr-1 |
|
mmCO2_MgC |
Amount of manure management CO2-C distributed to the gridcell, in megagrams carbon. |
Mg C yr-1 |
|
mmCO2_SD_MgC |
Standard deviation of manure management CO2-C emissions distributed to the gridcell, in megagrams carbon. |
Mg C yr-1 |
|
totCO2_MgC |
Total livestock CO2-C emissions distributed to the gridcell, in megagrams carbon. Includes CO2-C from manure management and livestock respiration. |
Mg C yr-1 |
|
totCO2_SD_MgC |
Standard deviation of total livestock CO2-C emissions distributed to the gridcell, in megagrams carbon. |
Mg C yr-1 |
Application and Derivation
For derivation of livestock carbon fluxes at the sub-national level and modeled at a 0.05°x 0.05° gridcell level, see Wolf et al. (2017). These flux estimates were based on livestock populations reported by FAO and USDA NASS, on coefficients provided by the IPCC, and on additional coefficients developed by Wolf et al. (2017). The livestock populations used are constrained at the national level for most nations; at the state or province level for Argentina, Brazil, Canada, Chile, China, India, Kazakhstan, Mexico, and Russia; and at the county level for the United States. The method subtracts revised estimated enteric fermentation methane (CH4) emissions, manure production, and milk and egg production from revised estimated total feed intake, to obtain the quantity of carbon respired as carbon dioxide, and subtracts revised manure management CH4 emissions from total manure production to estimate carbon dioxide emissions due to manure management. Annual fodder (i.e. feed provided to animals by humans) intake per nation for the years 2000 – 2011 was derived from i) FAO reports of available market feeds and ii) hay and fodder crop harvests, and iii) estimated crop residues collected for feed (Wolf et al., 2017). Reports of available fodder items were not available for later years, so 2012 and 2013 were preliminarily estimated assuming the quantities available in 2011. Annual forage intake (i.e. grazing and/or scavenging by ranging animals) was estimated as the difference between total feed intake and fodder intake. Coefficients used and detailed information can be seen in Wolf et al. (2017). All fluxes are presented in units of carbon, e.g. the amount of carbon contained in gaseous methane (CH4-C) or carbon dioxide (CO2-C) emissions.
The spatial distribution of these fluxes may be used for global carbon monitoring, estimation of regional uncertainty, and as input to Earth system models.
Quality Assessment
Uncertainty analysis
The mode, minimum and maximum likely values for each estimation parameter were used to develop normal or skewed normal probability density functions (PDFs), and Monte Carlo analysis was conducted on the complete estimation model.
Data Acquisition, Materials, and Methods
The flux estimates were based on livestock populations reported by the FAO and the USDA NASS, on coefficients provided by the IPCC, and on additional coefficients developed by Wolf et al. (2017). The livestock populations used are constrained at the national level for most nations; at the state or province level for Argentina, Brazil, Canada, Chile, China, India, Kazakhstan, Mexico, and Russia; and at the county level for the United States.
Estimating livestock intake and emissions
Livestock carbon emissions were estimated based on annual livestock feed consumption, enteric fermentation, and manure management. Annual livestock populations of meat and milk-producing cattle, meat and milk-producing buffaloes, meat and egg-laying chickens, swine, sheep, turkeys, ducks, geese and guinea fowl, goats, horses, mules, asses, camels, and other camelids (i.e. llamas and alpacas) were compiled for years 1961-2011 from FAOSTAT (FAO, 2013). Annual producing populations of egg-laying chickens and milk-producing cattle and buffalo were subtracted from conspecific total populations to estimate populations raised for meat production. For ten large nations, subnational livestock population data reported by each nation were compiled for available years between 2000- 2011 (USDA 2013; FAO 2014b), and the proportions of national populations present in each state or province were used to improve the spatial distribution of inventory data.
Accounting of livestock carbon fluxes was conducted similar to methods used by IPCC (2006), EPA (2010), and West et al. (2011). The method subtracts revised estimated enteric fermentation methane (CH4) emissions, manure production, and milk and egg production from revised estimated total feed intake, to obtain the quantity of carbon respired as carbon dioxide, and subtracts revised manure management CH4 emissions from total manure production to estimate carbon dioxide emissions due to manure management
Estimating livestock consumption of fodder and forage
For purposes of tracking the use of all harvested crop carbon and estimating amounts of livestock forage, total livestock feed was disaggregated into fodder (i.e. biomass harvested by humans from croplands) and forage (i.e. biomass grazed or scavenged by livestock from non-cropland sources).
Fodder was further subdivided into (i) market feed items derived from primary harvests (e.g., grains, brans, crop byproduct feeds), (ii) hay and fodder crops (e.g., harvested quantities of alfalfa, clovers, grasses, corn and sorghum silage), and (iii) crop residue feed, consisting of crop stover collected from the field for livestock feed. Annual national quantities of all market feed items available, including imports, are reported by FAOSTAT (FAO, 2014a). These quantities were converted into units of carbon, using fractional dry weight and carbon contents. Crop residue feed quantities were estimated by applying crop-specific regional percentages of residues collected for feed (Krausmann et al., 2008; Wolf et al., 2017) to the crop- and country-specific estimates of annual residue production. Total annual fodder intake per nation is the sum of market feeds, hay and fodder crop production, and crop residues collected for feed. At the national level, annual fodder intake was subtracted from total livestock feed to estimate the livestock forage intake, including grazing and scavenging.
Spatial distribution of carbon fluxes
To estimate carbon uptake and emissions at a subnational scale, crop carbon data was downscaled and spatially distributed to 0.05-degree resolution using the MODIS Land Cover Type 5, version 5.1 MCD12Q1 data product, following methods documented by West et al. (2014). Native 500-m MODIS data was initially gridded to 0.05-degree resolution, commensurate with the MODIS MCD12C1 product for climate modeling.
Data Access
These data are available through the Oak Ridge National Laboratory (ORNL) Distributed Active Archive Center (DAAC).
CMS: Global Carbon Fluxes Associated with Livestock Feed and Emissions, 2000-2013
Contact for Data Center Access Information:
- E-mail: uso@daac.ornl.gov
- Telephone: +1 (865) 241-3952
References
EPA (2010), Inventory of U.S. Greenhouse Gas Emissions and Sinks: 1990–2008 Reports and Assessments, U.S. Environmental Protection Agency, Climate Change Division, Washington, D. C.
FAO (2014a), Food and Agriculture Organization of the United Nations Statistics Division (FAOSTAT), Available from: http://faostat.fao.org/ (Accessed 1 September 2014)
FAO (2014b), Global Livestock Production and Health Atlas (GLiPHA), Food Agric. Organ. U. N. Anim. Prod. Health Div. Glob. Livest. Prod. Health Atlas GLiPHA. Available from: 584 http://kids.fao.org/glipha/ (Accessed 1 January 2014).
FAO (2013), Food and Agriculture Organization of the United Nations Statistics Division (FAOSTAT), Available from: http://faostat.fao.org/ (Accessed 2 December 2013).
Intergovernmental Panel on Climate Change (IPCC) (2006), IPCC Guidelines for National Greenhouse Gas Inventories, Volume 4: Agriculture, Forestry and Other Land Use, Inst. for Global Environmental Strategies, Kanagawa, Japan.
Krausmann, F., K.-H. Erb, S. Gingrich, C. Lauk, and H. Haberl (2008), Global patterns of socioeconomic biomass flows in the year 2000: A comprehensive assessment of supply, consumption and constraints, Ecol. Econ., 65(3), 471-487, doi:10.1016/j.ecolecon.2007.07.012.
United States Department of Agriculture National Agricultural Statistics Service (USDA NASS) (2013), Quickstats 2.0, Available from: http://quickstats.nass.usda.gov/ (Accessed 26 November 2013)
West, T. O., V. Bandaru, C. C. Brandt, A. E. Schuh, and S. M. Ogle (2011), Regional uptake and release of crop carbon in the United States, Biogeosciences, 8(8), 2037–2046, doi:10.5194/bg-8-2037-2011.
West, T. O., Y. L. Page, M. Huang, J. Wolf, and A. M. Thomson (2014), Downscaling global land cover projections from an integrated assessment model for use in regional analyses: results and evaluation for the US from 2005 to 2095, Environ. Res. Lett., 9(6), 064004, doi:10.1088/1748-9326/9/6/064004.
Wolf, J., G. Asrar, and T. O. West. 2017. Revised Methane Emissions Factors and Spatially Distributed Annual Carbon Fluxes for Global Livestock. Carbon Balance and Management. DOI: 10.1186/s13021-017-0084-y
Data Set Revisions
In November 2017, four NetCDF format files were added to this data set. Each file contains yearly flux estimates for the entire 2000-2013 date range and for either solids or gases and either average carbon fluxes per unit of total area or annual carbon fluxes summed over all types. Each NetCDf file contains the same data as the set of the 14 corresponding yearly flux *.csv files. The variables, values, descriptions, and units are unchanged.