Get Data
Revision Date: June 30, 2014
Notice: This data set and guide were updated on June 30, 2014 to correct an error in the reported units. The data values were not changed.
Summary:
Spatially-gridded estimates of above ground biomass (AGB), net primary productivity (NPP), and net ecosystem productivity (NEP) are provided for forested areas of the conterminous United States. Estimates of uncertainty are also provided for AGB and NEP. These data were derived by using Forest Inventory and Analysis (FIA) data to constrain forest growth rates in a Carnegie-Ames-Stanford Approach (CASA) carbon-cycle process model. Note that the data set does not include data for forests in the Northern Prairie States region (NPS; see Figure 3).
These data provide a detailed estimate of carbon sources and sinks from recent forest disturbance and recovery across regions and forest types of the US.
The data are presented as a series of ten NetCDF v4 (*.nc4) files at two spatial scales (1-degree and 5-km spatial resolution) for the nominal year of 2005.
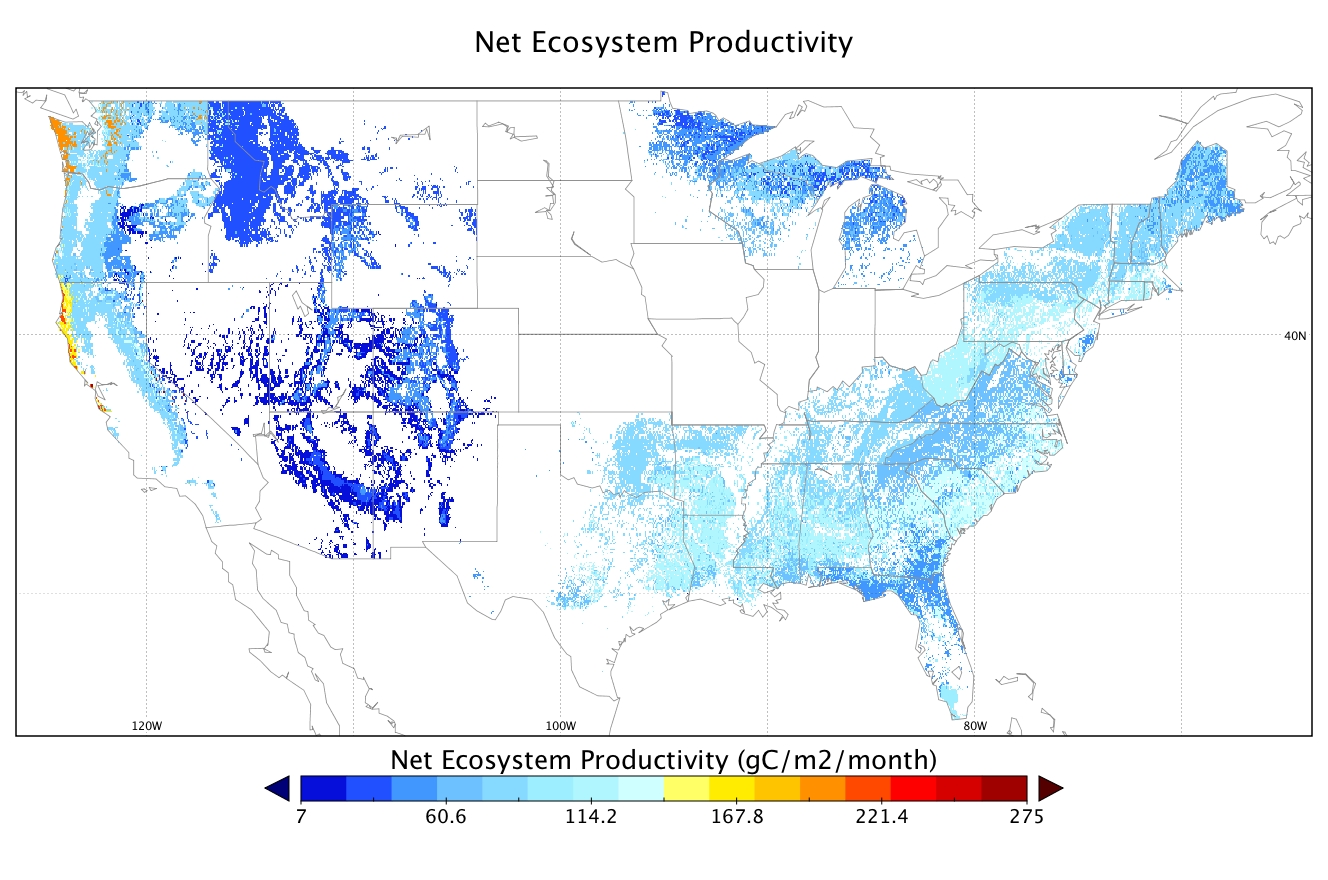
Figure 1. Estimated Net Ecosystem Productivity (NEP) of Forests in year 2005 at 5-km resolution.
Data Citation:
Cite this data set as follows:
Collatz, G.J., C. Williams, B. Ghimire, S. Goward, and J. Masek. 2014. CMS: Forest Biomass and Productivity, 1-degree and 5-km, Conterminous US, 2005. ORNL DAAC, Oak Ridge, Tennessee, USA. < a href="http://dx.doi.org/10.3334/ORNLDAAC/1221"> http://dx.doi.org/10.3334/ORNLDAAC/1221
Table of Contents:
- 1 Data Set Overview
- 2 Data Characteristics
- 3 Applications and Derivation
- 4 Quality Assessment
- 5 Acquisition Materials and Methods
- 6 Data Access
- 7 References
1. Data Set Overview:
Project: Carbon Monitoring System (CMS)
Investigators: G. James Collatz (jim.collatz@nasa.gov), Christopher Williams (CWilliams@clarku.edu), Bardan Ghimire (bghimire@clarku.edu), Samuel Goward (sgoward@umd.edu ), and Jeff Masek (Jeffrey.G.Masek@nasa.gov).
The CMS is designed to make significant contributions in characterizing, quantifying, understanding, and predicting the evolution of global carbon sources and sinks through improved monitoring of carbon stocks and fluxes. The System will use the full range of NASA satellite observations and modeling/analysis capabilities to establish the accuracy, quantitative uncertainties, and utility of products for supporting national and international policy, regulatory, and management activities. CMS will maintain a global emphasis while providing finer scale regional information, utilizing space-based and surface-based data.
Spatially-gridded estimates of above ground biomass (AGB), net primary productivity (NPP), and net ecosystem productivity (NEP) are provided for forested areas of the conterminous US. Estimates of uncertainty are also provided for AGB and NEP. These data were derived by using FIA data to constrain forest growth rates in a CASA carbon-cycle process model (Potter et al., 1993; Randerson et al., 1996). Note that the data set does not include forests in the Northern Prairie States region (NPS; see Figure 3) because the effort was originally connected to a Landsat remote sensing analysis whose random sample did not draw Landsat scenes for this region.
These data provide a detailed estimate of carbon sources and sinks from recent forest disturbance and recovery across regions and forest types of the US (see Williams et al., 2012).
2. Data Characteristics:
Data are presented as ten NetCDF v4 files (*.nc4), one for each combination of parameter (AGB, AGB standard error, NPP, NEP, or NEP standard error) and spatial resolution (1 degree or 5 km) over the continental USA (Table 2). Each file contains data for one year (2005). Grid cells with no data (fill value or missing values) are represented by “NaN”.
Spatial Coverage
Site boundaries: (All latitude and longitude given in degrees and fractions)
| Site (Region) | Westernmost Longitude | Easternmost Longitude | Northernmost Latitude | Southernmost Latitude |
|---|---|---|---|---|
| Conterminous USA | -129.0 | -65.0 | 52.0 | 21.0 |
Spatial Resolution
Grid cells at either 1 degree (approx. 111 km x 111 km at Equator) or 5-km resolution.
Time period
The data set has no explicit temporal component. Data are nominally for the year 2005/01/01 to
2005/12/31.
Temporal Coverage
Annual (assumed to represent the midpoint of the year).
Data File Information
Table 2. Data File Information
| FILE NAME | SPATIAL RESOLUTION | PARAMETER | UNITS |
|---|---|---|---|
| agb_1deg.nc4 | 1 degree | Aboveground live biomass | kgC/m2 |
| agb_SE_1deg.nc4 | 1 degree | Standard error per grid cell of aboveground live biomass | kgC/m2 |
| nep_1deg.nc4 | 1 degree | Net ecosystem productivity | gC/m2/month |
| nep_SE_1deg.nc4 | 1 degree | Standard error per grid cell of net ecosystem productivity | gC/m2/month |
| npp_1deg.nc4 | 1 degree | Net primary productivity | gC/m2/month |
| agb_5k.nc4 | 5 km | Above ground live biomass | kgC/m2 |
| agb_SE_5k.nc4 | 5 km | Standard error per grid cell of aboveground live biomass | kgC/m2 |
| nep_5k.nc4 | 5 km | Net ecosystem productivity | gC/m2/month |
| nep_SE_5k.nc4 | 5 km | Standard error per grid cell of net ecosystem productivity | gC/m2/month |
| npp_5k.nc4 | 5 km | Net primary productivity | gC/m2/month |
3. Data Application and Derivation:
These data can be compared to other estimates of carbon stocks and fluxes at the continental scale to help clarify sources of inconsistencies across studies (see Williams et al. 2012). This data and general approach was extended to include fire disturbance effects in the western US (Ghimire et al., 2012).
4. Quality Assessment:
The authors conducted a formal analysis of uncertainty following methods described in the IPCC Good Practice Guide (see Williams et al. 2012, Text S1). Uncertainty in the data set derives from multiple factors, including, but not limited to: sampling errors for forested area and total aboveground biomass, conversion of tree volume to carbon, and the parameterization of light, moisture, and temperature sensitivity of heterotrophic respiration and/or NPP as expressed in the CASA model. Spatially-gridded estimates of standard error for AGB and NEP, at both 1 degree and 5 km spatial resolution, are provided as part of the data set.
The authors found that absolute uncertainty surrounding NEP tends to peak when forest uptake is maximum and then diminishes with forest age (see Williams et al. 2012, Figure 3). The timing of NEP crossover from source to sink is surprisingly insensitive to variability in biomass accumulation, and generally occurs at ages <20 years. Analysis of the sensitivity of the CASA model to parameters revealed that nearly all of the sensitivities are less than 1% indicating general dampening of parameter perturbations and suggesting that uncertainties in these parameterizations do not expand as they propagate through to modeled NEP (see Williams et al. 2012, Text S1).
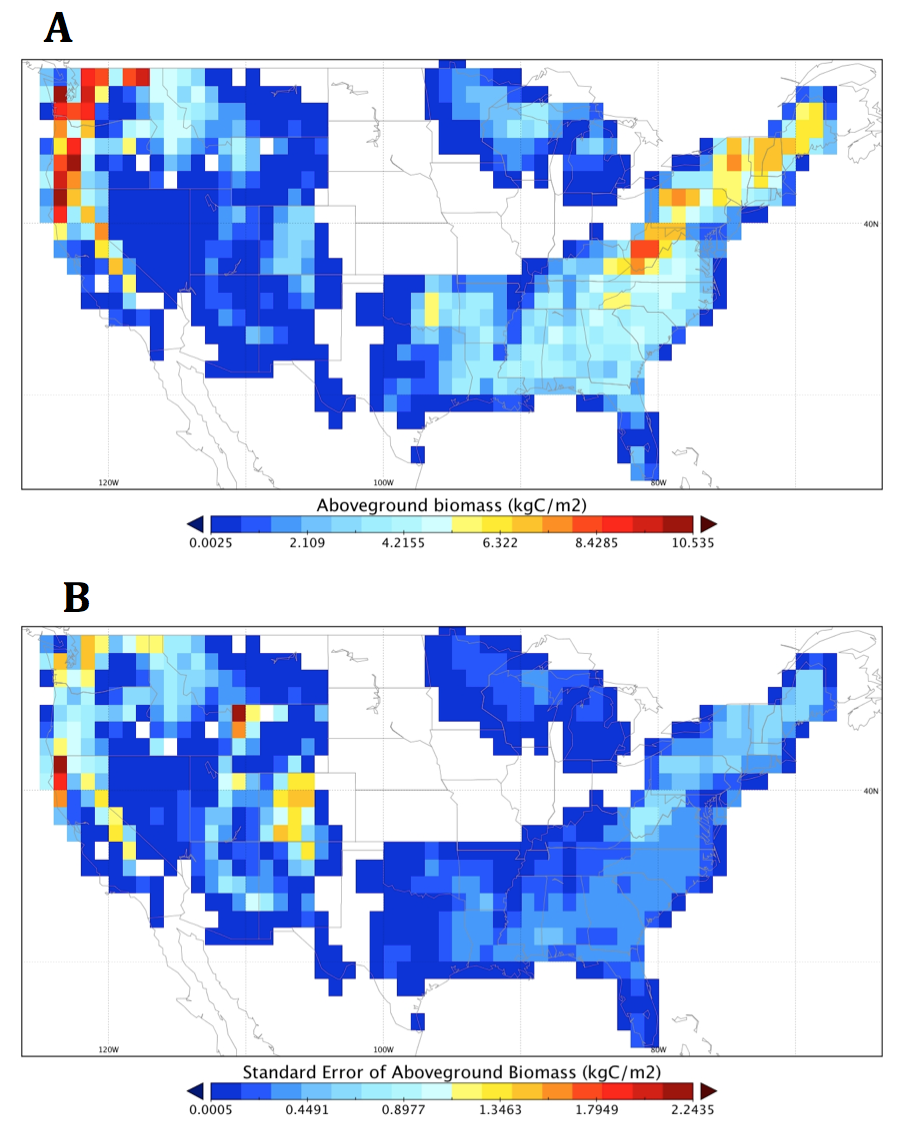
Figure 2. A) Estimated aboveground biomass (AGB) of forests in year 2005 at 1-degree resolution. B) Standard error per grid cell of AGB at 1-degree resolution.
5. Data Acquisition Materials and Methods:
This data set of AGB, NPP, and NEP for the conterminous United States was derived from FIA forest age, type, and biomass data. The modeling approach utilized the national forest inventory data (and uncertainties) to constrain the forest disturbance and recovery processes represented in an ecosystem carbon cycle model to obtain regional and national estimates of carbon consequences. The basic method can be described as having two main steps.
First, stand age, biomass per unit area, productivity class, and forest type data were acquired from FIA data at the USFS National Inventory and Monitoring Applications Center for 9 regions encompassing the conterminous US (Figure 3). The investigators derived forest type and climate specific post-disturbance NEP trajectories by fitting a first-order terrestrial carbon cycle model (CASA) to grow wood stocks consistent with the FIA data. The Carnegie-Ames-Stanford-Approach – Global Fire Emissions Database version 3 (CASA-GFED3) derives from Potter et al. (1993), diverging in development since Randerson et al, (1996). CASA is a light use efficiency type model: NPP is expressed as the product of photosynthetically active solar radiation, a light use efficiency parameter, scalars that capture temperature and moisture limitations, and fractional absorption of solar radiation by the vegetation canopy. The CASA carbon cycle model was calibrated to FIA biomass versus age relationships for different geographical regions, forest types, and productivity levels. A Monte Carlo procedure was used to sample each biomass-age trajectory providing means and standard deviations of \ fluxes and pools.
Second, these characteristic trajectories were applied to landscapes with forest age maps obtained from FIA age distributions to derive maps of NEP and above ground biomass. As such, this approach corresponds to the age-accumulation method for estimating forest carbon sinks. These fluxes and pool sizes reflect the age structure of the forests and do not include effects of climate trends or growth enhancements from N or CO2 fertilization. Results represent a summary of carbon dynamics of forested ecoregions across the conterminous US.
A full description of the procedure and analyses of results are provided in Williams et al. (2012).
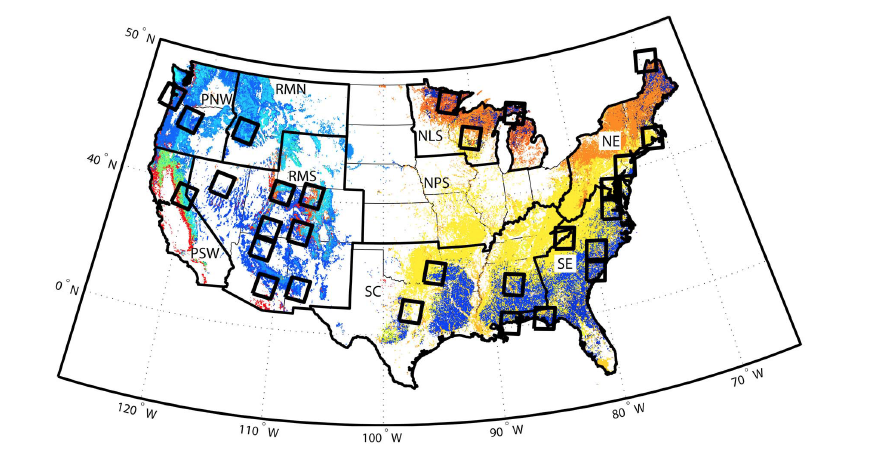
Figure 3. Conterminous US distribution of forest type groups (colors). Thick state boundaries trace nine regions from the US Forest Service Resource Planning Act Assessment. Note that the data set does not include data for forests in the Northern Prairie States region (NPS). Rectangles represent areas where gridded climate and phenology were used in the simulation of fluxes and stocks for each forest type within each rectangle (from Figure 2 in Williams et al. 2012).
6. Data Access:
This data is available through the Oak Ridge National Laboratory (ORNL) Distributed Active Archive Center (DAAC).
Data Archive Center:
Contact for Data Center Access Information:
E-mail: uso@daac.ornl.gov
Telephone: +1 (865) 241-3952
7. References:
Denning, A.S. (editor) 2005. Science Implementation Strategy for the North American Carbon Program. Report of the NACP Implementation Strategy Group of the U.S. Carbon Cycle Interagency Working Group. Washington, DC: U.S. Carbon Cycle Science Program, 68 pp. http://www.carboncyclescience.gov
Ghimire B., C.A. Williams, G.J. Collatz, and M. Vanderhoof. 2012. Fire-induced carbon emissions and regrowth uptake in western U.S. forests: Documenting variation across forest types, fire severity, and climate regions. Journal of Geophysical Research-Biogeosciences 117, doi: 10.1029/2011JG001935
Potter, C.S., J.T. Randerson, C.B. Field, P.A. Matson, P.M. Vitousek, H.A. Mooney, and S.A. Klooster. 1993. Terrestrial Ecosystem Production: A process model based on global satellite and surface data. Global Biogeochem. Cycles, 7: 811-841, doi:10.1029/93GB02725
Randerson, J.T., M.V. Thompson, C.M. Malmstrom, C.B. Field, and I.Y. Fung. 1996. Substrate limitations for heterotrophs: Implications for models that estimate the seasonal cycle of atmospheric CO2. Global Biogeochem. Cycles, 10: 585-602, doi:10.1029/96GB01981.
U.S. Environmental Protection Agency (EPA). 2008. Inventory of U.S. greenhouse gas emissions and sinks: 1990–2006, 394 pp., Washington, D. C.
Williams, C.A., G.J. Collatz, J. Masek, and S.N. Goward 2012. Carbon consequences of forest disturbance and recovery across the conterminous United States, Global Biogeochem. Cycles, 26, GB1005, doi:10.1029/2010GB003947.
Wofsy, S.C., and R.C. Harris. 2002. The North American Carbon Program (NACP). Report of the NACP Committee of the US Interagency Carbon Cycle Science Program, US Global Change Research Program.