Get Data
Summary:
This data set provides global gridded estimates of atmospheric deposition of total inorganic nitrogen (N), NHx (NH3 and NH4+), and NOy (all oxidized forms of nitrogen other than N2O), in mg N/m2/year, for the years 1860 and 1993 and projections for the year 2050. The data set was generated using a global three-dimensional chemistry-transport model (TM3) with a spatial resolution of 5 degrees longitude by 3.75 degrees latitude (Jeuken et al., 2001; Lelieveld and Dentener, 2000). Nitrogen emissions estimates (Van Aardenne et al., 2001) and projection scenario data (IPCC, 1996; 2000) were used as input to the model. The model output grids were subdivided into 50 km x 50 km sub-grids to create spatially defined deposition maps. The gridded data were assigned to continental and marine regions using boundaries delineated on a world data coverage from ESRI (1993).
The data are stored as ASCII text files (.txt), in tab-delimited format, with a spatial resolution of 5 degrees longitude by 3.75 degrees latitude. The data can be used to produce maps that illustrate both the temporal and spatial variability of atmospheric deposition of N, NHx, and NOy as well as the degree of alteration and regional heterogeneity in deposition through time. Nine data files are provided to produce the following maps:
Global N Deposition (1860, 1993, and 2050)
Global NHx Deposition (1860, 1993, and 2050)
Global NOy Deposition (1860, 1993, and 2050)
Also included as data files are GeoTIFF format files (Tagged Image File Format) created from the nine nitrogen deposition data files. A world file of projection information (*.twf ) is included for each GeoTIFF file.
Data Citation:
Cite this data set as follows:
Dentener, F. J. 2006. Global Maps of Atmospheric Nitrogen Deposition, 1860, 1993, and 2050. Data set. Available on-line [http://daac.ornl.gov/] from Oak Ridge National Laboratory Distributed Active Archive Center, Oak Ridge, Tennessee, U.S.A. doi:10.3334/ORNLDAAC/830.
Additional citation for this data set:
Galloway, J. N., F. J. Dentener, D. G. Capone, E. W. Boyer, R. W. Howarth, S. P. Seitzinger, G. P. Asner, C. Cleveland, P. Green, E. Holland, D. M. Karl, A. F. Michaels, J. H. Porter, A. Townsend, and C. Vörösmarty. 2004. Nitrogen Cycles:ast, Present and Future. Biogeochemistry 70: 153-226.
References:
ESRI. 1993. Digital Chart of the World. Environmental Systems Research Institute, Inc., Redlands, California.
Galloway, J. N., F. J. Dentener, D. G. Capone, E. W. Boyer, R. W. Howarth, S. P. Seitzinger, G. P. Asner, C. Cleveland, P. Green, E. Holland, D. M. Karl, A. F. Michaels, J. H. Porter, A. Townsend, and C. Vörösmarty. 2004. Nitrogen Cycles: Past, Present and Future. Biogeochemistry 70: 153-226.
IPCC. 1996. Climate Change 1995: The Science of Climate Change. Contribution of Working Group I to the Second Assessment Report of the Intergovernmental Panel on Climate Change. Houghton, J. J., L. G. Meiro Filho, B. A. Callander, N. Harris, A. Kattenberg, and K. Maskell (eds.). Cambridge University Press, Cambridge and New York, 572 pp.
IPCC. 2000. Special Report on Emissions Scenarios (SRES). A Special Report of Working Group III of the Third Assessment Report of the Intergovernmental Panel on Climate Change. Nakicenovic, N. and R. Swart (eds.). Cambridge University Press, Cambridge, United Kingdom, 612 pp.
Jeuken, A., P. Veefkind, F. Dentener, S. Metzger, and C. Robles-Gonzalez. 2001. Simulation of the aerosol optical depth over Europe for August 1997 and a comparison with observations. Journal of Geophysical Research, 106: 28295-28311.
Lelieveld J. and F. Dentener. 2000. What controls tropospheric ozone? J. Geophys. Res. 105: 3531-3551.
Van Aardenne, J. A., F. J. Dentener, J. G. J. Olivier, C. G. M. Klein Goldewijk, and J. Lelieveld. 2001. A 1ox1o resolution data set of historical anthropogenic trace gas emissions for the period 1890-1990. Global Biogeochem. Cycles, 15(4): 909-928.
Data Format:
The data are stored as ASCII text files (.txt), in tab-delimited format. The data values are model outputs provided as annual means (mg N/m2/y) in arrays of dimension IM x JM, where IM is the number of longitudes (72) and JM is the number of latitudes (48). Each data file contains 10 columns and 346 rows with a resolution of 5 degrees longitude by 3.75 degrees latitude. The data files are organized by nitrogen species by year.
Also included as data files are GeoTIFF format files (Tagged Image File Format) created from the nine nitrogen deposition data files. A world file of projection information (*.twf ) is included for each GeoTIFF file.
Sample Data Records: NHx-deposition1860.txt
NHx-deposition mg N/m2/year im = 72 jm = 48 year1860
0.08 0.08 0.08 0.08 0.08 0.08 0.08 0.08 0.08 0.08
0.08 0.08 0.08 0.08 0.08 0.08 0.08 0.08 0.08 0.08
0.08 0.08 0.08 0.08 0.08 0.08 0.08 0.08 0.08 0.08
0.08 0.08 0.08 0.08 0.08 0.08 0.08 0.08 0.08 0.08
0.08 0.08 0.08 0.08 0.08 0.08 0.08 0.08 0.08 0.08
0.08 0.08 0.08 0.08 0.08 0.08 0.08 0.08 0.08 0.08
0.08 0.08 0.08 0.08 0.08 0.08 0.08 0.08 0.08 0.08
0.08 0.08 0.32 0.39 0.47 0.78 0.88 0.6 0.17 0.09
0.09 0.1 0.12 0.14 0.17 0.2 0.27 0.27 0.2 0.16
0.13 0.13 0.14 0.14 0.25 0.36 0.27 0.1 0.08 0.08
...Data Users Please Note:
In all data files, the firstdata value corresponds to a location centered at 90 S, 180 W. The values proceed from west to east.
In all data files, the lastdata value corresponds to a location centered at 90 N, 180 E.
Sample Maps:
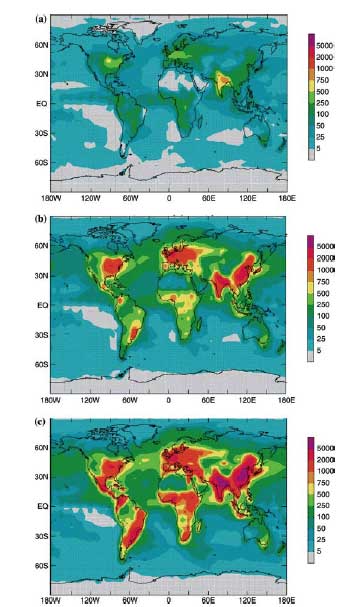
Spatial patterns of total inorganic nitrogen deposition in (a) 1860, (b) early 1990s, and (c) 2050, mg N/m2/y (Source: Galloway et al., 2004).
Additional information about the data format, methodology, and data quality is found in the companion file: http://daac.ornl.gov/daacdata/global_climate/global_N_deposition_maps/comp/global_N_deposition_maps_readme.pdf
Document Information:
2006/1/12
Document Review Date:
2006/1/12
Document Curator:
webmaster@www.daac.ornl.gov