Documentation Revision Date: 2016-01-21
Data Set Version: 1
Summary
There are three (3) data files in tabular format (*.csv) presenting the tower-based measurements, one (1) file (*.csv) of CARVE airborne measurements, and one (1) file (*.csv) of synthesized regional CH4 fluxes. In addition, there are 3,684 netCDF (*.nc) files providing the gridded footprint output from the WRF-STILT simulations corresponding to the CARVE airborne measurements.
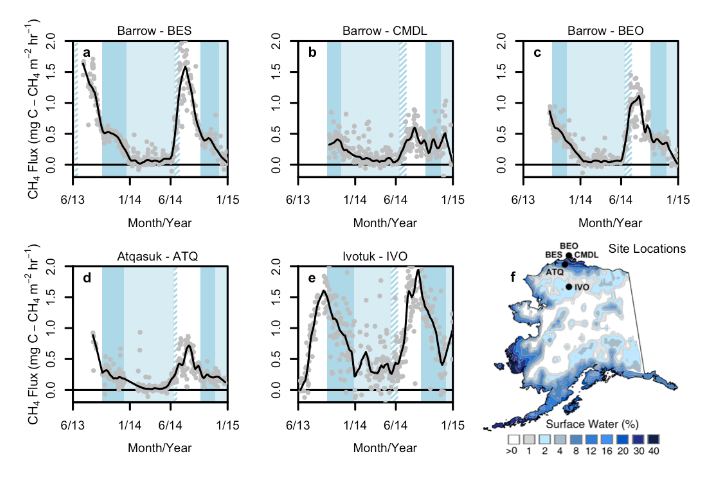
Figure 1. Methane flux measured at five sites on the North Slope of Alaska (from Zona et al, 2015, Fig 1).
Citation
Zona, D., W. Oechel, C.E. Miller, S.J. Dinardo, R. Commane, J.O.W. Lindaas, R.Y-W. Chang, S.C. Wofsy, C. Sweeney, and A. Karion. 2016. CARVE-ARCSS: Methane Loss From Arctic- Fluxes From the Alaskan North Slope, 2012-2014. ORNL DAAC, Oak Ridge, Tennessee, USA. http://dx.doi.org/10.3334/ORNLDAAC/1300
Table of Contents
- Data Set Overview
- Data Characteristics
- Application and Derivation
- Quality Assessment
- Data Acquisition, Materials, and Methods
- Data Access
- References
Data Set Overview
Project: Carbon in Arctic Reservoirs Vulnerability Experiment (CARVE)
Carbon in Arctic Reservoirs Vulnerability Experiment (CARVE) is collecting detailed measurements of important greenhouse gases on local to regional scales in the Alaskan Arctic and demonstrating new remote sensing and improved modeling capabilities to quantify Arctic carbon fluxes and carbon cycle-climate processes. Ultimately, CARVE will provide an integrated set of data that will provide unprecedented experimental insights into Arctic carbon cycling.
Funding for this data collection effort was also provided by NSF ARCSS project "Methane loss from Arctic: towards an annual budget of CH4 emissions from tundra ecosystems across a latitudinal gradient " (ARCSS #1204263).
Data Characteristics
Table 1. Data files included in this data set
|
File Name |
Temporal Range |
Description |
|
Zona2015_Tower_daily.csv |
20130601 – 20141231 |
Daily average methane flux and soil and air temperatures at five eddy covariance towers in Alaska. |
|
Zona2015_Tower_30min.csv |
20130601- 20141231 |
Methane flux every 30 minutes at five eddy covariance towers in Alaska. |
|
Zona2015_ZeroCurtain.csv |
20130101 - 20141231 |
Start and end dates (in units of day-of-year) of the spring and fall “zero curtain” periods identified at each eddy covariance tower location. Note that the dates for the BEO tower were used for those at the CMDL site. |
|
Zona2015_CARVE_aircraft.csv |
20120523 - 20141111 |
Methane and ozone concentrations collected by the CARVE aircraft over Alaska. |
|
Zona2015_CARVE_regional.csv |
20120523 - 20141107 |
Regional carbon flux (C-CH4) as calculated from CARVE aircraft CH4 mixing ratios. |
|
CARVE-Zona-Paper-20120523-20141107-footprints |
20120523 - 20141111 |
A directory containing 3,684 netCDF WRF-STILT footprints corresponding to the CARVE flights. |
Table 2. Eddy Covariance Tower Locations
|
Site |
Latitude |
Longitude |
Tower Site Description |
|
BES |
71.28088 |
-156.596467 |
Barrow-BES tower (US-Bes) is located 10 km east of the town of Barrow, Alaska at the Barrow Environmental Observatory reserve. Elevation 3 m ASL. Instrument height 2 m. Vegetation at the site consists of moist acidic tundra - wet sedges, grasses, moss, and assorted lichens. |
|
BEO |
71.281001 |
-156.61235 |
Barrow-BEO tower is located 10 km east of the town of Barrow, Alaska at the Barrow Environmental Observatory reserve. Elevation 3 m ASL. Instrument height 3 m. Vegetation at the site consists of moist acidic tundra - wet sedges, grasses, moss, and assorted lichens. |
|
CMDL |
71.280881 |
-156.596467 |
Barrow-CMDL tower (US-Brw) is located 10 km east of the town of Barrow, Alaska, adjacent to the NOAA CMDL Laboratory. Elevation 4 m ASL. Instrument height 5 m. Vegetation at the site consists of moist acidic tundra - wet sedges, grasses, moss, and assorted lichens. |
|
ATQ |
70.469622 |
-157.408947 |
Atqasuk tower (US-Atq) is located 100 km south of Barrow. Elevation 25 m ASL. Instrument height 2 m. Vegetation at the site is a variety of moist-wet coastal sedge tundra and moist-tussock tundra surfaces in the more well-drained upland. |
|
IVO |
68.48649 |
-155.75022 |
Ivotuk tower (US-Ivo) is located 300 km south of Barrow at 579 m elevation in polar tundra. Instrument height 4 m. |
Table 3. Data fields in Zona2015_Tower_daily.csv. Data are provided for each tower site: BES, BEO, CMDL, ATQ, and IVO, indicated by <site> in the table below.
|
Data Field |
Units |
Description |
|
YMD |
dd-mmm-yyyy |
Date |
|
doy |
|
Numeric day of the year |
|
YEAR |
|
Year |
|
MONTH |
|
Numeric month of year |
|
DAY |
|
Numeric day of the month |
|
<site>_CH4 |
mgC-CH4 m-2 hr-1 |
Methane fluxes at tower <site> in milligrams of CH4 per square meter per hour. Methane concentrations were measured using Los Gatos gas analyzer and methane flux estimated from the eddy covariance method. |
|
<site>_SOILT_20cm |
degrees C |
Soil temperature at <site> at 20 cm depth. |
|
<site>_SOILT_10cm |
degrees C |
Soil temperature at <site> at 10 cm depth. |
|
<site>_SOILT_5cm |
degrees C |
Soil temperature at <site> at 5 cm depth. |
|
<site>_SOILT_0cm |
degrees C |
Soil temperature at <site> at 0 cm depth. |
|
<site>_AIR_T |
degrees C |
Air temperature at tower <site>. |
Table 4. Data fields in Zona2015_Tower_30min.csv
|
Data Field |
Units |
Description |
|
Month |
|
Numeric month |
|
Year |
|
Year |
|
Date |
dd-mmm-yyyy |
Date |
|
Time |
hh:mm |
Time (UTC -9) |
|
BES_FCH4_LGR_clean
|
mgC-CH4 m-2 h-1 |
Methane fluxes at tower BES in milligrams of CH4 per square meter per hour. |
|
BEO_FCH4_LGR_clean
|
mgC-CH4 m-2 h-1 |
Methane fluxes at tower BEO in milligrams of CH4 per square meter per hour. |
|
CMDL_FCH4_LGR_clean |
mgC-CH4 m-2 h-1 |
Methane fluxes at tower CMDL in milligrams of CH4 per square meter per hour. |
|
ATQ_FCH4_LGR_clean |
mgC-CH4 m-2 h-1 |
Methane fluxes at tower ATQ in milligrams of CH4 per square meter per hour. |
|
IVO_FCH4_clean |
mgC-CH4 m-2 h-1 |
Methane fluxes at tower IVO in milligrams of CH4 per square meter per hour. |
Table 5. Data fields in Zona2015_ZeroCurtain.csv. Start and end DOY define the period when soil temperatures at a site are near 0 degrees C.
|
Data Field |
Units |
Description |
|
site |
|
BES, BEO, CMDL, ATQ, and IVO |
|
spring_start_2013 |
DOY |
Day of year |
|
spring_end_2013 |
DOY |
Day of year |
|
fall_start_2013 |
DOY |
Day of year |
|
fall_end_2013 |
DOY |
Day of year |
|
spring_start_2014 |
DOY |
Day of year |
|
spring_end_2014 |
DOY |
Day of year |
|
fall_start_2014 |
DOY |
Day of year |
|
fall_end_2014 |
DOY |
Day of year |
|
notes |
|
|
Table 6. Data fields in Zona2015_CARVE_aircraft.csv
|
Data Field |
Units |
Description |
|
Lat |
Decimal degrees |
Latitude from GPS |
|
Lon |
Decimal degrees |
Longitude from GPS |
|
Alt |
Meters above ground level |
Altitude |
|
Time |
YYYY-MM-DDThh:mm:ss |
UTC Time |
|
JD |
Fractional days since midnight Jan 1 |
Julian day |
|
Year |
|
Year |
|
ch4 |
ppb |
Mean dry mole methane (CH4) mixing ratio (parts per billion) within receptor bin |
|
ch4.sd |
ppb |
Standard deviation of dry mole CH4 mixing ratio within receptor bin |
|
o3 |
ppb |
Mean ozone (O3) mixing ratio within receptor bin |
|
o3.sd |
ppb |
Standard deviation in ozone (O3) mixing ratio within receptor bin |
|
stilt.influence |
ppb/nmol m-2 s-1 |
Summed 24-hour 2D land surface influence on the aircraft data as calculated from the WRF-STILT model for each flight, representing the response of the receptor to a unit surface emission (ppb/nmol m-2 s-1) of CH4. This field is derived from the first 24 hours of data in the “foot1” field. |
Table 7. Data fields in Zona2015_CARVE_regional.csv
|
Data Field |
Units |
Description |
|
Year |
|
Year |
|
YYYYMMDD |
YYYYMMDD |
Date UTC |
|
Date.start |
|
Fractional day. UTC |
|
Date.end |
|
Fractional day. UTC |
|
Regional.FC-CH4 |
mgC-CH4 m-2 hr-1 |
Carbon flux as calculated from CARVE aircraft CH4 mixing ratios |
|
FC-CH4.min |
mgC-CH4 m-2 hr-1 |
Minimum carbon flux |
|
FC-CH4.max |
mgC-CH4 m-2 hr-1 |
Maximum carbon flux |
Description of data in CARVE-Zona-Paper-20120523-20141107-footprints directory:
This directory contains 3,684 netCDF (*.nc) files representing gridded footprints from WRF-STILT simulations. Each file aggregates particle footprints on a lat/lon/time grid starting at the stilt start time. The reported data have been limited to measurements collected north of 68°N, west of -153°W (to remove impacts of anthropogenic influence in the Deadhorse/Prudhoe Bay area), below 1500 m agl (above ground level), with CO < 150 ppb, and with over 60% surface influence from the North Slope.
For each airborne measurement, 2D surface influence fields (i.e. footprints) at two different spatial resolutions were derived using the WRF-STILT simulations. These gridded footprints are provided as netCDF formatted files. The first surface influence field, represented by the “foot1” variable in the netCDF files, provides a total 10 days of surface influence representing the response of the receptor to a unit surface emission (ppb/nmol m-2 s-1) of CH4 in each 0.5° x 0.5° grid square within the whole study area (30N to 90N and 140E to 180E/180W to 80W) at hourly temporal resolution. Note: Only the first 24 hours of the 10-day surface influence field (“foot1”) was used in Zona et al. (2015).
The second surface influence field, represented by the “footnearfield1” variable in the netCDF files, provides a total 24 hours of surface influence representing the response of the receptor to a unit surface emission (ppb/nmol m-2 s-1) of CH4 in each 0.1° x 0.1° grid square within a small region close to the measurement location at hourly temporal resolution.
File naming convention:
footYYYYxMMxDDxhhxmmxDecDegNxDecDegWxHeight.nc where:
YYYY = year
MM = month
DD = day
hh = hour (UTC time)
mm = minutes (UTC time)
DecDegN = Latitude in decimal degrees north
DecDegW = Longitude in decimal degrees west
Height = Height of aircraft above ground level (m)
For example, the file "foot2012x05x23x19x50x70.4733Nx157.4127Wx00315.nc" contains the modeled particle footprints for May 23, 2012 at 19:50 UTC. The CARVE aircraft observation was taken at location 70.4733N by 157.4127W at 315 m above ground level.
Additional Related data:
The Zona et al. 2015 paper also uses methane data from the HIPPO Campaign (Wofsy et al., 2012).
Application and Derivation
These data show that cold season emissions are notably strong in non-inundated tundra contrary to model predictions, which mostly link CH4 sources to surface inundation. This data demonstrates the importance of the cold period for the annual CH4 budget, the sensitivity to soil conditions, and the importance of dry tundra. The work should stimulate the inclusion of these factors in global climate models and help define the feedback phenomena affecting climate and atmospheric composition.
Quality Assessment
Quality assessment and gap-filling of the EC tower-derived data is described in Zona et al 2015. Uncertainty in the CARVE aircraft-derived methane and ozone concentrations are provided in Zona2015_CARVE_aircraft.csv.
Data Acquisition, Materials, and Methods
Ecosystem scale CH4 fluxes were measured using the eddy covariance method with three eddy covariance (EC) towers in Barrow (Sturtevant et al., 2012; Zona et al., 2009; Zona et al., 2012) (CMDL, BEO, and BES), one EC tower in Atqasuk (Oechel et al 2014) (ATQ), and one EC tower in Ivotuk (IVO). Gap filling of the CH4 flux data is described in Zona et al. (2015). Routine soil and air temperature measurements are also reported and were used to derive the “zero curtain” intervals.
Regional fluxes of CH4 were estimated from aircraft data from the Carbon in Arctic Reservoirs Vulnerability Experiment (CARVE) 2012-2014 (Chang et al 2014). CH4 mixing ratios were measured using two independent cavity ringdown spectrometers: one operated wet and one dry. Each analyzer was calibrated throughout the flight, ensuring a continuous 5s time series. Ozone mixing ratios were measured using a 2B Technologies model 205. The aircraft data were aggregated horizontally every 5 km and vertically in 50 m intervals below 1 km and 100 m intervals above 1 km. Each aggregated position was treated as a receptor in a Lagrangian transport model (WRF-STILT), which calculated the back trajectory of 500 particles from each receptor location. This allowed for the quantification of the space and time where upstream surface fluxes influenced the measured mixing ratios. WRF-STILT represents the Stochastic Time-Inverted Lagrangian Transport (STILT) model coupled with meteorology fields from the polar variant of the Weather and Research Forecasting model (WRF, v3.5.1, 36). A total 24 hour 2D surface influence field (i.e. footprint) was calculated for each flight, representing the response of the receptor to a unit surface emission (ppb/nmol m-2 s-1) of CH4 in each grid square (0.5° x 0.5° grid). Methodology for CARVE WRF-STILT footprints is described in detail in Henderson et al. (2015).
The regional flux of CH4 for each flight day was calculated from the correlation of CH4 with the STILT land surface influence (via Ordinary Least Square regression) where the slope represents the regional flux and the intercept is the regional background CH4 mixing ratio, which was assumed not to vary greatly during each flight. Only data collected north of 68°N, west of -153°W (to remove impacts of anthropogenic influence in the Deadhorse/Prudhoe Bay area), below 1500 m agl (above ground level), with CO < 150 ppb, and with over 60% surface influence from the North Slope were included in the calculation of the regional flux.
See Zona et al. (2015) for additional methodological details.
Data Access
This data is available through the Oak Ridge National Laboratory (ORNL) Distributed Active Archive Center (DAAC).
CARVE-ARCSS: Methane Loss From Arctic- Fluxes From the Alaskan North Slope, 2012-2014
Contact for Data Center Access Information:
- E-mail: uso@daac.ornl.gov
- Telephone: +1 (865) 241-3952
References
Chang RY-W, et al. (2014) Methane emissions from Alaska in 2012 from CARVE airborne observations. Proc Natl Acad Sci USA 111:16694-16699, doi:10.1073/pnas.1412953111.
Henderson, JM, Eluszkiewicz J, Mountain ME, Nehrkorn T, Chang RY-W, Karion A, Miller JB, Sweeney C, Steiner N, Wofsy SC, Miller CE (2015) Atmospheric transport simulations in support of the Carbon in Arctic Reservoirs Vulnerability Experiment (CARVE). Atmos Chem Phys, 15, 4093–4116, doi:10.5194/acp-15-4093-2015.
Oechel WC, Laskowski CA, Burba G, Gioli B, Kalhori AAM (2014) Annual patterns and budget of CO2 flux in an Alaskan arctic tussock tundra ecosystem at Atqasuk, Alaska. J Geophys Res 119, doi:10.1002/2013JG002431.
Sturtevant CS, Oechel WC, Zona D, Kim Y, Emerson CE (2012) Soil moisture control over fall season methane flux, Arctic Coastal Plain of Alaska. Biogeosciences 9:1423-1440.
Wofsy, S. C., B. C. Daube, R. Jimenez, E. Kort, J. V. Pittman, S. Park, R. Commane, B. Xiang, G. Santoni, D. Jacob, J. Fisher, C. Pickett-Heaps, H. Wang, K. Wecht, Q.-Q. Wang, B. B. Stephens, S. Shertz, A.S. Watt, P. Romashkin, T. Campos, J. Haggerty, W. A. Cooper, D. Rogers, S. Beaton, R. Hendershot, J. W. Elkins, D. W. Fahey, R. S. Gao, F. Moore, S. A. Montzka, J. P. Schwarz, A. E. Perring, D. Hurst, B. R. Miller, C. Sweeney, S. Oltmans, D. Nance, E. Hintsa, G. Dutton, L. A. Watts, J. R. Spackman, K. H. Rosenlof, E. A. Ray, B. Hall, M. A. Zondlo, M. Diao, R. Keeling, J. Bent, E. L. Atlas, R. Lueb, M. J. Mahoney. 2012. HIPPO Merged 10-second Meteorology, Atmospheric Chemistry, Aerosol Data (R_20121129). Carbon Dioxide Information Analysis Center, Oak Ridge National Laboratory, Oak Ridge, Tennessee, U.S.A. http://dx.doi.org/10.3334/CDIAC/hippo_010 (Release 20121129)
Zona D, et al. (2009) Methane fluxes during the initiation of a large-scale water table manipulation experiment in the Alaskan Arctic tundra. Global Biogeochem Cy 23, doi 10.1029/2009GB003487.
Zona D, et al. (2012) Increased CO2 loss from vegetated drained lake tundra ecosystems due to flooding. Global Biogeochem Cy 26:GB2004, doi:10.1029/2011GB004037.
Zona, D., B. Gioli, R. Commane, J.O.W. Lindaas, S.C. Wofsy, C.E. Miller, S.J. Dinardo, S. Dengel, C. Sweeney, A. Karion, R.Y-W. Chang, J.M. Henderson, P. Murphy, J.P. Goodrich, V. Moreaux, A. Liljedahl, J.D. Watts, J.S. Kimball, D.A. Lipson, W.C. Oechel. 2016. Cold season emissions dominate the Arctic tundra methane budget. PNAS 2016 113: 40-45 doi:10.1073/pnas.1516017113