Documentation Revision Date: 2016-07-28
Data Set Version: V1
Summary
These measurements are one part of an innovative multi-instrument remote sensing payload flown for the CARVE campaign.
There are 3 data files in comma-separated values (*.csv) format, one for each campaign year, with this data set. Please note that 2015 year data has not been released yet.
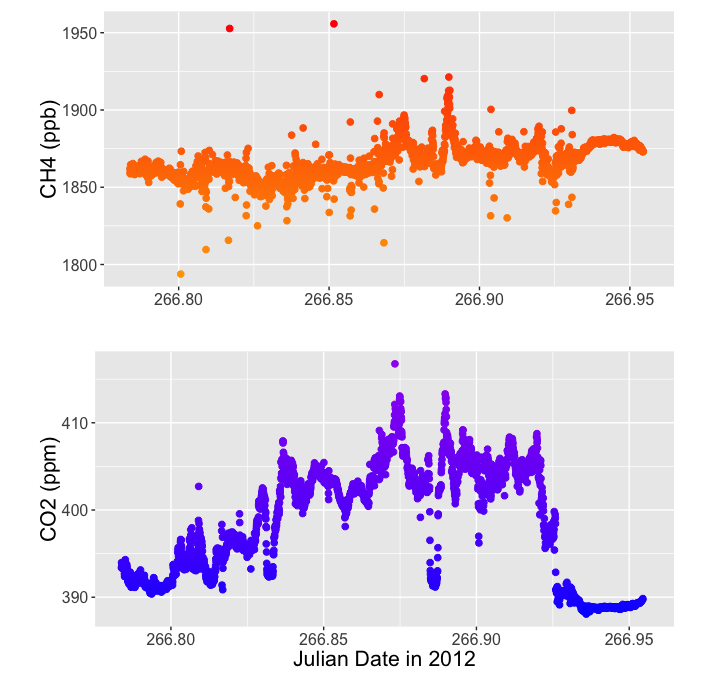
Figure 1. Airborne methane and CO2 concentrations during a CARVE flight over the Yukon Flats area, Alaska on 23 September, 2012.
Citation
Budney, J.W., R.Y-W. Chang, R. Commane, B.C. Daube, A. Dayalu, S.J. Dinardo, E.W. Gottlieb, A. Karion, J.O.W. Lindaas, C.E. Miller, J.B. Miller, S. Miller, M. Pender, J.V. Pittman, J. Samra, C. Sweeney, S.C. Wofsy, and B. Xiang. 2016. CARVE: L2 Merged Atmospheric CO2, CO, O3 and CH4 Concentrations, Alaska, 2012-2015. ORNL DAAC, Oak Ridge, Tennessee, USA. http://dx.doi.org/10.3334/ORNLDAAC/1402
Table of Contents
- Data Set Overview
- Data Characteristics
- Application and Derivation
- Quality Assessment
- Data Acquisition, Materials, and Methods
- Data Access
- References
Data Set Overview
Project: Carbon in Arctic Reservoirs Vulnerability Experiment (CARVE)
The Carbon in Arctic Reservoirs Vulnerability Experiment (CARVE) is a NASA Earth Ventures (EV-1) investigation designed to quantify correlations between atmospheric and surface state variables for Alaskan terrestrial ecosystems through intensive seasonal aircraft campaigns, ground-based observations, and analysis sustained over a 5-year mission. CARVE collected detailed measurements of greenhouse gases on local to regional scales in the Alaskan Arctic and demonstrated new remote sensing and improved modeling capabilities to quantify Arctic carbon fluxes and carbon cycle-climate processes. CARVE science fills a critical gap in Earth science knowledge and satisfies high priority objectives across NASA’s Carbon Cycle and Ecosystems, Atmospheric Composition, and Climate Variability & Change focus areas as well as the Air Quality and Ecosystems elements of the Applied Sciences program. CARVE data also complements and enhances the science return from current NASA and non-NASA sensors.
Related Data:
Airborne CARVE greenhouse gas concentrations from both the NOAA and Harvard Picarro CRDS instruments are also available as separate data sets:
CARVE: L2 Atmospheric CO2, CO and CH4 Concentrations, Harvard CRDS, Alaska, 2012-2014
CARVE: L2 Atmospheric CO2, CO and CH4 Concentrations, NOAA CRDS, Alaska, 2012-2015
A full list of CARVE data products is available at: https://carve.ornl.gov/dataproducts.html
Data Characteristics
Spatial Coverage: CARVE flights over the Alaskan and Canadian Arctic
Spatial Resolution: Point measurements
Temporal Coverage: Periodic flights occurred during the growing seasons (approx. March – November) of 2012 through 2015.
Temporal Resolution: All measurements were aggregated to 5-second intervals for distribution with this data set.
Study Area (coordinates in decimal degrees)
|
Site |
Westernmost Longitude |
Easternmost Longitude |
Northernmost Latitude |
Southernmost Latitude |
|
Alaska and Canadian Arctic |
-168.11 |
-131.75 |
71.56 |
60.21 |
Data File Information
There are 3 data files in *.csv format with this data set. Each file provides measurements of dry mole fractions of atmospheric gasses acquired during a campaign year.
Table 1. CARVE file naming convention. Example file name: carve_AtmosISGA_L2_Merge_2012_20160722.csv
|
Name element |
Example value |
Units |
|
Project name |
carve |
|
|
Instrument |
AtmosISGA |
|
|
Processing level |
L2 |
|
|
Investigator group |
Merge |
merged product |
|
Campaign year |
2012 |
year |
|
Processing date |
20160722 |
yyyymmdd |
Data variables
Each file contains 31 variables described in Table 2. All measurements were aggregated from the original temporal resolution to 5 second intervals for this merged product. Fill value or missing data were set to -999.9 for all variables. All dates and times are recorded in UTC time.
Table 2. Data variables in each .csv file.
|
Variable |
Units |
Description |
|
SOY |
|
Seconds of year from midnight on Jan 1 |
|
JD |
|
Fractional Julian Day of year |
|
UTC |
|
Seconds since the start of day (midnight) |
|
YYYYMMDD |
YYYYMMDD |
Date (UTC time) |
|
Lat |
decimal degrees |
Decimal degrees North reported by aircraft |
|
Long |
decimal degrees |
Decimal degrees East reported by aircraft |
|
GPS_Alt |
meters |
Aircraft altitude |
|
CO2.X |
ppm |
Merged CO2 product |
|
CH4.X |
ppb |
Merged CH4 product |
|
CO.X |
ppb |
Merged CO product |
|
H2O.X |
percent |
Merged H2O product |
|
O3.X |
ppb |
Merged O3 product |
|
NOAA.CO2.ppm |
ppm |
CO2 data from NOAA Picarro instrument |
|
NOAA.CH4.ppb |
ppb |
CH4 data from NOAA Picarro instrument |
|
NOAA.CO.ppb |
ppb |
CO data from NOAA Picarro instrument |
|
NOAA.CO2.QC |
|
NOAA CO2 quality flag. 0 = Valid data, 1 = Data out of calibration range, 2 = Cavity anomaly, 3 = System leak or calibration problem, Do not use. |
|
NOAA.CH4.QC |
|
NOAA CH4 quality flag. 0 = Valid data, 1 = Data out of calibration range, 2 = Cavity anomaly, 3 = System leak or calibration problem, Do not use. |
|
NOAA.CO.QC |
|
NOAA CO quality flag. 0 = Valid data, 1 = Data out of calibration range, 2 = Cavity anomaly, 3 = System leak or calibration problem, Do not use. |
|
HU.CO2 |
ppm |
CO2 data from Harvard Picarro instrument |
|
HU.CH4 |
ppb |
CH4 data from Harvard Picarro instrument |
|
HU.CO |
ppb |
CO data from Harvard Picarro instrument |
|
CO2.HU.flag |
|
Harvard CO2 quality flag. 0 = Valid data, 1 = Data out of calibration range, 2 = Cavity anomaly, 3 = System leak or calibration problem, Do not use. |
|
CH4.HU.flag |
|
Harvard CH4 quality flag. 0 = Valid data, 1 = Data out of calibration range, 2 = Cavity anomaly, 3 = System leak or calibration problem, Do not use. |
|
CO.HU.flag |
|
Harvard CO quality flag. 0 = Valid data, 1 = Data out of calibration range, 2 = Cavity anomaly, 3 = System leak or calibration problem, Do not use. |
|
O3.ppb |
ppb |
JPL O3 data from DADS file |
|
H2O.pct |
percent |
Water vapor percentage from NOAA Picarro instrument |
|
H2O.QC |
|
NOAA H20 quality flag. 0 = Valid data, 1 = Data out of calibration range, 2 = Cavity anomaly, 3 = System leak or calibration problem, Do not use. |
|
H2O.corr |
percent |
H2O data corrected for pressure |
|
Tcorr |
degrees C |
Processed air temperature |
|
Pcorr |
mbar |
Processed air pressure |
|
AmbientPress.mb |
mbar |
Raw ambient air pressure |
Application and Derivation
These data files contain high-frequency atmospheric CO2, CH4, CO, H2O, and O3 content observations for CARVE flights during March– November of 2012 to 2015. The CARVE project was designed to collect detailed measurements of important greenhouse gases on local to regional scales in the Alaskan arctic and demonstrate new remote sensing and improved modeling capabilities to quantify Arctic carbon fluxes and carbon cycle-climate processes. The CARVE data provide insights into Arctic carbon cycling that may be useful in numerous applications.
Quality Assessment
Continuous measurements from the CRDS instruments (Picarro, Inc.) were calibrated against on-board standard gas samples once every 30 minutes by an automated system. Quality control flags for each gas measurement are included in the data file.
Data Acquisition, Materials, and Methods
CARVE Flights
These data represent one part of the data collected by the Carbon in Arctic Reservoirs Vulnerability Experiment (Miller et al, 2012). A C-23 Sherpa aircraft made frequent flights out of Fairbanks, Alaska between March and November over multiple years, observing the spring thaw, summer draw-down, and fall refreeze of the Arctic growing season. Flights concentrate observations on three study domains: the North Slope, the interior, and the Yukon River valley. North Slope flights cover regions of tundra and continuous permafrost and were anchored by flux towers in Barrow, Atqasuk, and Ivotuk. Flights to Prudhoe Bay characterize the CO2 and CH4 emissions from oil and natural gas processing plants. Flights over interior Alaska sample discontinuous permafrost, boreal forests, and wetlands. A complete list of CARVE flights can be found at: https://carve.ornl.gov/flights.html. Flight paths and atmospheric gas concentrations for CARVE surveys can be visualized through the CARVE Flight Data Visualization Tool (http://carve.ornl.gov/visualize).
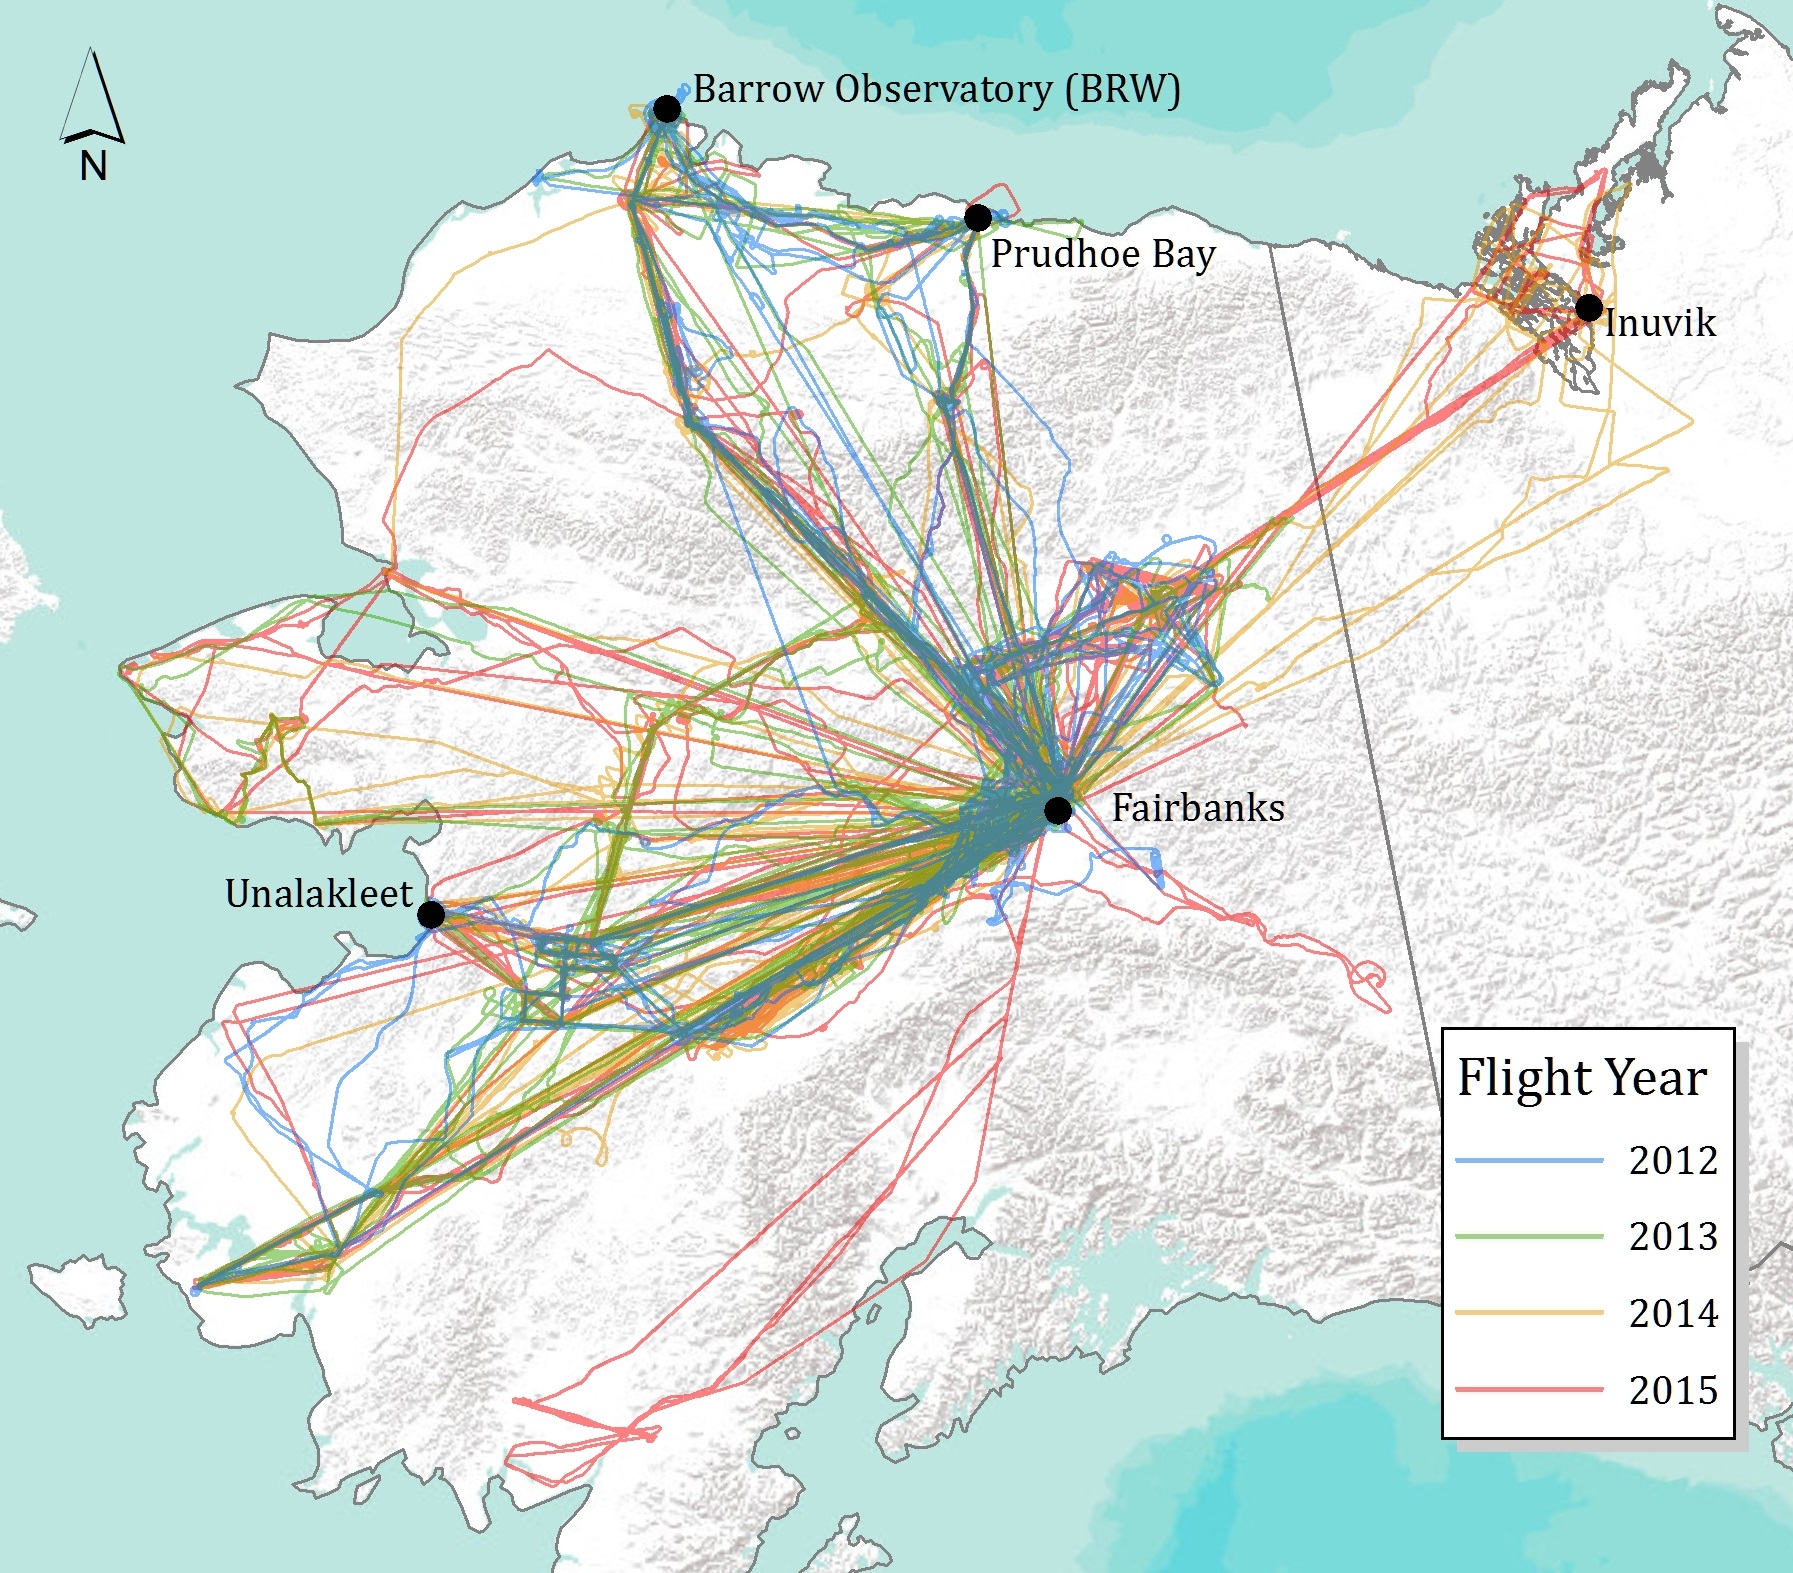
Figure 2. CARVE flights during 2012-2015 delivered measurements over continuous and discontinuous permafrost regimes.
The CARVE aircraft carried a remote sensing and atmospheric sampling payload consisting of the following instruments: a passive/active L-band system (PALS), a Fourier transform spectrometer (FTS), and an in situ gas analyzer suite (ISGAS) with a gas analyzer and flask sampling system (see https://carve.ornl.gov/documentation.html). All instruments were controlled by a master computer system (Data Acquisition and Distribution System, DADS). DADS also recorded GPS data (Lat, Lon, altitude), aircraft pitch, roll, and yaw, as well as basic meteorological data from onboard instruments.
In situ gas analyzer
This data set includes in situ measurements merged from two cavity ring-down spectroscopy (CRDS) instruments (Picarro Inc.). The two instruments are named according to the investigator teams at NOAA and Harvard University. Note that the Harvard CRDS was not used in 2015. CRDS is a technique for measuring quantities of gaseous substances based on the rate of light intensity decay following laser illumination of a highly-reflective containment cavity. A CRDS system measures the time constant of decay to 1/e of its initial intensity, its ring-down time, in order to calculate the concentration of the absorbing gas mixture within the cavity.
Merged Data
- The merged CO2 and CH4 data were constructed by aggregating the raw data into 5 second intervals, calculating the median difference between the Harvard values (e.g. HU.CO2) and the NOAA values (e.g. NOAA.CO2.ppm) and gap-filling the HU data with the NOAA data (plus offset).
- The merged CO data were created from 5 second averaged values from the Harvard university Picarro instrument.
- H20 data was recorded only by the NOAA Picarro instrument.
- The O3 data came directly from the onboard computer system (Data Acquisition and Distribution System, DADS). DADS also recorded GPS data (Lat, Lon, altitude), aircraft pitch, roll, and yaw, as well as basic meteorological data from onboard instruments.
Gas concentration data from both the NOAA and Harvard Picarro CRDS instruments are also available in NetCDF file format:
CARVE: L2 Atmospheric CO2, CO and CH4 Concentrations, Harvard CRDS, Alaska, 2012-2014
CARVE: L2 Atmospheric CO2, CO and CH4 Concentrations, NOAA CRDS, Alaska, 2012-2015
Data Access
These data are available through the Oak Ridge National Laboratory (ORNL) Distributed Active Archive Center (DAAC).
CARVE: L2 Merged Atmospheric CO2, CO, O3 and CH4 Concentrations, Alaska, 2012-2015
Contact for Data Center Access Information:
- E-mail: uso@daac.ornl.gov
- Telephone: +1 (865) 241-3952
References
Miller, C.E., Dinardo, S.J. et al. (2012). CARVE: The Carbon in Arctic Reservoirs Vulnerability Experiment., 2012 IEEE Aerospace Conference. doi: 10.1109/AERO.2012.6187026