Documentation Revision Date: 2017-04-06
Data Set Version: V1
Summary
These measurements are one part of an innovative multi-instrument remote sensing payload flown for the CARVE campaign.
There are 5031 files in NetCDF (*.nc) format included in this data set.
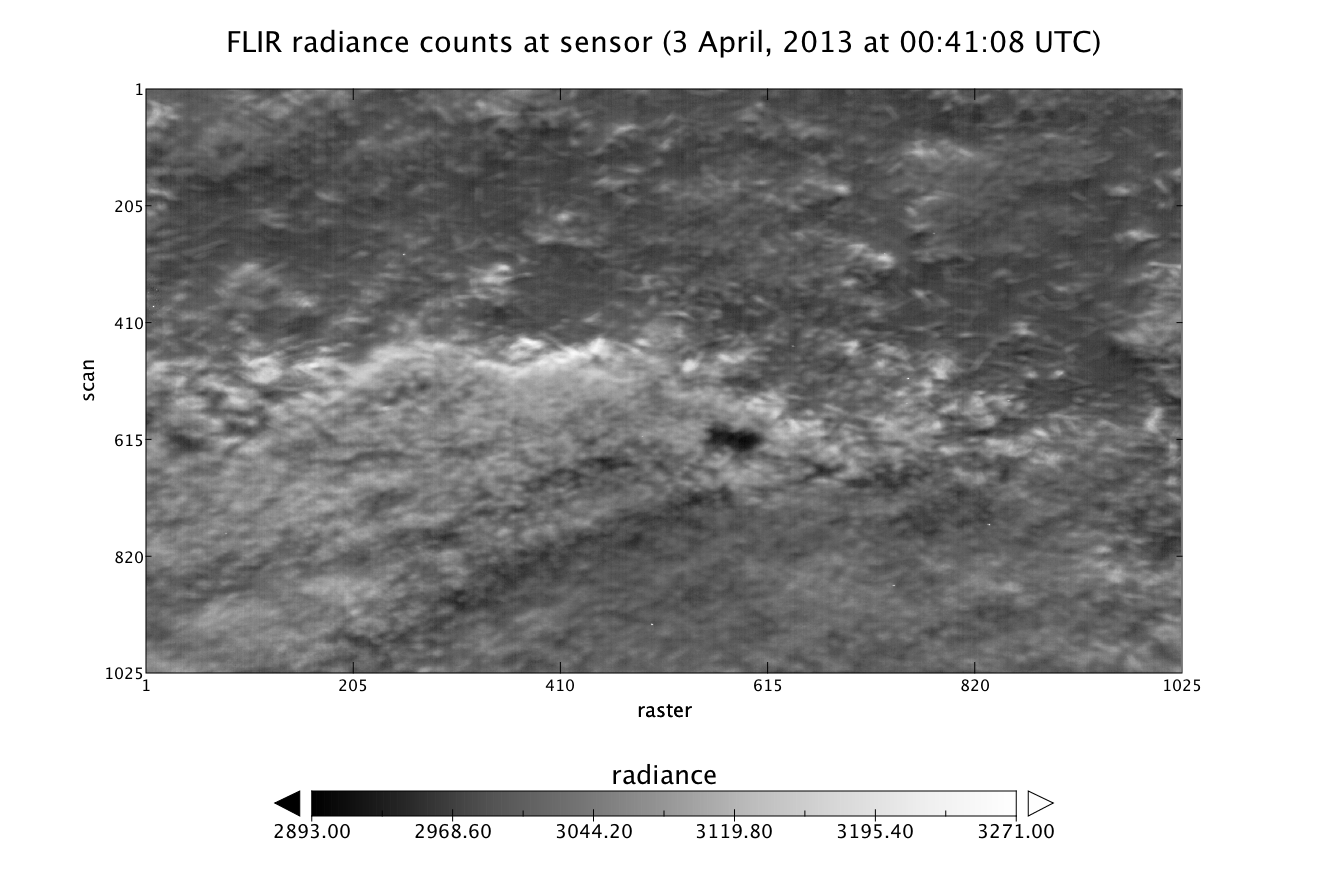
Figure 1: Infrared radiance of the land surface measured by the FLIR instrument onboard the CARVE flight on April 3, 2013.
Citation
Steiner, N., K.C. McDonald, E. Podest, C.E. Miller, and S.J. Dinardo. 2017. CARVE: L1 Airborne Forward Looking Infrared Radiance Counts, Alaska, 2013-2015. ORNL DAAC, Oak Ridge, Tennessee, USA. http://dx.doi.org/10.3334/ORNLDAAC/1428
Table of Contents
- Data Set Overview
- Data Characteristics
- Application and Derivation
- Quality Assessment
- Data Acquisition, Materials, and Methods
- Data Access
- References
Data Set Overview
Project: Carbon in Arctic Reservoirs Vulnerability Experiment (CARVE)
The Carbon in Arctic Reservoirs Vulnerability Experiment (CARVE) is a NASA Earth Ventures (EV-1) investigation designed to quantify correlations between atmospheric and surface state variables for Alaskan terrestrial ecosystems through intensive seasonal aircraft campaigns, ground-based observations, and analysis sustained over a 5-year mission. CARVE collected detailed measurements of greenhouse gases on local to regional scales in the Alaskan Arctic and demonstrated new remote sensing and improved modeling capabilities to quantify Arctic carbon fluxes and carbon cycle-climate processes. CARVE science fills a critical gap in Earth science knowledge and satisfies high priority objectives across NASA’s Carbon Cycle and Ecosystems, Atmospheric Composition, and Climate Variability & Change focus areas as well as the Air Quality and Ecosystems elements of the Applied Sciences program. CARVE data also complements and enhances the science return from current NASA and non-NASA sensors.
Related Data:
A full list of CARVE data products is available at: https://carve.ornl.gov/dataproducts.html
Data Characteristics
Spatial Coverage: CARVE flights over the Alaskan and Canadian Arctic
Spatial Resolution: variable; ~36 cm horizontal resolution at altitude of 500 m
Temporal Coverage: 20130403 - 20151113
Temporal Resolution: 1 second to less than 1 minute
Study Area (coordinates in decimal degrees)
|
Site |
Westernmost Longitude |
Easternmost Longitude |
Northernmost Latitude |
Southernmost Latitude |
|
Alaskan and Canadian Arctic |
-168.069 |
-132.238 |
71.361 |
58.842 |
Data File Information
All FLIR Level 1 product data are stored in NetCDF (*.nc) version 4 file format. There are a total of 5031 data files. Each file provides earth referenced radiance counts captured during a portion of a CARVE flight. The number of files generated for a given day is dependent on the length of the flight. The discontinous temporal range for this product starts in April 2013 and ends in November 2015. The file naming convention is listed in Table 1. Global metadata attributes communicating information about the FLIR product and information specific to each file are described in Table 2.
Table 1. CARVE file naming convention. Example file name: carve_FLIR_L1A_b23_20130403_000011_20160304004404124.nc
| Name element | Example value | Units |
| Project name | carve | |
| Instrument | FLIR | |
| Processing level | L1A | |
| Build ID | b23 | |
| File date * | 20130403 | yyyymmdd |
| File number ** | 000011 | ###### |
| Processing date and time | 20160304004404124 | yyyymmddhhmmss |
* Data from a single flight is spread across multiple files.
** Files are numbered in order that the data were collected
Table 2. Global metadata attributes for NetCDF files
| Attribute Name | Description |
| ancillary_file_source | List of ancillary data products used to generate the current product |
| build_id | Software build |
| collection_label | Collection label |
| comment | Miscellaneous information about the data or methods |
| conventions | Documents describing sets of discipline-specific conventions |
| data_start_time | Date and time of first data element in the file: yyyy-mm-ddThh:mm:ss.sssZ |
| data_stop_time | Date and time of last data element in the file: yyyy-mm-ddThh:mm:ss.sssZ |
| frequency_of_sampling | "1 second - < 1 minute" |
| history | Audit trail for modifications to the original data |
| institution | Specifies where the original data was produced |
| instrument | Instruments with data contained in the file |
| long_name | Long name of the product type |
| master_quality_flag | Succinct assessment of the quality of the data in the file: "Good", "Bad", or "UNK" |
| product_source | List of source data products used to generate the current product |
| production_date_time | Date and time when product was created: yyyy-mm-ddThh:mm:ss.sssZ |
| processing_level | Processing level of the data |
| references | References |
| sampling_interval | "Grab" |
| short_name | Short name of the product type |
| source | Method of production of original data |
| specification_name | The name of the document describing product contents |
| specification_version | Version of the document describing the product contents |
| title | Succinct description of data set contents |
Data variables
Each file contains 14 geolocation variables and 1 science measurement variable described in Table 3. Metadata attributes for the radiance variable, including polynomial conversion coefficients for converting digital numbers to standard units, are described in Table 4.
Table 3. Data variables in each netCDF file. Fill value or missing data were set to -999.9 for all variables.
| Variable | Units | Description |
| Geolocation measurements | ||
| center_lat | degrees_north | Latitude of footprint center |
| center_lat_standard_error | degrees_north | Standard error of latitude of footprint center |
| center_lon | degrees_east | Longitude of footprint center |
| center_lon_standard_error | degrees_east | Standard error of longitude of footprint center |
| geolocation_qc | 0: Success; 1: Error | Geolocation calculations status |
| heading | degree | Aircraft heading |
| heading_qc | 0: Valid; 1: OutOfRange; 2: Error | Aircraft heading status |
| height | meters | Aircraft height |
| height_standard_error | meters | Standard error of aircraft height |
| pitch | degree | Aircraft pitch angle |
| pitch_qc | 0: Valid; 1: OutOfRange; 2: Error | Aircraft pitch angle status |
| roll | degree | Aircraft roll angle |
| roll_qc | 0: Valid; 1: OutOfRange; 2: Error | Aircraft roll angle status |
| time | seconds since 1980-01-06 0:0:0 | Measurement time UTC |
| Science measurements | ||
| radiance | Counts | FLIR radiance counts at sensor |
Table 4. Metadata attributes for the radiance variable in the NetCDF files.
| Attribute Name | Description |
| long_name | Variable long name |
| _FillValue | Null data fill value |
| MinCounts | Minimum radiance value [digital number] |
| MaxCounts | Maximum radiance value [digital number] |
| MinRadiance | Minimum radiance value [W/(sr*cm2)] |
| MaxRadiance | Maximum radiance value [W/(sr*cm2)] |
| valid_min | Minimum valid radiance value [digital number] |
| valid_max | Maximum valid radiance value [digital number] |
| BandpassLow | Minimum integration wavelength [nm] |
| BandpassHigh | Maximum integration wavelength [nm] |
| units | Radiance units |
| C0 | zero-degree polynomial conversion coefficient [DN to W/(sr*cm2)] |
| C1 | first-degree polynomial conversion coefficient [DN to W/(sr*cm2)] |
| C2 | second-degree polynomial conversion coefficient [DN to W/(sr*cm2)] |
| C3 | third-degree polynomial conversion coefficient [DN to W/(sr*cm2)] |
| C4 | fourth-degree polynomial conversion coefficient [DN to W/(sr*cm2)] |
| C5 | fifth-degree polynomial conversion coefficient [DN to W/(sr*cm2)] |
| C6 | sixth-degree polynomial conversion coefficient [DN to W/(sr*cm2)] |
| radiance_coefficients | non-zero radiance conversion polynomial coefficients |
| AtmA1 | For internal use only |
| AtmA2 | For internal use only |
| AtmB1 | For internal use only |
| AtmX | For internal use only |
| PolynomialOrder | For internal use only |
| B | For internal use only |
| R | For internal use only |
| F | For internal use only |
| BGValue | For internal use only |
| FrameRate | For internal use only |
| MinTemperature | For internal use only |
| MaxTemperature | For internal use only |
| TempC0 | For internal use only |
| TempC1 | For internal use only |
| TempC2 | For internal use only |
| IntegrationTime | For internal use only |
Application and Derivation
The FLIR instrument was operated during the spring, summer, and fall seasons during clear sky conditions targeting ecosystem components that influence the carbon cycle. Thermal images from the FLIR camera aboard the CARVE aircraft may be used to study the role of seasonal freeze/thaw (F/T) processes in the carbon cycle, an important component to carbon and methane exchange with the atmosphere. Measurements of the temperature and the freeze-thaw state of various landscape components, including the soil and vegetation, may be combined with measurements of atmospheric gas concentrations to better understand the role of surface processes in the exchange of greenhouse gases with the atmosphere in the Alaskan arctic.
Quality Assessment
Each NetCDF file contains a global attribute MasterQualityFlag that provides a summary indication of the data quality of the whole file. Values are set to: Good - all lower-level quality assessments passed; Bad - some or all lower-level quality assessments were not passed; or UNK - quality is unknown.
Data Acquisition, Materials, and Methods
CARVE Flights
These data represent one part of the data collected by the Carbon in Arctic Reservoirs Vulnerability Experiment (Miller et al, 2012). A C-23 Sherpa aircraft made frequent flights out of Fairbanks, Alaska between March and November over multiple years, observing the spring thaw, summer draw-down, and fall refreeze of the Arctic growing season. Flights concentrate observations on three study domains: the North Slope, the interior, and the Yukon River valley. North Slope flights cover regions of tundra and continuous permafrost and were anchored by flux towers in Barrow, Atqasuk, and Ivotuk. Flights to Prudhoe Bay characterize the CO2 and CH4 emissions from oil and natural gas processing plants. Flights over interior Alaska sample discontinuous permafrost, boreal forests, and wetlands. A complete list of CARVE flights can be found at: https://carve.ornl.gov/flights.html. Flight paths and atmospheric gas concentrations for CARVE surveys can be visualized through the CARVE Flight Data Visualization Tool (http://carve.ornl.gov/visualize).
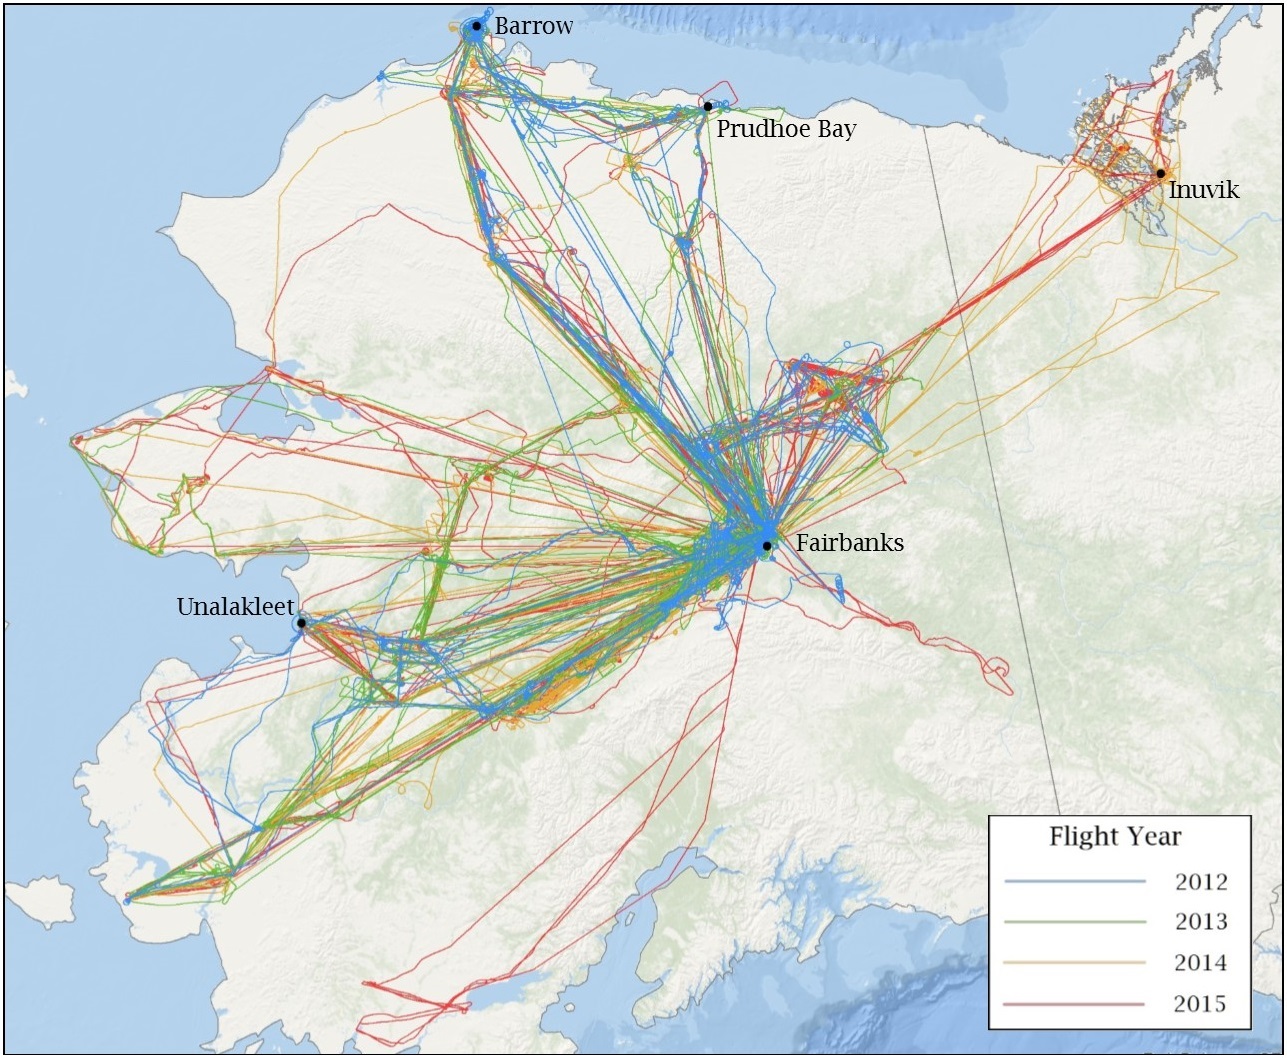
Figure 2. CARVE flights during 2012-2015 delivered measurements over continuous and discontinuous permafrost regimes.
The CARVE aircraft carried a remote sensing and atmospheric sampling payload consisting of the following instruments: a Fourier transform spectrometer (FTS), and an in situ gas analyzer suite (ISGAS) with a gas analyzer and flask sampling system (see https://carve.ornl.gov/documentation.html). All instruments were controlled by a master computer system (Data Acquisition and Distribution System, DADS). DADS also recorded GPS data (Lat, Lon, altitude), aircraft pitch, roll, and yaw, as well as basic meteorological data from onboard instruments.
Forward-Looking Infrared Camera
The nadir-pointed FLIR-SC8200 camera on board the CARVE aircraft is used to measure upwelling mid-infrared spectral radiance at 3-5 microns at a rate of 1 frame per second. The instantaneous field of view (IFOV) of the FLIR instrument allows for a pixel resolution of ~36 cm from a height of 500 m. These high-resolution observations allow for the discrimination of individual landscape components such as soil, vegetation and surface water features in the image footprint.
To convert radiance counts into standard units, for a pixel in column, x, row, y, use the following equation:
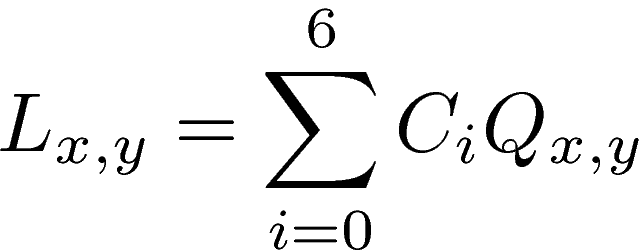
Here, Qx,y, is radiance in counts, Ci, is the ith degree polynomial conversion coefficient and, Lx,y, is mid-infrared radiance at the sensor in watts per steradian per centimeter squared (W sr-1 cm-2).
Data Access
These data are available through the Oak Ridge National Laboratory (ORNL) Distributed Active Archive Center (DAAC).
CARVE: L1 Airborne Forward Looking Infrared Radiance Counts, Alaska, 2013-2015
Contact for Data Center Access Information:
- E-mail: uso@daac.ornl.gov
- Telephone: +1 (865) 241-3952
References
Miller, C.E., Dinardo, S.J. et al. (2012). CARVE: The Carbon in Arctic Reservoirs Vulnerability Experiment., 2012 IEEE Aerospace Conference. http://dx.doi.org/10.1109/AERO.2012.6187026