Documentation Revision Date: 2017-03-01
Data Set Version: V1
Summary
These measurements are one part of an innovative multi-instrument remote sensing payload flown for the CARVE investigation.
There are 2725 files in NetCDF file format (*.nc) included in this data set.
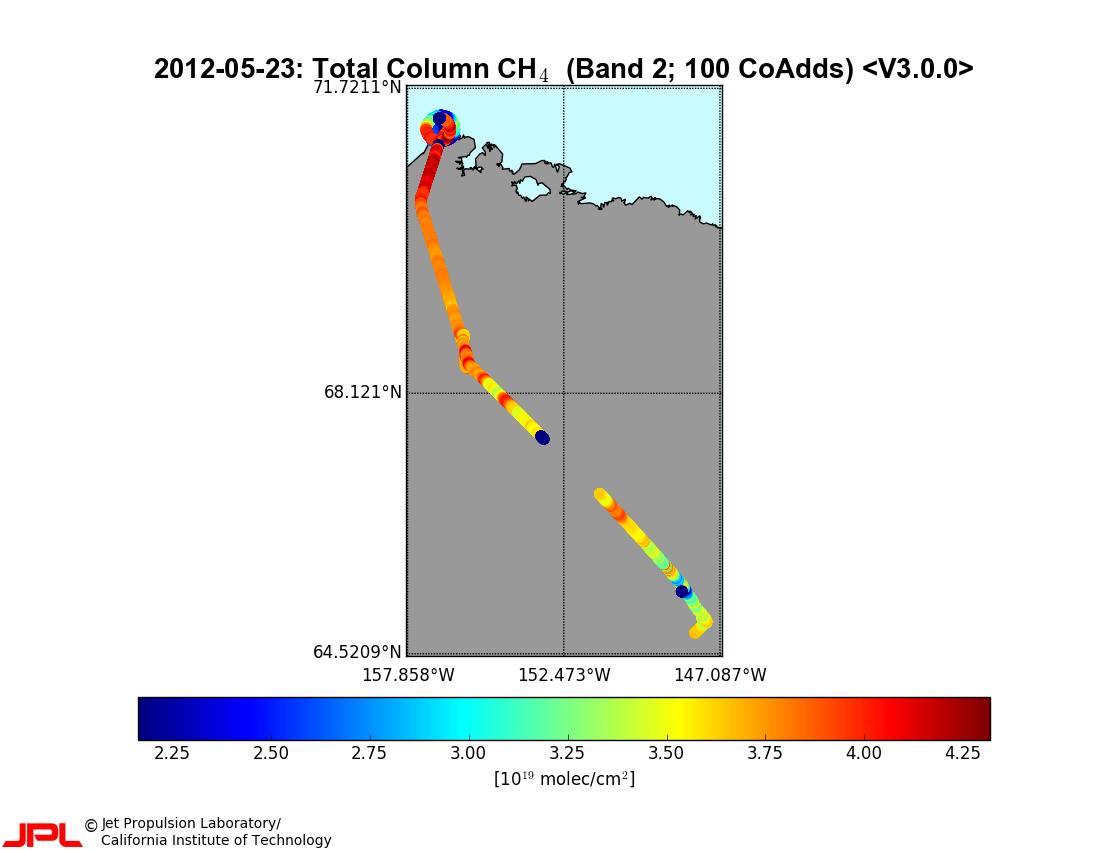
Figure 1. Total column CH4 retrievals (from Level 2 FTS product) from a CARVE flight on May 23, 2012, flying north from Fairbanks over the North Slope to Barrow.
Citation
Kurosu, T.P., C.E. Miller, S.J. Dinardo, and CARVE Science Team . 2017. CARVE: L1 Spectral Radiances from Airborne FTS, Alaska, 2012-2015. ORNL DAAC, Oak Ridge, Tennessee, USA. http://dx.doi.org/10.3334/ORNLDAAC/1426
Table of Contents
- Data Set Overview
- Data Characteristics
- Application and Derivation
- Quality Assessment
- Data Acquisition, Materials, and Methods
- Data Access
- References
Data Set Overview
Project: Carbon in Arctic Reservoirs Vulnerability Experiment (CARVE)
The Carbon in Arctic Reservoirs Vulnerability Experiment (CARVE) is a NASA Earth Ventures (EV-1) investigation designed to quantify correlations between atmospheric and surface state variables for Alaskan terrestrial ecosystems through intensive seasonal aircraft campaigns, ground-based observations, and analysis sustained over a 5-year mission. CARVE collected detailed measurements of greenhouse gases on local to regional scales in the Alaskan Arctic and demonstrated new remote sensing and improved modeling capabilities to quantify Arctic carbon fluxes and carbon cycle-climate processes. CARVE science fills a critical gap in Earth science knowledge and satisfies high priority objectives across NASA’s Carbon Cycle and Ecosystems, Atmospheric Composition, and Climate Variability & Change focus areas as well as the Air Quality and Ecosystems elements of the Applied Sciences program. CARVE data also complements and enhances the science return from current NASA and non-NASA sensors.
Related Data:
Level 2 Column Gas measurements from the Fourier Transform Spectrometer aboard CARVE flights are available as a separate data set:
CARVE: L2 Column Gas and Uncertainty from Airborne FTS, Alaska, 2012-2015
A full list of CARVE data products is available at: https://carve.ornl.gov/dataproducts.html
Data Characteristics
Spatial Coverage: CARVE flights over the Alaskan and Canadian Arctic
Spatial Resolution: Point measurements
Temporal Coverage: 20120523 - 20151113
Temporal Resolution: 1-second
Study Area (coordinates in decimal degrees)
|
Site |
Westernmost Longitude |
Easternmost Longitude |
Northernmost Latitude |
Southernmost Latitude |
|
Alaska and Canadian Arctic |
-168.111 |
-131.752 |
71.435 |
58.8438 |
Data File Information
There are 2725 files in NetCDF file format (*.nc) included in this data set. Each file contains spectral radiance values collected from the oxygen A (abo2), strong CO2 (sco2), and weak CO2 (wco2) bands of the FTS instrument during a portion of a CARVE flight.
Table 1. CARVE file naming convention. Example file name: carve_FTS_L1_b23_20120511_160419_20150915171127.nc
| Name element | Example value | Units |
| Project name | carve | |
| Instrument | FTS | |
| Processing level | L1 | |
| Build ID | b23 | |
| Flight date | 20120511 | yyyymmdd |
| Acquisition time | 160419 | hhmmss |
| Processing date and time | 20150915171127 | yyyymmddhhmmss |
Data variables
Each file contains four variable groups: aviation_housekeeping, geolocation, measurement_ancillary_info, and science_measurement. The variables contained within each variable group are described in Tables 2 to 5.
Table 2. aviation_housekeeping group in the NetCDF files
| Data variable | Units | Description |
| platform_latitude_low_precision | degree_north | platform latitude low precision |
| platform_longitude_low_precision | degree_east | platform longitude low precision |
Table 3. geolocation group in the NetCDF files
| Data variable | Units | Description |
| azimuth | degree | azimuth angle |
| center_lat | degree_north | latitude of footprint center |
| center_lat_standard_error | degree_north | standard error of latitude of footprint center |
| center_lon | degree_east | longitude of footprint center |
| center_lon_standard_error | degree_east | standard error of longitude of footprint center |
| geolocation_qc | N/A | geolocation calculations status |
| ground_speed | m s-1 | ground speed |
| heading | degree | heading |
| height | meters | height |
| height_bnds | meters | height of footprint vertex |
| height_standard_error | meters | standard error of height |
| lat_bnds | degree_north | latitude of footprint vertex |
| lon_bnds | degree_east | longitude of footprint vertex |
| measurement_time | seconds | seconds since 1980-01-06 0:0:0 |
| pitch | degree | pitch |
| platform_geolocation_qc | N/A | platform geolocation status |
| platform_height | meters | instrument height |
| platform_height_standard_error | meters | uncertainty of platform height |
| platform_latitude | degree_north | platform latitude |
| platform_latitude_standard_error | degree_north | uncertainty of platform latitude |
| platform_longitude | degree_east | platform longitude |
| platform_longitude_standard_error | degree_east | uncertainty of platform longitude |
| roll | degree | roll |
| solar_azimuth | degree | solar azimuth angle |
| solar_zenith | degree | solar zenith angle |
| stokes_coefficients | N/A | stokes polarization coefficients |
| TAI93 | N/A | seconds since 1993-01-01 0:0:0 |
| temperature_time | seconds | seconds since 1980-01-06 0:0:0 |
| time | seconds | seconds since 1980-01-06 0:0:0 |
| zenith | degree | zenith angle |
Table 4. measurement_ancillary_info group in the NetCDF files
| Data variable | Units | Description |
| beamsplitter_temperature | degrees_celsius | beamsplitter temperature |
| delta_opd_abo2 | cm-1 | delta opd abo2 |
| delta_opd_sco2 | cm-1 | delta opd sco2 |
| delta_opd_wco2 | cm-1 | delta opd wco2 |
| detector_enclosure_temperature | degrees_celsius | detector enclosure temperature |
| detector_saturation_abo2 | N/A | detector saturation abo2 |
| detector_saturation_sco2 | N/A | detector saturation sco2 |
| detector_saturation_wco2 | N/A | detector saturation wco2 |
| detector_temp_abo2 | degrees_celsius | abo2 detector temperature |
| detector_temp_sco2 | degrees_celsius | sco2 detector temperature |
| detector_temp_wco2 | degrees_celsius | wco2 detector temperature |
| electronic_box_temperature | degrees_celsius | electronic box temperature |
| instrument_mode * | N/A | instrument mode during data acquisition |
| interferometer_if_temperature | degrees_celsius | interferometer if temperature |
| internal_pressure | pascals | internal pressure |
| laser_temperature | degrees_celsius | laser temperature |
| maximum_opd_abo2 | cm-1 | maximum optical path difference abo2 |
| maximum_opd_sco2 | cm-1 | maximum optical path difference sco2 |
| maximum_opd_wco2 | cm-1 | maximum optical path difference wco2 |
| minimum_opd_abo2 | cm-1 | minimum optical path difference abo2 |
| minimum_opd_sco2 | cm-1 | minimum optical path difference sco2 |
| minimum_opd_wco2 | cm-1 | minimum optical path difference wco2 |
| number_of_interferogram_points_abo2 | N/A | number of interferogram points abo2 |
| number_of_interferogram_points_sco2 | N/A | number of interferogram points sco2 |
| number_of_interferogram_points_wco2 | N/A | number of interferogram points wco2 |
| outside_air_temperature | kelvins | outside air temperature |
| phase_correction_abo2 | N/A | phase correction abo2 |
| phase_correction_sco2 | N/A | phase correction sco2 |
| phase_correction_wco2 | N/A | phase correction wco2 |
| phase_residual_abo2 | N/A | phase residual abo2 |
| phase_residual_sco2 | N/A | phase residual sco2 |
| phase_residual_wco2 | N/A | phase residual wco2 |
| preamp_adc_enclosure_temperature | degrees_celsius | preamp adc enclosure temperature |
| spectral_sampling_abo2 | cm-1 | spectral sampling abo2 |
| spectral_sampling_sco2 | cm-1 | spectral sampling sco2 |
| spectral_sampling_wco2 | cm-1 | spectral sampling wco2 |
| start_wavenumber_abo2 | cm-1 | start wavenumber abo2 |
| start_wavenumber_sco2 | cm-1 | start wavenumber sco2 |
| start_wavenumber_wco2 | cm-1 | start wavenumber wco2 |
| sweep_direction ** | N/A | sweep direction |
| zero_opd_abo2 | cm-1 | zero optical path difference abo2 |
| zero_opd_sco2 | cm-1 | zero optical path difference sco2 |
| zero_opd_wco2 | cm-1 | zero optical path difference wco2 |
* instrument_mode: 0 --- Off; 1 --- Science; 2 --- Calibration; 3 --- Unknown
** sweep_direction: 0 --- Forward; 1 --- Reverse; 2 --- Both
Table 5. science_measurement group in the NetCDF files
| Data variable | Units | Description |
| spectral_radiance_imaginary_abo2 | N/A | upwelling spectral radiance in air abo2 band status |
| spectral_radiance_imaginary_sco2 | N/A | upwelling spectral radiance in air sco2 band status |
| spectral_radiance_imaginary_wco2 | N/A | upwelling spectral radiance in air wco2 band status |
| spectral_radiance_real_abo2 | W cm-2 cm-1 sr-1 | upwelling spectral radiance in air abo2 band real part |
| spectral_radiance_real_sco2 | W cm-2 cm-1 sr-1 | upwelling spectral radiance in air sco2 band real part |
| spectral_radiance_real_wco2 | W cm-2 cm-1 sr-1 | upwelling spectral radiance in air wco2 band real part |
| spectral_radiance_abo2_qc | W cm-2 cm-1 sr-1 | upwelling spectral radiance in air abo2 band imaginary part |
| spectral_radiance_sco2_qc | W cm-2 cm-1 sr-1 | upwelling spectral radiance in air sco2 band imaginary part |
| spectral_radiance_wco2_qc | W cm-2 cm-1 sr-1 | upwelling spectral radiance in air wco2 band imaginary part |
Application and Derivation
The carbon budget of Arctic ecosystems is not known with confidence because fundamental elements of this complex system are poorly quantified. The CARVE project was designed to collect data measurements of important greenhouse gases on local to regional scales in the Alaskan Arctic and demonstrate new remote sensing and improved modeling capabilities to quantify Arctic carbon fluxes and carbon cycle-climate processes. The CARVE data provide insights into carbon cycling that may be useful in numerous applications.
Quality Assessment
Each NetCDF file contains a global attribute master_quality_flag that provides a summary indication of the data quality level of the whole file. Its values are set to: "Good" --- all low level quality assessments passed; "Bad" --- some or all low level quality assessments failed; "UNK" --- quality is unknown.
In addition, each spectral radiance data product - from abo2 (oxygen A), sco2 (strong CO2), and wco2 (weak CO2) bands - has a quality flag associated with it. This flag consists of an integer number for each reported observation: -1 --- missing; 0 --- valid; 1 --- out of range; 2 --- error.
Data Acquisition, Materials, and Methods
CARVE Flights
These data represent one part of the data collected by the Carbon in Arctic Reservoirs Vulnerability Experiment. A C-23 Sherpa aircraft made frequent flights out of Fairbanks, Alaska between March and November over multiple years, observing the spring thaw, summer draw-down, and fall refreeze of the Arctic growing season. Flights concentrate observations on three study domains: the North Slope, the interior, and the Yukon River valley. North Slope flights cover regions of tundra and continuous permafrost and were anchored by flux towers in Barrow, Atqasuk, and Ivotuk. Flights to Prudhoe Bay characterize the CO2 and CH4 emissions from oil and natural gas processing plants. Flights over interior Alaska sample discontinuous permafrost, boreal forests, and wetlands. A complete list of CARVE flights can be found at: https://carve.ornl.gov/flights.html. Flight paths and atmospheric gas concentrations for CARVE surveys can be visualized through the CARVE Flight Data Visualization Tool (http://carve.ornl.gov/visualize) and are illustrated in Figure 2.
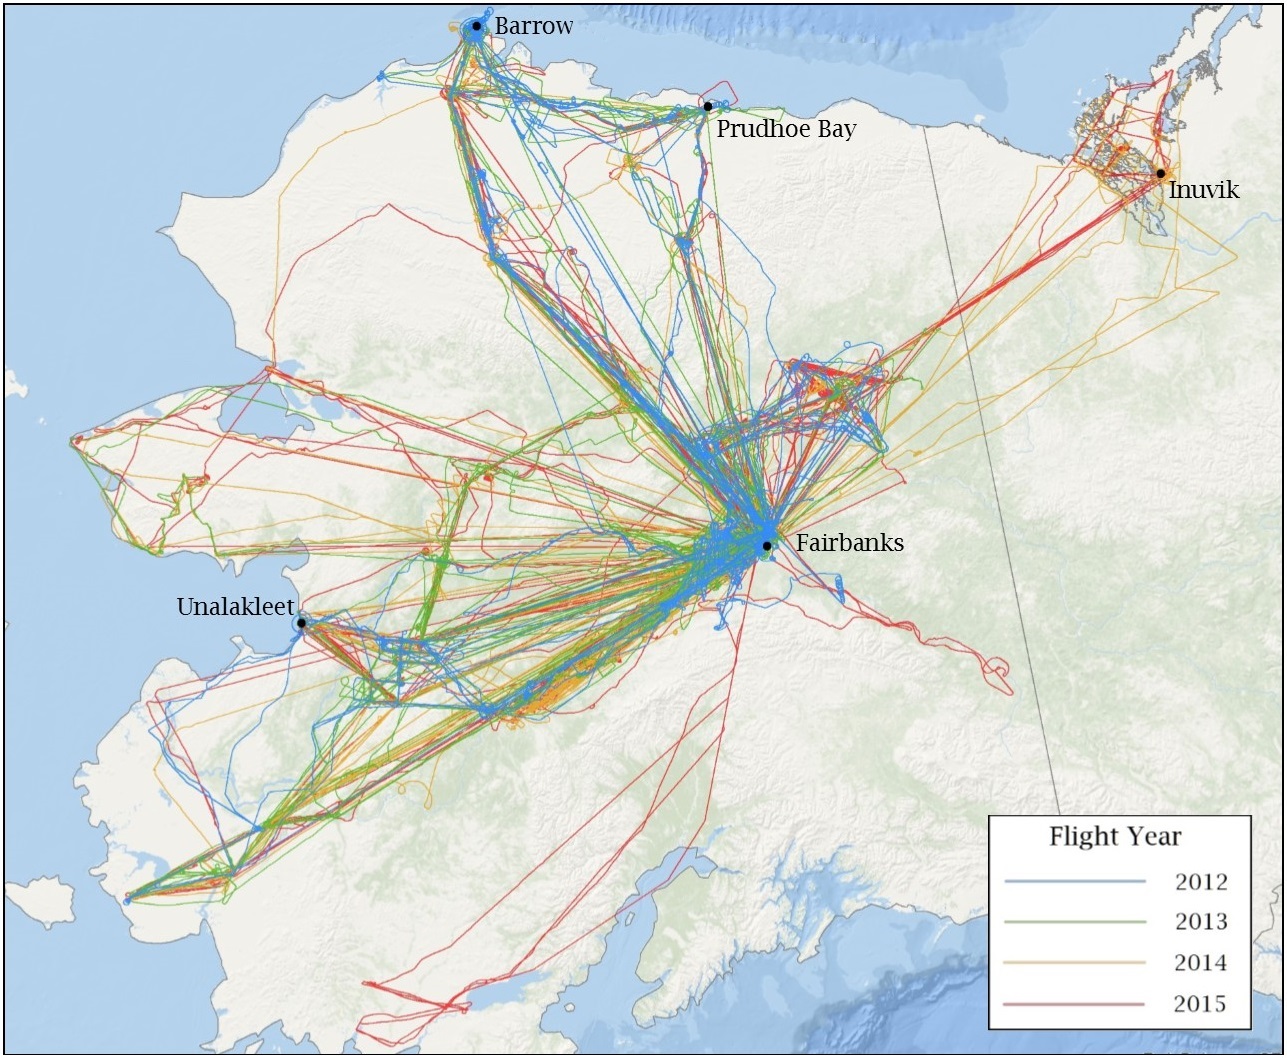
Figure 2. CARVE flights during 2012-2015 delivered measurements over continuous and discontinuous permafrost regimes.
The CARVE aircraft carried a remote sensing and atmospheric sampling payload consisting of the following instruments: a Fourier transform spectrometer (FTS), and an in situ gas analyzer suite (ISGA) with a gas analyzer and PFP sampling system (see https://carve.ornl.gov/documentation.html). All instruments were controlled by a master computer system (Data Acquisition and Distribution System, DADS). Data were logged and UTC time stamped at 1 second intervals. DADS also recorded GPS data (Lat, Lon, elevation), aircraft pitch, roll, and yaw, as well as basic meteorological data from onboard instruments.
Fourier Transform Spectrometer
The CARVE Fourier Transform Spectrometer (FTS; Figure 2) consists of three near-IR channels with spectral ranges of 12,920 – 13,180 cm-1 (Band 1), 5,820 – 6,380 cm-1 (Band 2), and 4,200 – 4,322 cm-1 (Band 3). Each band has a spectral resolution of 0.2 cm-1. The instrument can be operated in polarization mode, where each band records the S- and P-polarization components separately, or un-polarized. During 2012, the first year of operations, the FTS observed in polarization mode. In 2013, prompted by the challenging observation conditions in the Alaskan Arctic, the instrument configuration was changed to un-polarized in order to improve signal-to-noise ratios.
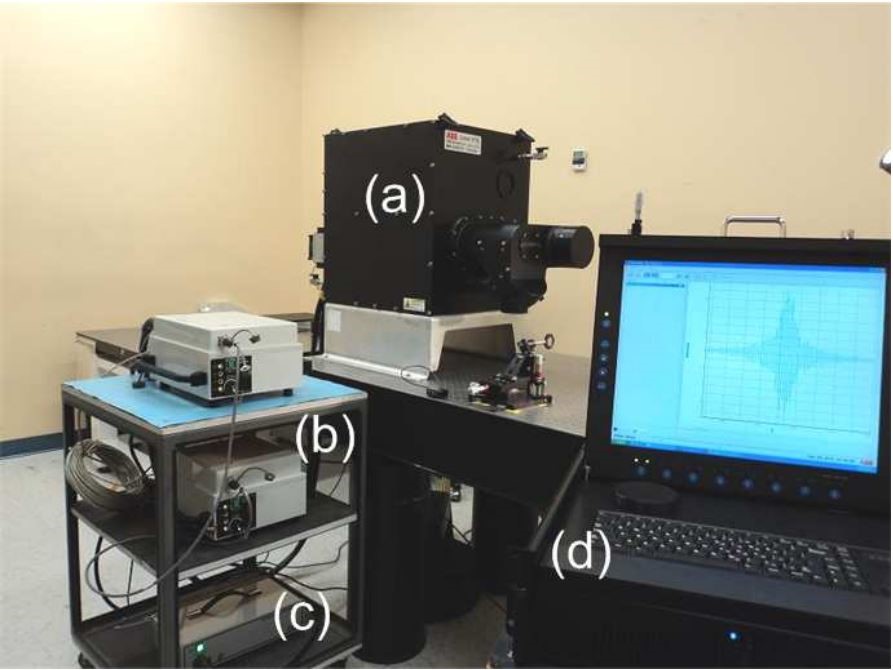
Figure 3. CARVE-FTS system: (a) instrument, (b) control electronic boxes, (c) power supply, and (d) interface control computer. Figure from Dupont et al., 2012.
The CARVE aircraft takes FTS nadir measurements in 1-second intervals along the flight track, corresponding roughly to a displacement of 100 m on the ground. For the retrievals, up to 100 of these 1-second observations are co-added to a single spectrum, corresponding to roughly 10 km along flight track. Pre-retrieval co-adding improves signal-to-noise ratio (SNR) of the observations and provides greatly improved uncertainties in the retrieved column values. Not necessarily all 100 spectra (per FTS band) with the 100-second co-adding interval are being used in the final, co-added spectrum. Rather, the selection is based on whether the specific set of three spectra – one from each of the three FTS bands – improves overall SNRs across the bands. If one or more of the three spectra significantly degrades the over SNR, the whole set is rejected. This ensures that (a) low SNR observations are discarded, and that (b) exactly the same set of 1-second observations is used in the 100-second co-added spectra for each band. The latter is important because dry-air columns are derived from ratios of retrievals performed in different bands, using different sets of 1 second spectra in each band for the same co-added observation would introduce a random source of error.
The CARVE FTS has a 10 degree field of view, which makes across-track coverage dependent on flight altitude.
Level 1 FTS Spectra product
The data from the FTS instrument was converted from Level 0 in raw form into a NetCDF 4 formatted Level 1 data product with the addition of quality control flags. Please contact the PI regarding whether any algorithm is applied in generating this data.
No radiometric calibration was performed for the FTS. Real radiance is uncalibrated atmospheric spectral radiance. Imaginary radiance is for diagnostic purposes only.
Data Access
These data are available through the Oak Ridge National Laboratory (ORNL) Distributed Active Archive Center (DAAC).
CARVE: L1 Spectral Radiances from Airborne FTS, Alaska, 2012-2015
Contact for Data Center Access Information:
- E-mail: uso@daac.ornl.gov
- Telephone: +1 (865) 241-3952
References
Dupont, F., F. Tanguay, M. Li, G. Perron, C.E. Miller, S.J. Dinardo, and T.P. Kurosu (2012). CARVE-FTS Observations of Arctic CO2, CH4, and CO - Overview of the Instrument, Proc. Of SPIE, 8532, 853204. http:dx.doi.org/10.1117/12.979826
Miller, C.E., Dinardo, S.J. et al. (2012). CARVE: The Carbon in Arctic Reservoirs Vulnerability Experiment., 2012 IEEE Aerospace Conference. http://dx.doi.org/10.1109/AERO.2012.6187026