Get Data
Summary:
This data set reports measurements of FPAR, nitrogen content, allometry equations, root biomass, LAI, tree biomass, soil respiration, and NPP field data in comma-separated ASCII files for BigFoot Project selected EOS Land Validation Sites in North America from 1999 to 2003. Derived landcover images and vegetation inventories for selected sites are presented as GeoTIFF files.
The BigFoot project gathered field data for selected EOS Land Validation Sites in North America from 1999 to 2003. Data collected and derived for varying intervals at the BigFoot sites and archived with this data set include FPAR, nitrogen content, allometry equations, root biomass, LAI, tree biomass, soil respiration, NPP, landcover images, and vegetation inventories.
Each site is representative of one or two distinct biomes, including the Arctic tundra; boreal evergreen needleleaf forest; temperate cropland, grassland, and deciduous broadleaf forest; desert grassland and shrubland. The project collected multi-year, in situ measurements of ecosystem structure and functional characteristics related to the terrestrial carbon cycle at the sites listed in Table 1. Companion files include documentation of measurement data, site and plot locations (Figure 2), and plot photographs for the SEVI and TUND sites (Figure 3).
BigFoot Project Background: Reflectance data from MODIS, the Moderate Resolution Imaging Spectrometer onboard NASA's Earth Observing System (EOS) satellites Terra and Aqua ( http://landval.gsfc.nasa.gov/index.html ), was used to produce several science products including land cover, leaf area index (LAI), gross primary production (GPP), and net primary production (NPP). The overall goal of the BigFoot Project was to provide validation of these products. To do this, BigFoot combined ground measurements, additional high-resolution remote-sensing data, and ecosystem process models at six flux tower sites representing different biomes to evaluate the effects of the spatial and temporal patterns of ecosystem characteristics on MODIS products. BigFoot characterized up to a 7 x 7 km area (49 1-km MODIS pixels) surrounding the CO2 flux towers located at six of the nine BigFoot sites. The sampling design allowed the Project to examine scales and spatial patterns of these properties, the inter-annual variability and validity of MODIS products, and provided for a field-based ecological characterization of the flux tower footprint. BigFoot was funded by NASA's Terrestrial Ecology Program.
Additional Documentation:
The BigFoot Field Manual (Campbell et al., 1999) provides background information on site and plot locations and measurements. [BigFoot_Field_Manual_1999.pdf]
For more details on the BigFoot Project, please visit the website: http://www.fsl.orst.edu/larse/bigfoot/index.html.
Additional site characteristics information is available on the ORNL DAAC FLUXNET web site [ http://www.fluxnet.ornl.gov/ ].
Carbon and energy flux data may be available for selected sites on the AmeriFlux Network web site [ http://ameriflux.lbl.gov/ ].
Table 1. BigFoot data are reported for the following six sites and parameters collected during the indicated years.
| Site | Site Location | Biome | FPAR | Nitrogen | Allometry | Roots | LAI | Biomass | Soil Resp. | NPP | Landcover & Veg. | Measurement Documentation |
|---|---|---|---|---|---|---|---|---|---|---|---|---|
| NOBS | BOREAS NSA, Canada | boreal forest | 2000 | 2000 | 1999, 2000, 2 *.tif (2000, 2001) | 2000 | 1999, 2000 | 1999, 2 *.tif (2000, 2001) | NOBS_README.pdf | |||
| ARGO | Bondville, Illinois, USA | cropland (corn and soybean rotation) | 2000 | 1999, 2000 | 2000 | 2000 | 1999, 2000, 2 *.tif (2000) | 1999, 2000 | 1999, *.tif (2000) | AGRO_README.pdf and Figure 1. | ||
| HARV | Harvard Forest LTER, Massachusetts, USA | temperate mixed forest | 2000, 2001, 2002 | 2000 | 2000, 2001, 2002, 2 *.tif (2000, 2001) | 2000 | 2000, 2001, 2002 | 2000, 2 *.tif (2000, 2001) | HARV_README.pdf | |||
| KONZ | Konza Prairie LTER, Kansas, USA | tallgrass prairie | 2000, 2001 | 2000 | 2000 | 2000, 2001, 3 *.tif (2000, 2001) | 2000, 2001 | 2000, 2001 | 2 *.tif (2000, 2001) | KONZ_README.pdf | ||
| SEVI | Sevilleta LTER, New Mexico, USA | desert | 2002 | 2002, 2003 | 2002, 2003 | 2002, 2003 | 2002, 2003 | 2002, 2003 | SEVI_README.pdf Plot Photos Included | |||
| TUND | Barrow, AK, USA | arctic tundra | 2002 | 2002 | 2002 | 2002 | 2002 | TUND_README.pdf Plot Photos Included |
Table 2. General Data Descriptions
Please refer to the site-specific Measurement Documentation referenced in Table 1 for additional information about the specific measurement methods and units reported for each Site.
| Parameter | Description | Units |
|---|---|---|
| FPAR | Fraction of Photosynthetically Active Radiation intercepted by the vegetation | Values range from 0 to 1. |
| Nitrogen | Vegetation tissue nitrogen concentration | Values are reported in total percent nitrogen. |
| Allometry | Equations for converting measured physical vegetation characteristics (e.g., tree diameter at breast height (DBH)) to biomass. | text |
| Roots | Root biomass data | All values reported on a dry weight basis as kg/ha |
| LAI | Leaf area index. | All data are reported as one-half total leaf surface area. All LAI values are unitless (m2/m2). |
| Biomass | Vegetation biomass | Biomass data are reported as kg dry mass per hectare |
| Soil Respiration | Soil CO2 flux | Grams of carbon per meter squared per second |
| NPP | Net primary production | All values reported as kg dry mass per hectare (per year). |
| Landcover/Veg | Site landcover and vegetation inventory |
 |
| Figure 1. Example of .tif file provided for LAI (leaf area index) data. This is an image of LAI from August 11, 2000 at the AGRO site (bf_agro_lai_aug_11_2000_x10_them_with_defaults.tif). For detailed information about the *.tif files provided for LAI and Landcover at selected sites, please refer to the site-specific Measurement Documentation referenced in Table 1. |
Data Citation:
Cite this data set as follows:
Gower, S. T. and A. A. Kirschbaum. 2008. BigFoot Field Data for North American Sites, 1999-2003. Data set. Available on-line [http://www.daac.ornl.gov] from Oak Ridge National Laboratory Distributed Active Archive Center, Oak Ridge, Tennessee, U.S.A. doi:10.3334/ORNLDAAC/868.
Related Data Sets:
- BIGFOOT GPP SURFACES FOR NORTH AND SOUTH AMERICAN SITES, 2000-2004
- BIGFOOT LAND COVER SURFACES FOR NORTH AND SOUTH AMERICAN SITES, 2000-2003
- BIGFOOT LEAF AREA INDEX SURFACES FOR NORTH AND SOUTH AMERICAN SITES, 2000-2003
- BIGFOOT NPP SURFACES FOR NORTH AND SOUTH AMERICAN SITES, 2000-2004
Data Description:
Data are organized by site with accompanying documentation that contains measurement information, data file contents, and *.tif file descriptions for the data reported for that site. See Table 1.
Site Locations:
Center and Tower coordinates for BigFoot sites are shown in Table 2 (below) and are provided as BigFoot_site_locations.csv.
Site Measurement Data and Sampling Plot Locations
Data files for each BigFoot site have been compiled and compressed (e.g., agro.zip). Each site's zipped file contains tabular data files and Geotif files as indicated in Table 1, and a file of sampling plot locations.
Data File Naming Syntax for Tabular Data Files:
BigFoot Site _ variable _ year.csv
For example, AGRO_biomass_2000.csv
Data File Naming Syntax for Geotiff Files:
bf_agro_lai_aug_11_2000_x10_them_with_defaults.tif
bf_agro_lai_aug_11_2000_x10_them_with_defaults.tfw (metadata file)
These are the file names used by the data provider. Each .tif file also has an identified readme file in the their respective Site's companion document. These readmes have general, layer, map, attribute, and additional information.
Sampling Plot Locations
Locations of the sampling plots at each of the sites are provided in a .csv file (e.g., HARV_plot_locations.csv)
A typical site and plot sampling design is shown in the following figure excerpted from the BigFoot Field Manual (Campbell et al., 1999).
Companion Documentation
Site Measurement Documentation
A companion document is provided for each site with descriptions of the data reported for that site.
For example, HARV_README.pdf
HARV Site: BigFoot Field Data Documentation
Contents:
- 2000, 2001, 2002 HARV LAI FPAR README DOCUMENT
- 2000 HARV ROOT BIOMASS README DOCUMENT
- 2000 HARV BIOMASS README DOCUMENT
- 2000 HARV ALLOMETRIC EQUATIONS README DOCUMENT
- 2000, 2001, 2002 HARV ANPP README DOCUMENT
- 2000 HARV VEGETATION COVER TYPE README DOCUMENT
- README for bf_harv_landcover_2000_igbp.tif
- README for bf_harv_landcover_2001_igbp.tif
- README for bf_harv_lai_aug_4_2000_x10_them_with_defaults.tif
- README for bf_harv_lai_july_26-28_x10_them_with_defaults.tif
- ...
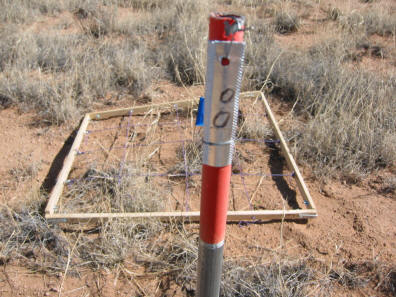
Photographs of SEVI and TUND Site Plots
A set of five pictures was taken of each SEVI and TUND site plot during selected measurement events.
In each set of images:
- first picture is of the plot center stake
- second facing north from plot center
- third facing east from plot center
- fourth facing south from plot center
- fifth facing west from plot center
Subplots are numbered 1, 2, 3, 4, and 5 referring to center, north, east, south, and west, respectively.
SEVI Plot Photos:
The photos have been compiled into a single companion file (sevi_plot_photos.zip, 1040 MB in size). The plot pictures are organized in folders that indicated the month and year the photos were taken (e.g., 3_02, for March of 2002).The SEVI image file name syntax follows this template: PLOT_SUBPLOT.jpg
For example, 00_1.jpg is SEVI site plot 0, subplot 1
TUND Plot Photos:
The photos have been compiled into a single companion file (tund_plot_photos.zip, 346 MB in size). The plot pictures are organized in folders that indicated the month and year the photos were taken (e.g., 7_02, for July of 2002).The TUND image file name syntax follows this template: TUND_PLOT_SUBPLOT.jpg
For example, TUND_00_1.jpg is TUND site, plot 0, subplot 1
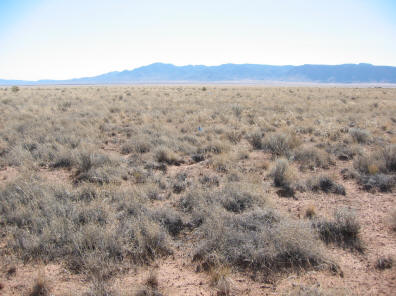
Figure 3. Example photographs of study plots taken at the SEVI site on May 21-29, 2002. Left photo is Plot 0, Subplot 1 (center) and right photo is Plot 0, Subpolot 3 (east). Photos of plots and subplots are available for SEVI and TUND sites as companion files. Table 3. BigFoot Site Locations
Site Name Latitude Longitude UTM-X Coord UTM-Y Coord UTM Zone NOBS Center 55.885260 -98.477268 532698 6193433 14N NOBS Tower 55.879547 -98.480843 532479 6192795 14N KONZ Center 39.089073 -96.571398 710046 4329469 14N KONZ Tower 39.082286 -96.560251 711030 4328742 14N ARGO Center 40.0066580 -88.291535 389764 4429295 16N ARGO Tower 40.006627 -88.291030 389807 4429291 16N HARV Center 42.528513 -72.172907 732194 4712333 18N HARV Tower 42.538259 -72.171378 732283 4713419 18N TUND Center 71.271908 -156.613307 585509 7909410 4N TUND Tower 71.280866 -156.612205 585509 7910410 4N SEVI Center 34.350858 -106.689897 344578 3802353 13N SEVI Tower 34.360290 -106.700285 343640 3803415 13N
The Universal Transverse Mercator (UTM) coordinate system is a grid-based method of specifying locations on the surface of the Earth. It is used to identify locations on the earth, but differs from the traditional method of latitude and longitude in several respects. The UTM system is not a single map projection. The system instead employs a series of sixty zones, each of which is based on a specifically defined Transverse Mercator projection. The easting is the projected distance in meters of the position from the central meridian, while the northing is the projected distance in meters of the point from the equator.
http://en.wikipedia.org/wiki/Universal_Transverse_Mercator_coordinate_system http://www.ngs.noaa.gov/TOOLS/utm.html http://erg.usgs.gov/isb/pubs/factsheets/fs07701.html Methods of in situ measurements of land cover, LAI, fAPAR, NPP, leaf nitrogen, and soil respiration.
The complex sampling design is efficient, but it required differential processing Global Positioning System (GPS) units to accurately locate the plots in the field. Plots were located in all vegetation cover classes within the 25-km2 grid to ensure adequate coverage as shown in Figure 2.
Vegetation cover, LAI, fAPAR, and NPP were measured at several subplots within each plot for at least two years. LAI was measured using standard direct and optical methods at each site (Gower et al. 1999). Direct measurement approaches included periodic area harvest for non-forest sites and application of allometric equations to tree diameter data for forest sites. LAI and fAPAR were also estimated indirectly using the Li-Cor LAI-2000 Plant Canopy Analyzers (Fassnacht et al. 1994, Chen et al. 1997, Gower et al. 1997, Gower et al. 1999). Therefore, the number of LAI/ fAPAR measurement campaigns varied among sites, as phenology of LAI development varies among biomes, among ecosystems within each biome, and between years for a given ecosystem. Consequently, LAI and fAPAR were measured three times each year at the forest sites and four to six times at other sites.
fAPAR was estimated two ways: from the DIFN variable provided by the Li-Cor LAI-2000 Plant Canopy Analyzer (Gower et al. 1999) and from a continuous PAR tram system. We designed and successfully deployed a PAR tram at NOBS in 2000. The PAR tram measured incident and reflected PAR both above and below the canopy at small increments along a 30 m track. A tram was installed at AGRO, SEVI, HARV, and NOBS in 2002 for several reasons. First, the fraction of direct to diffuse PAR influences LUE (Gower et al. 1999), and this relationship varies with canopy structure. Furthermore, the continuous measurements provide more complete characterization of daily and seasonal patterns of fAPAR.
NPP (the sum of the annual biomass production of each tissue for all vegetation strata) was measured for a minimum of two years at approximately 50 plots at all five newer sites. NPP is defined as equal to NPPW + NPPF + NPPCR + NPPFR + NPPU + NPPGC, where W = aboveground wood (e.g., stem + branches), F = foliage, CR = coarse roots, FR = fine roots, U = understory, and GC = ground cover (e.g., mosses and sphagnum). This equation is appropriate for any terrestrial ecosystem, but the field methods used to estimate each component vary among ecosystems (Gower et al. 1999).
- Aboveground woody biomass (e.g., stem and branch) and coarse root biomass was also estimated from investigator derived site-specific allometric equations that correlate component biomass to stem diameter at breast height (1.3 m).
- Woody biomass increment was determined from radial growth, measured using increment cores. As tropical trees do not produce reliable annual growth rings, we used rust-resistant dendrometer bands (Walker and Whiteaker 1988) to measure annual diameter growth. The number of tree species and size classes were determined during the 2001 reconnaissance trip.
- Numerous abiotic and biotic factors have been shown to influence the allometric coefficients for new foliage biomass; therefore we estimated new foliage production from annual leaf litterfall detritus production for forests where site- and species-specific allometric equations are not available (Gower et al. 1999). This approach assumed the canopy biomass is in steady state. Total foliage biomass and leaf area equations are from the literature.
- Where appropriate, biomass and leaf area data for harvested trees of the same species, but different sites, were composited and a generalized regression equation was used.
- NPPA (aboveground NPP) of the shrub and herbaceous layers was quantified using clip plots.
- We also used clip plots throughout the growing season to quantify biomass production at the non-forest sites.
- NPPA of bryophytes, lichens, etc. was estimated using crank wires and ingrowth mesh plots (Gower et al. 1997, Bisbee et al. 2000).
- Fine root net primary production and mortality was estimated using minirhizotrons (Steele et al. 1997). Measurements on NPPB (belowground NPP) were restricted to the two dominant vegetation types within a site because of the large costs associated with obtaining and processing these data. Minirhizotrons were installed in each ecosystem and fine root growth was measured for two years.
- In the forest ecosystems, coarse root NPP was estimated from allometric equations.
- At the KONZ site, separate allometric equations were developed for each grass component relating percent cover to biomass. Allometric equations were calculated for each sampling date and for unburned and burned leaf and stem components.
Leaf nitrogen concentration as % nitrogen by mass of leaves was measured from dominant species. Five plants of each dominant species were sampled. Fresh leaves were dried, digested by Kjeldahl incubation, and colormetrically analyzed for nitrogen.
Soil Respiration measurements at SEVI (2002 and 2003) and TUND (2002) sites were done at the same collars/plots each year. Respiration measurements were taken with a LICOR 6250 CO2 analyzer using chamber size of 10759 cm3. Light and dark measurements were taken at each collar, with five collars per plot or 10 along intensively measured transects. Vegetation was not clipped prior to measurements.
The BigFoot Field Manual (Campbell et al., 1999) provides background information on NOBS, AGRO, HARV, and KONZ site and plot locations and measurements. [ BigFoot_Field_Manual_1999.pdf]
The individual site measurement documentation listed in Table 1 provides the best documentation relating to data as reported and archived.
References:
Bisbee, K. E,. Gower, S. T., Norman, J.M., Nordheim, E.V. 2001. Environmental controls on ground cover species composition and productivity in a boreal black spruce forest. Oecologia 129:261-70.
Brye, K.R., J.M. Norman, L.G. Bundy, and S.T. Gower. 2000. Water budget evaluation of prairie and maize ecosystems. Soil Sci. Soc. Am. J. 64:715-725.
Campbell, J. L., Burrows, S., Gower, S. T., and Cohen, W. B. 1999. Bigfoot Field Manual, Version 2.1. ORNL/TM-1999/216. Oak Ridge National Laboratory, Oak Ridge, Tennessee.
Chen, J., P.W. Rich, S.T. Gower, J.M. Norman, and S. Plummer. 1997. Leaf area index of boreal forests: Theory, techniques and measurements. J. Geophys. Res. 102 D24:29,429- 29,444.
Fassnacht, K.S., S.T. Gower, J.M. Norman and R.E. McMurtrie. 1994. A comparison of optical and direct methods for estimating foliage surface area index in forests. Agr. Forest Meteorol. 71:183-207.
Gower, S.T. 1987. Relations between mineral nutrient availability and fine root biomass in two Costa Rican tropical wet forests: A hypothesis. Biotropica 19:171-175.
Gower, S.T. and Vitousek, P.M. 1989. Effects of nutrient amendments on fine root biomass in a primary successional forest in Hawaii. Oecologia 81: 566-568.
Gower, S.T., J. Vogel, J.M. Norman, C.J. Kucharik, S.J. Steele, T.K. Stow. 1997. Carbon distribution and net primary production of aspen, jack pine and black spruce BOREAS forests. J. Geophys. Res. 102 D24:29,029-29,041.
Gower, S.T., Kucharik, C.J., and J.M. Norman. 1999. Direct and indirect estimation of leaf area index, fAPAR and net primary production of terrestrial ecosystems. Remote Sensing of Environment 70:29-51.
Steele, S.J., S.T. Gower, J. Vogel, J.M. Norman. 1997. Root mass, production and turnover of boreal aspen, jack pine and black spruce forests. Tree Physiol. 17:577-587.
Walker, L. R., and L. D. Whiteaker. 1988. Rust prevention on dendrometer bands. Biotropica 20:336-337.
Abbreviations and Acronyms:
AGRO - agricultural cropland
BOREAS - Boreal Ecosystem-Atmosphere Study
DBH - diameter at breast height (4.5 ft above ground)
DIFN - is an indicator of "canopy light absorption".
EOS - Earth Observing System
fAPAR - fraction absorbed photosynthetic active radiation
GPP - gross primary production
GPS - Global Positioning System
HARV - Harvard Forest
KONZ - Konza Prairie
LAI - leaf area index
LTER - Long-Term Ecological Research
LUE - light use efficiency
MODIS - moderate resolution imaging spectrometer
NASA - National Aeronautics and Space Administration
NOBS - northern old black spruce
NPP - net primary production
NPPA - aboveground NPP
NPPB - belowground NPP
NSA - Northern Study Area
PAR - photosynthetically active radiation
SEVI - New Mexico desert, Sevietta - an LTER site in New Mexico
TUND - artic tundra
UTM - Universal Transverse Mercator
Document Information:
2008/06/11
Document Review Date:
2008/06/11
Document Curator:
webmaster@daac.ornl.gov
Document URL:
http://daac.ornl.gov