Documentation Revision Date: 2023-06-15
Dataset Version: 1
Summary
NASA facility instruments operate out of a NASA research center and support multiple science disciplines, field investigations, and NASA science objectives. Facility instruments are supported by managers in the Earth Science Division (ESD) Research and Analysis Program, and/or the Earth Observation System (EOS) Project Science Office. The AVIRIS-Classic system resides at the JPL. The AVIRIS project operates under the Observational Systems Division of the Jet Propulsion Laboratory. In addition to operating and maintaining the sensor, the AVIRIS project works to ensure that experiment requirements are met for each flight and that users are satisfied with data quality and the level of service provided.
This dataset will include all L2 files from the AVIRIS-Classic facility instrument. See Table 1 below for descriptions of data products.
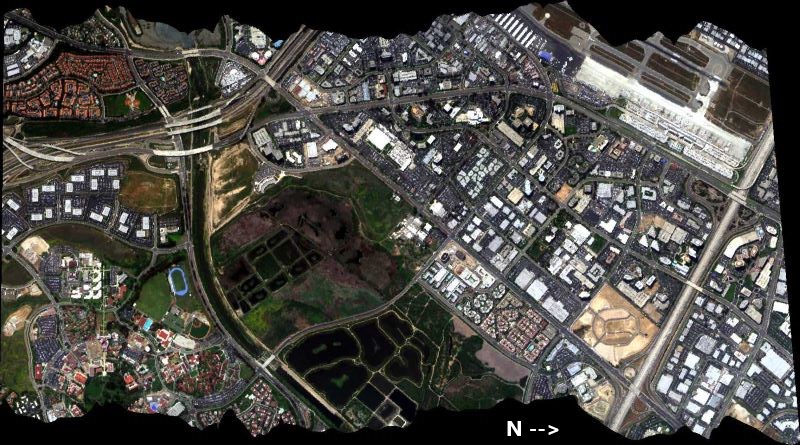
Figure 1. RGB composite image from AVIRIS-Classic flight f060510t01p00r06 on May 10 2006 over Irvine, California. Source: f060510t01p00r06_sc01_RGB.jpeg.
Citation
Green, R.O., D.R. Thompson, J.W. Boardman, J.W. Chapman, M. Eastwood, M. Helmlinger, S.R. Lundeen, and W. Olson-Duvall. 2023. AVIRIS-Classic: L2 Calibrated Reflectance, Facility Instrument Collection. ORNL DAAC, Oak Ridge, Tennessee, USA. https://doi.org/10.3334/ORNLDAAC/2154
Table of Contents
- Dataset Overview
- Data Characteristics
- Application and Derivation
- Quality Assessment
- Data Acquisition, Materials, and Methods
- Data Access
- References
Dataset Overview
This dataset contains Level 2 (L2) orthocorrected reflectance from the Airborne Visible / Infrared Imaging Spectrometer (AVIRIS-Classic) instrument. This is the NASA Earth Observing System Data and Information System (EOSDIS) facility instrument archive of these data. The NASA AVIRIS-Classic is a pushbroom spectral mapping system with high signal-to-noise ratio (SNR), designed and toleranced for high performance spectroscopy. AVIRIS-Classic measures reflected radiance in 224 contiguous bands at approximately 10-nm intervals in the Visible to Shortwave Infrared (VSWIR) spectral range from 400-2500 nm. The AVIRIS-Classic sensor has a 1 milliradian instantaneous field of view, providing altitude dependent ground sampling distances from 20 m to sub meter range. AVIRIS-Classic is flown on a variety of aircraft platforms including the Twin Otter, NASA’s WB-57, and NASA's high altitude ER-2. For each flight line, two types of L2 data files may be included: (a) calibrated surface reflectance and (b) water vapor and optical absorption paths for liquid water and ice. The L2 data are provided in ENVI format, which includes a flat binary file accompanied by a header (.hdr) file holding metadata in text format. This archive currently includes data from 2008 - 2020. Additional AVIRIS-Classic facility instrument L2 data will be added as they become available. AVIRIS-Classic supports NASA Science and applications in many areas including plant composition and function, geology and soils, greenhouse gas mapping, and calibration of orbital platforms.
Project: AVIRIS
The Airborne Visible InfraRed Imaging Spectrometer - Classic (AVIRIS-C) and Next Generation (AVIRIS-NG) are two Facility Instruments (FIs) that are part of NASA’s Airborne Science Program (ASP) and the Jet Propulsion Laboratory’s (JPL) Earth Science Airborne Program. The AVIRIS-C is an imaging spectrometer that delivers calibrated images of the upwelling spectral radiance in 224 contiguous spectral channels with wavelengths from 400 to 2500 nanometers (nm). The AVIRIS-NG is the successor to AVIRIS-Classic and provides high signal-to-noise ratio imaging spectroscopy measurements in 425 contiguous spectral channels with wavelengths in the solar reflected spectral range (380-2510 nm). The AVIRIS-NG started operation in 2014 and is expected to replace the AVIRIS-C instrument. Data from AVIRIS-C and AVIRIS-NG have been applied to a wide range of studies in the fields of terrestrial and coastal aquatic plant physiology, atmospheric and aerosol studies, environmental science, snow hydrology, geology, volcanology, oceanography, soil and land management, agriculture, and limnology.
Related Publication
Green, R.O., M.L. Eastwood, C.M. Sarture, T. G. Chrien, M. Aronsson, B.J. Chippendale, J.A. Faust, B.E. Pavri, C. J. Chovit, M. Solis, M.R. Olah, and O. Williams. 1998. Imaging Spectroscopy and the Airborne Visible/Infrared Imaging Spectrometer (AVIRIS). Remote Sensing of Environment 65:227- 248. https://doi.org/10.1016/S0034-4257(98)00064-9
Related Datasets
Green, R.O., D.R. Thompson, J.W. Boardman, J.W. Chapman, M. Eastwood, M. Helmlinger, S.R. Lundeen, and W. Olson-Duvall. 2023. AVIRIS-Classic: L1B Calibrated Radiance, Facility Instrument Collection. ORNL DAAC, Oak Ridge, Tennessee, USA. https://doi.org/10.3334/ORNLDAAC/2155
- The L2 data in this dataset were derived from these L1 data.
Green, R.O., P.G. Brodrick, J.W. Chapman, M. Eastwood, S. Geier, M. Helmlinger, S.R. Lundeen, W. Olson-Duvall, R. Pavlick, L.M. Rios, D.R. Thompson, and A.K. Thorpe. 2023. AVIRIS-NG L1B Orthocorrected Surface Radiance, Facility Instrument Collection. ORNL DAAC, Oak Ridge, Tennessee, USA. https://doi.org/10.3334/ORNLDAAC/2095
Green, R.O., S. Nolte, M. Helmlinger, and D.R. Thompson. 2023. AVIRIS-NG L2 Orthocorrected Calibrated Reflectance, Facility Instrument Collection. ORNL DAAC, Oak Ridge, Tennessee, USA. https://doi.org/10.3334/ORNLDAAC/2110
- These two datasets provide L1B and L2 data for the related AVIRIS-NG instrument
Green, R.O., and D.R. Thompson. 2023. AVIRIS Facility Instruments: Flight Line Geospatial Polygons and Contextual Data, V1. ORNL DAAC, Oak Ridge, Tennessee, USA. https://doi.org/10.3334/ORNLDAAC/2140
- Flight line ancillary information in tabular and attributed polygon vector files for AVIRIS-Classic and AVIRIS-NG.
Data Characteristics
Spatiotemporal Characteristics
| Year | Number of flight lines | Spatial Coverage | Temporal Coverage |
|---|---|---|---|
| 2008 | 3 | United States (California) | 2008-06-11 to 2008-08-08 |
| 2011 | 2 | United States (Colorado; Utah) | 2011-05-12 to 2011-06-09 |
| 2013 | 13 | United States (California) | 2013-03-29 to 2013-08-21 |
| 2014 | 261 | United States (California; Nevada); Mexico | 2014-03-31 to 2014-11-24 |
| 2015 | 306 | United States (California; Nevada) | 2015-01-20 to 2015-10-30 |
| 2016 | 88 | United States (California; Nevada) | 2016-01-12 to 2016-06-20 |
| 2017 | 287 | United States (Alabama; Arizona; Arkansas; California; Florida; Georgia; Kansas; Kentucky; Mississippi; Missouri; Nevada; Oklahoma; Tennessee); Mexico | 2017-01-17 to 2017-12-21 |
| 2018 | 282 | United States (Arizona; California; Nevada; Oregon); Mexico | 2018-01-11 to 2018-09-18 |
| 2019 | 113 | United States (Arizona; California; Idaho; Montana; Nevada; Oregon; Utah; Washington); Mexico | 2019-08-02 to 2019-10-01 |
| 2020 | 17 | United States (California; Nevada) | 2020-10-06 to 2020-10-13 |
Temporal Resolution: One-time estimate
Study Area: All latitudes and longitudes given in decimal degrees.
| Westernmost Longitude | Easternmost Longitude | Northernmost Latitude | Southernmost Latitude |
|---|---|---|---|
| -171.842 | -81.020 | 48.695 | 18.574 |
Data File Information
This dataset includes ENVI binary files (.bin) with associated header (.hdr) files holding metadata in text format.
See Table 1 for descriptions of L2 products.
The naming convention for the ENVI files is <flight prefix>_<product>_<ver>_img<ext>, where
- <flight prefix> = flight line identifier, f<YYMMDD>t01p00r<aa>, encoding the date and time by year (YY), month (MM), day (DD), and the airborne flight run number (aa) (e.g., f060426t01p00r03).
- <product> = Level 2 data product as described in Table 1.
- <ver> = optional element denoting radiance software version (e.g., "v1d).
- <ext> = file extension of ".bin" denotes ENVI binary data files, while “.hdr” denotes the ENVI header files.
The header (.hdr) for each ENVI holds metadata for the binary data file, including:
- number of samples (rows), lines (rows), and bands
- band information: wavelengths, fwhm, reflectance correction factors
- data type (4 = Float32, 5=Float64), interleave type, and byte order
- map info: projection and datum, coordinates for x y reference points, pixel size, and map units
See https://www.l3harrisgeospatial.com/docs/enviheaderfiles.html for the header format.
The ENVI files are in a rotated UTM projection that follows the trajectory of the respective flight path.
Example file names for one flight line are:
f201013t01p00r05_corr_v1l1_img.bin
f201013t01p00r05_corr_v1l1_img.hdr
f201013t01p00r05_h2o_v1l1_img.bin
f201013t01p00r05_h2o_v1l1_img.hdr
Table 1. Level 2 data products in ENVI format.
| Product abbreviation | Description | Units | Bands |
|---|---|---|---|
| corr, rfl, refl | Orthocorrected surface reflectance derived from measured radiances (uW nm-1 cm-2 sr-1). Water absorption bands have been removed and a slight smoothing was applied to the spectra. | 1 | 224 bands at wavelengths of 400 nm to 2500 nm in approximately 10-nm intervals. Wavelength and FWHM for each band is listed in the ENVI header file. Valid reflectance values range 0.0 to 1.0. |
| h2o | Column water vapor and optical absorption paths for liquid water and ice for flight line | cm | 3 bands: column water vapor, total liquid water absorption path, total ice absorption path |
| rfl, refl | Orthocorrected surface reflectance derived from measured radiances (uW nm-1 cm-2 sr-1). These ENVIs include all absorption bands without smoothing; water absorption bands are included. | 1 | 224 bands at wavelengths of 400 nm to 2500 nm in approximately 10-nm intervals. Wavelength and FWHM for each band is listed in the ENVI header file. Valid reflectance values range 0.0 to 1.0. |
User note: There is variation in the naming system for these files among years; however, all file names begin with the flight prefix.
Application and Derivation
The main objective of the AVIRIS project is to identify, measure, and monitor constituents of the Earth's surface and atmosphere based on molecular absorption and particle scattering signatures. Research with AVIRIS data is predominantly focused on understanding processes related to the global environment and climate change.
The NASA Airborne Visible/Infrared Imaging Spectrometer (AVIRIS-Classic) has been in operation since 1989 acquiring contiguous spectral measurements between 380 and 2510 nm for use by a range of terrestrial ecology science investigations related to: (1) pattern and spatial distribution of ecosystems and their components, (2) ecosystem function, physiology and seasonal activity, (3) biogeochemical cycles, (3) changes in disturbance activity, and (4) ecosystems and human health.
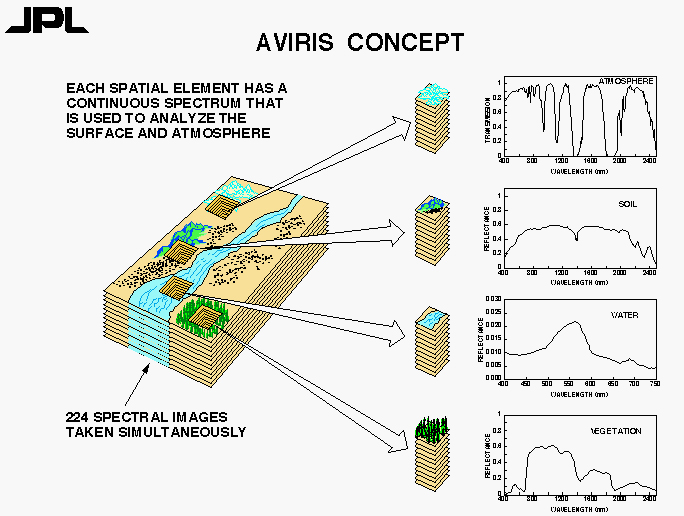
Figure 2. Overview of AVIRIS concept depicting how hyperspectral imagery provides information on characteristics of the atmosphere and earth’s surface. Source: https://aviris.jpl.nasa.gov/aviris/concept.html
Beginning in 2009, a new NASA Earth Science airborne sensor called the Next Generation Airborne Visible/Infrared Imaging Spectrometer (AVIRIS-NG) was developed by JPL through the funding support from the American Recovery and Reinvestment Act (ARRA). Technical and programmatic oversight of the AVIRIS-NG development was provided by NASA’s Earth Science Technology Office (ESTO).
Quality Assessment
AVIRIS radiometric calibration factors are calculated by measuring the response of AVIRIS to an integrating sphere (a known target illuminated by a known light source). This calibration is accurate to within 7%, absolute, over time. Intra-flight accuracy is within 2%. See Boardman (2014) for details regarding the orthocorrection process.
The AVIRIS calibration procedure addresses electronic effects involving radiometric responses of each detector, optical effects involving the spatial and spectral view of each detector, and radiometric calibration. Detector responsiveness is measured at the beginning of each deployment and mid-flight for particularly long deployments. Instrument artifacts in the spectrometer data, such as striping, are removed statistically by minimizing a Markov Random Field model. Likewise, bad pixels are identified and corrected using statistical methods followed by laboratory and field protocols to evaluate effectiveness.
Data Acquisition, Materials, and Methods
AVIRIS-Classic measures radiance in the nominal wavelength range from 400 nm to 2500 nm with approximately 10-nm sampling (Green et al., 1998). The actual range of wavelengths is approximately 365 to 2510 nm, and the ENVI header files for the reflectance products list the center wavelenghts and FWHM for each band. Spectra are measured as images with 677 cross-track elements and spatial sampling from 4 m to 20 m. AVIRIS-Classic is compatible with a broad array of possible aircraft platforms, such as NASA’s ER-2 jet, the Twin Otter DHC-6 turboprop, and the WB-57.
These L2 reflectance products were derived from L1B radiance products (Green et al., 2023a). Examples of the methods employed are available in Gao et al. (1993) and Thompson et al. (2015a, 2015b).
Additional details about the AVIRIS-Classic instrument are available at https://doi.org/10.3334/ORNLDAAC/2155
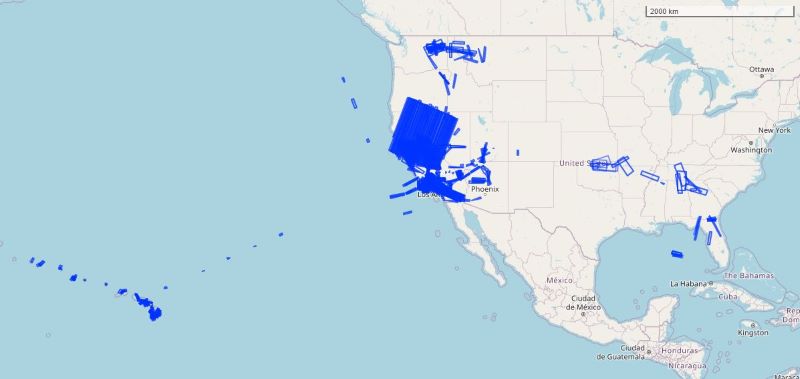
Figure 3. Distribution of AVIRIS-Classic flight lines with L2 data from 2008-2020 across the conterminous US, Hawaiian Islands, and eastern Pacific Ocean.
Data Access
These data are available through the Oak Ridge National Laboratory (ORNL) Distributed Active Archive Center (DAAC).
AVIRIS-Classic: L2 Calibrated Reflectance, Facility Instrument Collection
Contact for Data Center Access Information:
- E-mail: uso@daac.ornl.gov
- Telephone: +1 (865) 241-3952
References
Gao, B.C., K.H. Heidebrecht, and A.F.H. Goetz. 1993. Derivation of scaled surface reflectances from AVIRIS data. Remote Sensing of Environment 44:165-178. https://doi.org/10.1016/0034-4257(93)90014-O
Green, R.O., M.L. Eastwood, C.M. Sarture, T. G. Chrien, M. Aronsson, B.J. Chippendale, J.A. Faust, B.E. Pavri, C. J. Chovit, M. Solis, M.R. Olah, and O. Williams. 1998. Imaging Spectroscopy and the Airborne Visible/Infrared Imaging Spectrometer (AVIRIS). Remote Sensing of Environment 65:227- 248. https://doi.org/10.1016/S0034-4257(98)00064-9
Green, R.O., S. Nolte, M. Helmlinger, and D.R. Thompson. 2022. AVIRIS-NG L1B Orthocorrected Calibrated Radiance, Facility Instrument Collection. ORNL DAAC, Oak Ridge, Tennessee, USA. https://doi.org/10.3334/ORNLDAAC/2095
Green, R.O., D.R. Thompson, J.W. Boardman, J.W. Chapman, M. Eastwood, M. Helmlinger, S.R. Lundeen, and W. Olson-Duvall. 2023a. AVIRIS-Classic: L1B Calibrated Radiance, Facility Instrument Collection. ORNL DAAC, Oak Ridge, Tennessee, USA. https://doi.org/10.3334/ORNLDAAC/2155
Green, R.O., P.G. Brodrick, J.W. Chapman, M. Eastwood, S. Geier, M. Helmlinger, S.R. Lundeen, W. Olson-Duvall, R. Pavlick, L.M. Rios, D.R. Thompson, and A.K. Thorpe. 2023b. AVIRIS-NG L1B Orthocorrected Surface Radiance, Facility Instrument Collection. ORNL DAAC, Oak Ridge, Tennessee, USA. https://doi.org/10.3334/ORNLDAAC/2095
Green, R.O., S. Nolte, M. Helmlinger, and D.R. Thompson. 2023c. AVIRIS-NG L2 Orthocorrected Calibrated Reflectance, Facility Instrument Collection. ORNL DAAC, Oak Ridge, Tennessee, USA. https://doi.org/10.3334/ORNLDAAC/2110
Green, R.O., and D.R. Thompson. 2023. AVIRIS Facility Instruments: Flight Line Geospatial Polygons and Contextual Data, V1. ORNL DAAC, Oak Ridge, Tennessee, USA. https://doi.org/10.3334/ORNLDAAC/2140
Thompson, D.R., B.C. Gao, R.O. Green, P.E. Dennison, D.A. Roberts, and S. Lundeen. 2015a. Atmospheric correction for global mapping spectroscopy: ATREM advances for the HyspIRI preparatory campaign. Remote Sensing of Environment 167:64-77. https://doi.org/10.1016/j.rse.2015.02.010
Thompson, D.R., F.C. Seidel, B.C. Gao, M. Gierach, R.O. Green, R.M. Kudela, and P. Mouroulis. 2015b. Optimizing irradiance estimates for coastal and inland water imaging spectroscopy. Geophysical Research Letters 42:4116-4123. https://doi.org/10.1002/2015GL063287
Thompson, D.R., F.C. Seidel, B.C. Gao, M. Gierach, R.O. Green, R.M. Kudela, and P. Mouroulis. 2015b. Optimizing irradiance estimates for coastal and inland water imaging spectroscopy. Geophysical Research Letters 42:4116-4123. https://doi.org/10.1002/2015GL063287