Documentation Revision Date: 2023-04-14
Dataset Version: 1
Summary
NASA facility instruments operate out of a NASA research center and support multiple science disciplines, field investigations, and NASA science objectives. Facility instruments are supported by managers in the Earth Science Division (ESD) Research and Analysis Program, and/or the Earth Observation System (EOS) Project Science Office. The AVIRIS-Classic system resides at the JPL. The AVIRIS project operates under the Observational Systems Division of the Jet Propulsion Laboratory. In addition to operating and maintaining the sensor, the AVIRIS project works to ensure that experiment requirements are met for each flight and that users are satisfied with data quality and the level of service provided.
This dataset will include all L1B files from the AVIRIS-Classic facility instrument. See Tables 1-2 below for descriptions of data products.
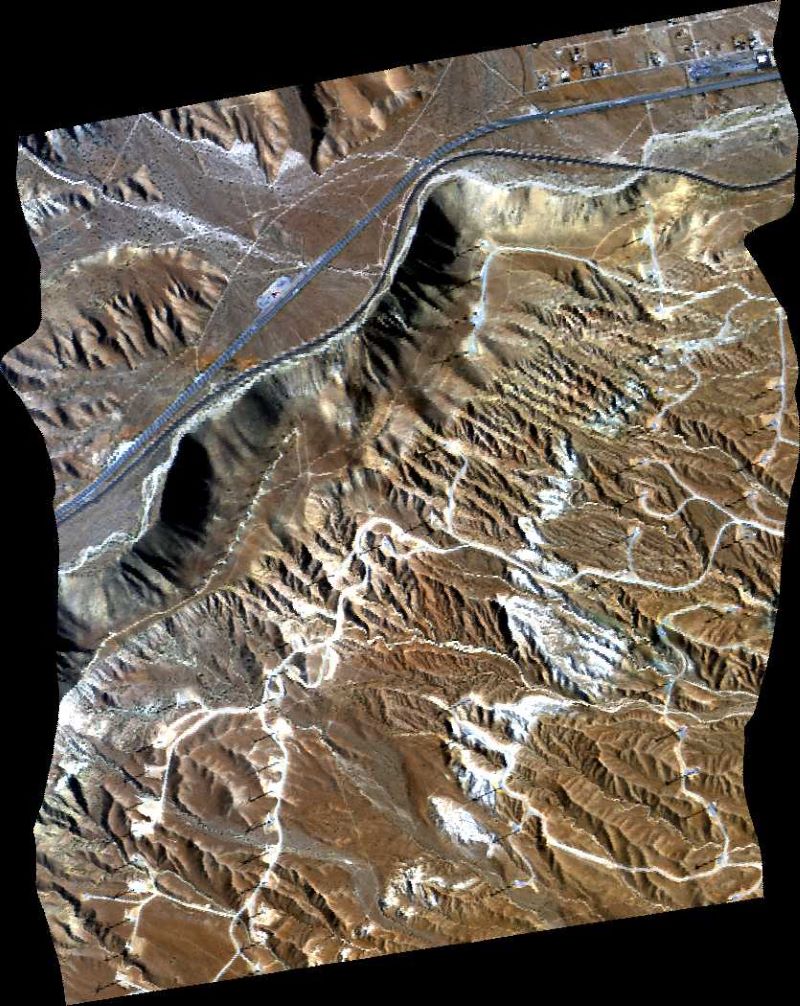
Figure 1. RGB composite image from AVIRIS-Classic flightline f170628t01p00r04 acquired on June 28 2017 northwest of Mojave, California. Source: f170628t01p00r04_sc01_RGB.jpeg
Citation
Green, R.O., D.R. Thompson, J.W. Boardman, J.W. Chapman, M. Eastwood, M. Helmlinger, S.R. Lundeen, and W. Olson-Duvall. 2023. AVIRIS-Classic: L1B Calibrated Radiance, Facility Instrument Collection, V1. ORNL DAAC, Oak Ridge, Tennessee, USA. https://doi.org/10.3334/ORNLDAAC/2155
Table of Contents
- Dataset Overview
- Data Characteristics
- Application and Derivation
- Quality Assessment
- Data Acquisition, Materials, and Methods
- Data Access
- References
Dataset Overview
This dataset contains Level 1B (L1B) orthocorrected, scaled radiance image files as well as files of observational geometry and illumination parameters and supporting sensor band information from the Airborne Visible / Infrared Imaging Spectrometer (AVIRIS-Classic) instrument. This is the NASA Earth Observing System Data and Information System (EOSDIS) facility instrument archive of these data. The NASA AVIRIS-Classic is a pushbroom spectral mapping system with high signal-to-noise ratio (SNR), designed and toleranced for high performance spectroscopy. AVIRIS-Classic measures reflected radiance in 224 contiguous bands at approximately 10-nm intervals in the Visible to Shortwave Infrared (VSWIR) spectral range from 400-2500 nm. The AVIRIS-Classic sensor has a 1 milliradian instantaneous field of view, providing altitude dependent ground sampling distances from 20 m to sub meter range. AVIRIS-Classic is flown on a variety of aircraft platforms including the Twin Otter, NASA’s WB-57, and NASA's high altitude ER-2. Multiple file types are included for each flight line. The primary data files include: orthocorrected calibrated radiance image (img) files, geometric lookup table (glt) and orthocorrected observation geometry and illumination (obs_ort) files. Also included are unprojected files of input geometry (igm), and parameters relating to the geometry of observation and illumination (obs). Additional files provide information on spectral (spc) and radiometric calibration (rcc, gain), spatial resolution (geo), aircraft and sensor position (eph, nav), deployment notes (info), and data processing (plog). Quicklook images (jpeg) and polygon outlines of imagery footprints (kmz) are provided for each flight line. The primary AVIRIS-Classic L1B data are provided in ENVI binary format, which includes a flat binary file accompanied by a header (.hdr) file holding metadata in text format. The ancillary files include JPEG images, maps in Keyhole Markup Language (KML), and calibration files in binary and text formats (Table 1).This archive currently includes data from 2006 - 2021. Additional L1B data will be added as they become available. AVIRIS-Classic supports NASA Science and applications in many areas including plant composition and function, geology and soils, greenhouse gas mapping, and calibration of orbital platforms.
NASA facility instruments operate out of a NASA research center and support multiple science disciplines, field investigations, and NASA science objectives. Facility instruments are supported by managers in the Earth Science Division (ESD) Research and Analysis Program, and/or the Earth Observation System (EOS) Project Science Office. The AVIRIS-Classic system resides at the JPL. The AVIRIS project operates under the Observational Systems Division of the Jet Propulsion Laboratory. In addition to operating and maintaining the sensor, the AVIRIS project works to ensure that experiment requirements are met for each flight and that users are satisfied with data quality and the level of service provided.
This dataset will include all L1B files from the AVIRIS-Classic facility instrument. See Tables below for descriptions of data products and the number of files per year.
Project: AVIRIS
The Airborne Visible InfraRed Imaging Spectrometer - Classic (AVIRIS-C) and Next Generation (AVIRIS-NG) are two Facility Instruments (FIs) that are part of NASA’s Airborne Science Program (ASP) and the Jet Propulsion Laboratory’s (JPL) Earth Science Airborne Program. The AVIRIS-C is an imaging spectrometer that delivers calibrated images of the upwelling spectral radiance in 224 contiguous spectral channels with wavelengths from 400 to 2500 nanometers (nm). The AVIRIS-NG is the successor to AVIRIS-Classic and provides high signal-to-noise ratio imaging spectroscopy measurements in 425 contiguous spectral channels with wavelengths in the solar reflected spectral range (380-2510 nm). The AVIRIS-NG started operation in 2014 and is expected to replace the AVIRIS-C instrument. Data from AVIRIS-C and AVIRIS-NG have been applied to a wide range of studies in the fields of terrestrial and coastal aquatic plant physiology, atmospheric and aerosol studies, environmental science, snow hydrology, geology, volcanology, oceanography, soil and land management, agriculture, and limnology.
Related Publications
Green, R.O., M.L. Eastwood, C.M. Sarture, T. G. Chrien, M. Aronsson, B.J. Chippendale, J.A. Faust, B.E. Pavri, C. J. Chovit, M. Solis, M.R. Olah, and O. Williams. 1998. Imaging Spectroscopy and the Airborne Visible/Infrared Imaging Spectrometer (AVIRIS). Remote Sensing of Environment 65:227- 248. https://doi.org/10.1016/S0034-4257(98)00064-9
Related Datasets
Green, R.O., D.R. Thompson, J.W. Boardman, J.W. Chapman, M. Eastwood, M. Helmlinger, S.R. Lundeen, and W. Olson-Duvall. 2023. AVIRIS-Classic: L2 Surface Reflectance, Facility Instrument Collection, V1. ORNL DAAC, Oak Ridge, Tennessee, USA. https://doi.org/10.3334/ORNLDAAC/2154
- Level 2 reflectance data were derived from the L1 data in this dataset.
Green, R.O., P.G. Brodrick, J.W. Chapman, M. Eastwood, S. Geier, M. Helmlinger, S.R. Lundeen, W. Olson-Duvall, R. Pavlick, L.M. Rios, D.R. Thompson, and A.K. Thorpe. 2023. AVIRIS-NG L1B Orthocorrected Surface Radiance, Facility Instrument Collection. ORNL DAAC, Oak Ridge, Tennessee, USA. https://doi.org/10.3334/ORNLDAAC/2095
Green, R.O., S. Nolte, M. Helmlinger, and D.R. Thompson. 2023. AVIRIS-NG L2 Orthocorrected Calibrated Reflectance, Facility Instrument Collection. ORNL DAAC, Oak Ridge, Tennessee, USA. https://doi.org/10.3334/ORNLDAAC/2110
- These datasets provide L1B and L2 data for the related AVIRIS-NG instrument
Green, R.O., P.G. Brodrick, J.W. Chapman, M. Eastwood, S. Geier, M. Helmlinger, S.R. Lundeen, W. Olson-Duvall, R. Pavlick, L.M. Rios, D.R. Thompson, and A.K. Thorpe. 2023. AVIRIS Facility Instruments: Flight Line Geospatial Polygons and Contextual Data, V1. ORNL DAAC, Oak Ridge, Tennessee, USA. https://doi.org/10.3334/ORNLDAAC/2140
- Flight line ancillary information in tabular and attributed polygon vector files
Data Characteristics
Spatiotemporal Characteristics
| Year | Number of Flights | Spatial Coverage | Temporal Coverage |
|---|---|---|---|
| 2006 | 128 | United States (California; Colorado; Idaho; Illinois; Louisiana; Maryland; Minnesota; Montana; Nebraska; Nevada; Pennsylvania; West Virginia; Wisconsin; Wyoming) | 2006-04-11 to 2006-11-28 |
| 2007 | 281 | United States (California; Colorado) | 2007-01-17 to 2007-12-13 |
| 2008 | 222 | United States (Arizona; California; Idaho; Maryland; Michigan; Minnesota; Montana; Nebraska; Nevada; New Mexico; New York; Ohio; Pennsylvania; Washington; West Virginia; Wisconsin); Canada | 2008-01-05 to 2008-10-29 |
| 2009 | 150 | United States (California; Connecticut; District of Columbia; Maine; Maryland; Massachusetts; Michigan; Minnesota; Nevada; New Hampshire; New York; Ohio; Pennsylvania; Tennessee; Vermont; Virginia; West Virginia; Wisconsin); Canada | 2009-02-27 to 2009-10-21 |
| 2010 | 565 | United States (Alabama; California; Colorado; Florida; Idaho; Illinois; Iowa; Louisiana; Michigan; Mississippi; Nevada; South Dakota; Texas; Utah; Wisconsin) | 2010-04-26 to 2010-11-02 |
| 2011 | 666 | United States (Arizona; California; Colorado; Illinois; Kentucky; Louisiana; Michigan; Minnesota; Mississippi; Missouri; Nevada; New Mexico; Tennessee; Utah; Wisconsin); Mexico; Canada | 2011-04-30 to 2011-11-16 |
| 2012 | 118 | United States (California; Colorado; Louisiana; Minnesota; Nevada; Utah | 2012-05-07 to 2012-12-03 |
| 2013 | 442 | United States (Arizona; California; Michigan; Nevada); Mexico | 2013-02-27 to 2013-12-05 |
| 2014 | 280 | United States (California; Nevada); Mexico | 2014-03-31 to 2014-11-24 |
| 2015 | 346 | United States (California; Nevada) | 2015-01-20 to 2015-10-30 |
| 2016 | 148 | United States (California; Nevada) | 2016-01-12 to 2016-12-19 |
| 2017 | 492 | United States (Alabama; Arizona; Arkansas; California; Colorado; Florida; Georgia; Kansas; Kentucky; Louisiana; Mississippi; Missouri; Nebraska; Nevada; New York; North Carolina; Ohio; Oklahoma; Pennsylvania; South Carolina; Tennessee; Texas; Virginia; West Virginia); Mexico | 2017-01-17 to 2017-12-21 |
| 2018 | 328 | United States (Arizona; California; Nevada; Oregon); Mexico | 2018-01-11 to 2018-09-18 |
| 2019 | 130 | United States (Arizona; California; Idaho; Montana; Nevada; Oregon; Utah; Washington); Mexico | 2019-08-02 to 2019-10-01 |
| 2020 | 95 | United States (California; Nevada); Mexico | 2020-09-17 to 2020-10-15 |
| 2021 | 81 | United States (Arizona; California; Nevada); Mexico | 2021-02-09 to 2021-04-02 |
Temporal Resolution: One-time estimate
Study Area: All latitudes and longitudes given in decimal degrees.
| Westernmost Longitude | Easternmost Longitude | Northernmost Latitude | Southernmost Latitude |
|---|---|---|---|
| -171.843 | -68.343 | 56.174 | -0.0329 |
Data File Information
This dataset includes multiband ENVI binary files (.bin) with associated header (.hdr) files, images in JPEG format (.jpeg), files in compressed Keyhole Markup Language (.kmz), and an array of ancillary files in binary (bin) and text (txt) formats. See Tables 1-2 for descriptions of file types.
The primary data files are in the ENVI format. The naming convention for the ENVI files is
<flight prefix><type><ver>_<scene>_<product><ext>, where
- <flight prefix> = flight line identifier, f<YYMMDD>t01p00r<aa>, encoding the date and time by year (YY), month (MM), day (DD), and the airborne flight run number (aa) (e.g., f060426t01p00r03).
- <type> = “rdn” indicates radiance for img products
- <ver> = radiance software version marker (e.g., “c”).
- <scene> = optional element used when the flight line is divided into multiple scenes (e.g., “sc01”, “sc02”)
- <product> = Level 1B data product as described in Table 1.
- <ext> = file extension of ".bin" denotes ENVI data in binary format and “.hdr” is an ENVI header file in ASCII text format.
The header (.hdr) for each ENVI holds metadata for the binary data file, including:
- number of samples (columns), lines (rows), and bands
- band information: wavelengths, fwhm, reflectance correction factors
- data type (3 = Signed Int32, 4 = Float32, 5=Float64), interleave type, and byte order
- map info: projection and datum, coordinates for x y reference points, pixel size, and map units
See https://www.l3harrisgeospatial.com/docs/enviheaderfiles.html for the header format.
The orthocorrected ENVI files are in a rotated UTM projection that follows the trajectory of the respective flight path.
The dataset also holds ancillary files for each flight line, which include quicklook images (jpeg) and geographic footprints of imagery (kmz), as well as information on spectral (spc) and radiometric calibration (rcc, gain), spatial resolution (geo), aircraft and sensor position (eph, nav), deployment notes (info), and data processing (plog) (Table 1).
The naming convention for these ancillary files is <flight prefix><ver>_<product>.<ext>, where
- <flight prefix> = flight line identifier.
- <product> = ancillary data product as described in Table 2.
- <ext> = "jpeg" indicates a JPEG image, "kmz" indicates a file in compressed Keyhole Markup Language, ".bin" denotes binary format, and “.txt” indicates an ASCII text file.
Example file names for one flight line are:
f060426t01p00r03c_eph.bin
f060426t01p00r03c.gain.txt
f060426t01p00r03c.geo.txt
f060426t01p00r03c_lonlat_eph.bin
f060426t01p00r03c.nav.txt
f060426t01p00r03c_obs.bin
f060426t01p00r03c_obs.hdr
f060426t01p00r03c_obs_ort.bin
f060426t01p00r03c_obs_ort.hdr
f060426t01p00r03c_ort_glt.bin
f060426t01p00r03c_ort_glt.hdr
f060426t01p00r03c_ort_igm.bin
f060426t01p00r03c_ort_igm.hdr
f060426t01p00r03c_ort.plog.txt
f060426t01p00r03c.rcc.txt
f060426t01p00r03c.spc.txt
f060426t01p00r03.info.txt
f060426t01p00r03rdn_c_sc01_ort_img.bin
f060426t01p00r03rdn_c_sc01_ort_img.hdr
f060426t01p00r03rdn_c_sc02_ort_img.bin
f060426t01p00r03rdn_c_sc02_ort_img.hdr
f060426t01p00r03_sc01_outline_KML.kmz
f060426t01p00r03_sc01_overlay_KML.kmz
f060426t01p00r03_geo.jpeg
f060426t01p00r03_sc01_RGB.jpeg
Table 1. Level 1B primary data products.
| Product abbreviation | Description | Bands | Format |
|---|---|---|---|
| glt, ort_glt | Geometric look-up table. Orthocorrected product with a fixed pixel size projected into a rotated UTM system that contains the information about which original pixel occupies which output pixel in the final product. Additionally, each pixel is sign-coded to indicate if it is real (indicated by a positive value) or a nearest-neighbor infill (indicated by negative values). | 2 bands: sample number, original line number. | 16 bit integer, band interleaved by line |
| igm, ort_igm | Input geometry file. Pixel location data for each radiance image cube. No map correction or resampling is applied; the IGM file reports the surface location of the unadjusted pixel centers in (a) geographic coordinates as decimal degrees using the WGS-84 datum. Data includes the estimated ground elevation at pixel center in m. | 3 bands: longitude, latitude, elevation (m). | 64-bit double precision, band interleaved by line |
| img, ort_img | Orthocorrected calibrated radiances. The header records the spectral calibration (wavelength and full-width at half-maximum value) for every channel in the radiance data. | 244 bands: radiance (uW nm-1 cm-2 sr-1) at wavelengths of 380 nm to 2500 nm in approximately 10-nm intervals. | 32-bit floating point, band interleaved by pixel |
| obs | Observation parameter file for unorthocorrected radiance image. Parameters relate the geometry of observation and illumination for each pixel. | 10 bands: Path length (m), To-sensor azimuth (0 to 360 degrees clockwise from N), To-sensor zenith (0 to 90 degrees from zenith) , To-sun azimuth (0 to 360 degrees clockwise from N), To-sun zenith (0 to 90 degrees from zenith) , Phase (degrees between to-sensor and to-sun vectors in principal plane), Slope (in degrees from DEM), Aspect (from DEM in degrees cw from N), Cosine-i (apparent illumination factor based on DEM slope and aspect, and to-sun vector; -1 to 1), UTC Time. | 64-bit double precision, band interleaved by pixel |
| obs_ort | Orthocorrected observation parameter file that relates to the each pixel’s geometry of observation and illumination. |
Table 2. Ancillary files associated with AVIRIS-Classic flight lines.
|
Product abbreviation |
Description |
Bands | Format |
|---|---|---|---|
| eph | Sensor position in x,y,z (UTM,WGS-84/NAD83 datum) coordinate system. Coordinate is for midpoint of each scan line | 6 values per scan line: UTM easting (x), UTM northing (y), and altitude (z, meters); aircraft roll, pitch, and heading | 64-bit double precision |
| lonlat_eph | Sensor position in WGS-84 longitude, latitude, and elevation, Coordinate is for midpoint of each scan line | 6 values per scan line: longitude, latitude, and elevation (meters); aircraft roll, pitch, and heading; | 64-bit double precision |
| gain | Multiplication factors to store radiance. When each spectrum is divided by the factors in this file the 16-bit integers are converted to radiance in units of microwatts cm-2 nm-1 sr-1. | 2 columns: multiplication factor, channel number | ASCII text |
| geo | Spatial resolution on the ground for the flight line. Units in mrad except for channel number. | 5 columns: spatial sampling interval, spatial response function (FWHM), spatial sampling interval uncertainty, spatial response function uncertainty, channel number | ASCII text |
| info | Generic information for flight, such site name, takeoff and landing times, takeoff site, investigator, and aircraft platform. | Deployment information and notes provided by crew. | ASCII text |
| nav | Aircraft position data from on-board instruments. | Raw output from navigation instruments. | ASCII text |
| plog | Generic data processing information. | Number of samples and line processed with other optional information. | ASCII text |
| rcc, rccf11 | AVIRIS Radiometric calibration coefficients and laboratory calibration uncertainty. Units: (microwatts cm-2 nm-1 sr-1) per digitized number. | 3 columns: radiometric calibration coefficient, uncertainty in radiometric calibration coeff., channel number | ASCII text |
| spc | AVIRIS spectral calibration. | 5 columns: wavelength center position, full width at half maximum for equivalent gaussian, uncertainty in wavelength center position, uncertainty in FWHM for equivalent gaussian, channel number | ASCII text |
|
RGB.jpeg |
RGB image for flight line derived from reflectance |
- | JPEG |
|
geo.jpeg |
Quicklook image for flight line with typically lower resoluton than RGB image |
- | JPEG |
|
outline_KML.kmz |
Polygon outline of flight line imagery footprint |
- | KMZ |
|
overlay_KML.kmz |
RGB image overlaid on polygon outline of flight line imagery footprint |
- | KMZ |
Application and Derivation
The main objective of the AVIRIS project is to identify, measure, and monitor constituents of the Earth's surface and atmosphere based on molecular absorption and particle scattering signatures. Research with AVIRIS data is predominantly focused on understanding processes related to the global environment and climate change.
The NASA Airborne Visible/Infrared Imaging Spectrometer (AVIRIS-Classic) has been in operation since 1987 acquiring contiguous spectral measurements between 380 and 2510 nm for use by a range of terrestrial ecology science investigations related to: (1) pattern and spatial distribution of ecosystems and their components, (2) ecosystem function, physiology and seasonal activity, (3) biogeochemical cycles, (3) changes in disturbance activity, and (4) ecosystems and human health. This instrument has been useful in developing techniques for atmospheric corrections needed to estimate surface reflectance using hyperspectral data (Thompson et al., 2015a; Thompson et al., 2016). For example, AVIRIS-Classic has been calibrated and deployed with a new high-rate data-capture system and a new real-time cloud-screening algorithm (Thompson et al., 2014).
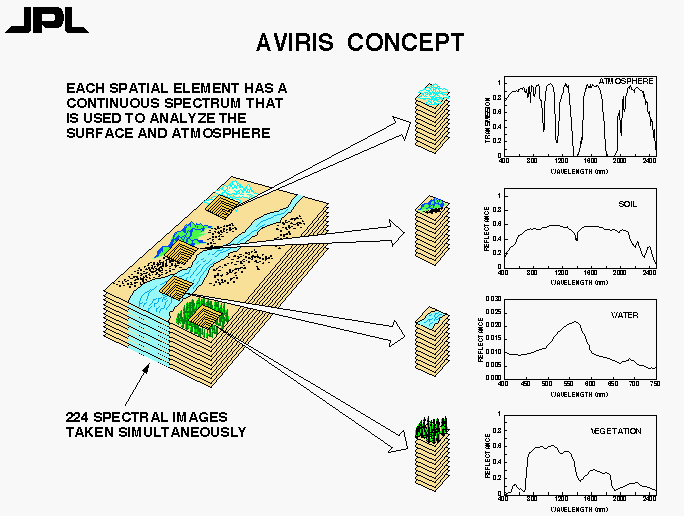
Figure 2. Overview of AVIRIS concept depicting how hyperspectral imagery provides information on characteristics of the atmosphere and earth’s surface. Source: https://aviris.jpl.nasa.gov/aviris/concept.html
Beginning in 2009, a new NASA Earth Science airborne sensor called the Next Generation Airborne Visible/Infrared Imaging Spectrometer (AVIRIS NG) was developed by JPL through the funding support from the American Recovery and Reinvestment Act (ARRA). Technical and programmatic oversight of the AVIRIS-NG development was provided by NASA’s Earth Science Technology Office (ESTO). AVIRIS-NG has been used to develop algorithms to accurately measure surface reflectances in coastal areas where the mixture of water and terrestrial surfaces, sun glint, atmospheric aerosols are challenging (Thompson et al., 2015b; Thompson et al. 2019).
Quality Assessment
AVIRIS radiometric calibration factors are calculated by measuring the response of AVIRIS to an integrating sphere (a known target illuminated by a known light source). This calibration is accurate to within 7%, absolute, over time. Intra-flight accuracy is within 2%. See Boardman (2014) for details regarding the orthocorrection process.
The AVIRIS calibration procedure addresses electronic effects involving radiometric responses of each detector, optical effects involving the spatial and spectral view of each detector, and radiometric calibration. Detector responsiveness is measured at the beginning of each deployment and mid-flight for particularly long deployments. Instrument artifacts in the spectrometer data, such as striping, are removed statistically by minimizing a Markov Random Field model. Likewise, bad pixels are identified and corrected using statistical methods followed by laboratory and field protocols to evaluate effectiveness.
Data Acquisition, Materials, and Methods
AVIRIS-Classic measures radiance in the nominal wavelength range from 400 nm to 2500 nm with approximately 10-nm sampling (Green et al., 1998). The actual range of wavelengths is approximately 365 to 2510 nm, and the ENVI header files for the radiance products (img) list the center wavelenght and FWHM for each band. Spectra are measured as images with 677 cross-track elements and spatial sampling from 4 m to 20 m. AVIRIS-Classic is compatible with a broad array of possible aircraft platforms, such as NASA’s ER-2 jet, the Twin Otter DHC-6 turboprop, and the WB-57.
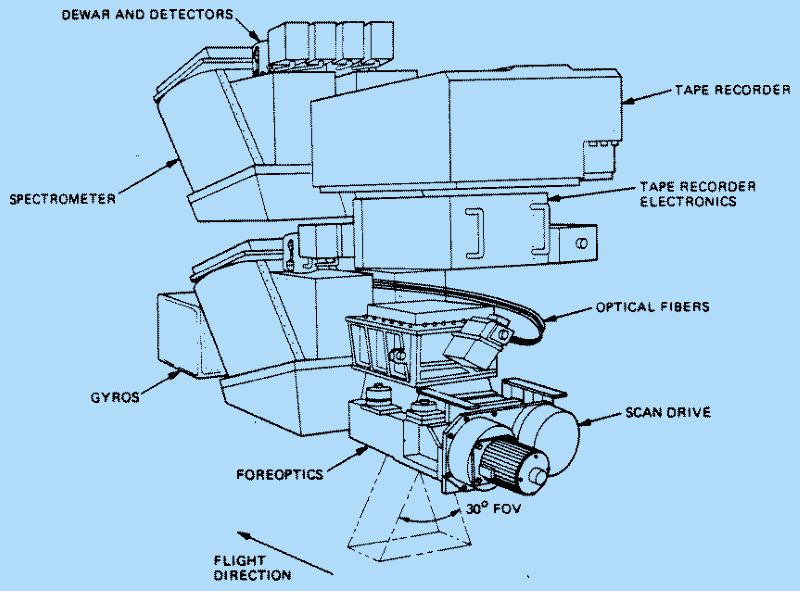
Figure 3. Major components of the AVIRIS-Classic airborne instrument package. Source: https://aviris.jpl.nasa.gov/aviris/instrument.html
Data Processing
AVIRIS processing is done on a per run basis. Normal processing begins with downloading the data stored in 16-bit integers, The image data is reversed (within each scan line), since the data coming off AVIRIS, if displayed directly, is actually reversed from how the data would look from the aircraft. Each line of data is expanded and reversed, with any bad data marked as such, and then written to SDS archive media. The AVIRIS archiving process also compiles information about the image, navigation, and engineering data and stores it in the SDS database. Quicklook images are created during the archive process.
L1B data products are orthocorrected and radiometrically corrected into units of radiance from the unitless digital numbers downloaded from the instrument. Each pixel in the imagery is individually ray traced using the best-estimate of sensor location and attitude until it intersects the digital elevation model. Radiance is measured in units of microwatts per square centimeter per nanometer per steradian (uW nm-1 cm-2 sr-1).
Table 3. Summary of specifications for AVIRIS-Classic. Source: https://aviris.jpl.nasa.gov/aviris/instrument.html
|
Parameter |
Value |
|
Wavelength |
380 nm to 2500 nm |
|
Spectral Resolution (FWHM, minimum) |
10 nm ± 0.5 nm |
|
Field of View |
34 ± 2 degrees with 677 resolved elements |
|
Instantaneous Field of View |
1.0 mrad ± 1.0 mrad |
|
Spatial Sampling (maximum observed at resolved elements) |
1.0 mrad ± 0.1 mrad |
|
Spectral Distortion (smile) |
Uniformity >97% |
|
Spectral Distortion (keystone) |
Unformity >97% |
|
FPA |
224 (spectral direction) x 677 (cross track) |
|
Frame Rate |
12 frames per second |
|
Pixel Size |
4 to 20 m, depend platform altitude |
|
Calibration |
On-board calibrator |
|
Data Resolution |
10 to 12 bits |
|
Data Rate |
Up to 17 to 20 Mbps |
|
Data Volume |
Up to 76 GB of raw data before disk swap |
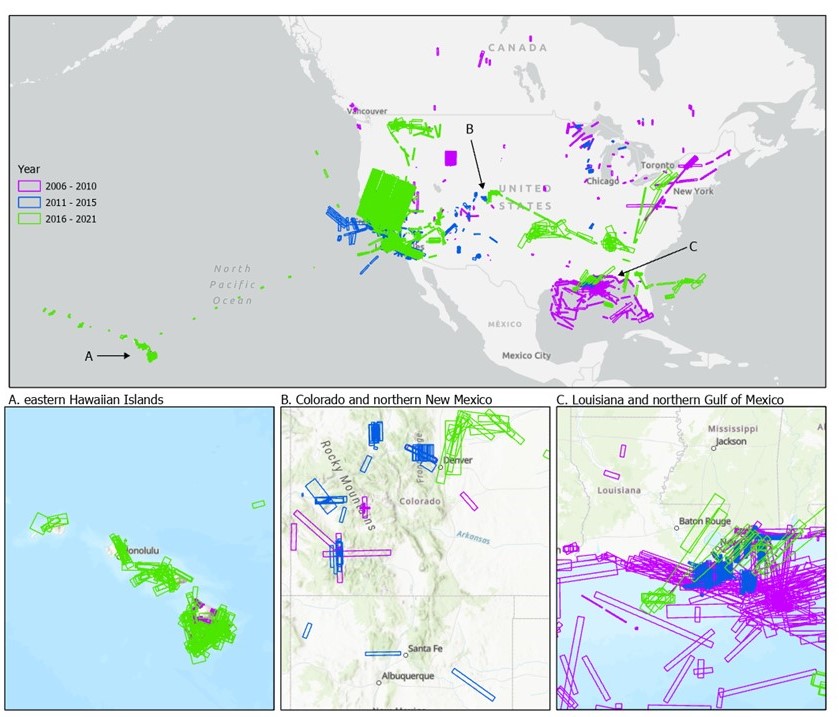
Figure 4. Distribution of AVIRIS-Classic flights from 2006 to 2021 over U.S., Canada, Hawaii, and eastern Pacific Ocean.. Insets show detailed distribution in (A) eastern Hawaiian Islands (B) Colorado and northern New Mexico, and (C) Louisiana and northern Gulf of Mexico. Imagery footprints are represented by rectangular polygons.
Data Access
These data are available through the Oak Ridge National Laboratory (ORNL) Distributed Active Archive Center (DAAC).
AVIRIS-Classic: L1B Calibrated Radiance, Facility Instrument Collection, V1
Contact for Data Center Access Information:
- E-mail: uso@daac.ornl.gov
- Telephone: +1 (865) 241-3952
References
Boardman, J. W. 2014. New AVIRIS orthocorrection processing and products. https://ghrc.nsstc.nasa.gov/pub/fieldCampaigns/goesrplt/AVIRIS/doc/AVIRIS_OrthoProcessing_Info.txt
Green, R.O., M.L. Eastwood, C.M. Sarture, T. G. Chrien, M. Aronsson, B.J. Chippendale, J.A. Faust, B.E. Pavri, C. J. Chovit, M. Solis, M.R. Olah, and O. Williams. 1998. Imaging Spectroscopy and the Airborne Visible/Infrared Imaging Spectrometer (AVIRIS). Remote Sensing of Environment 65:227- 248. https://doi.org/10.1016/S0034-4257(98)00064-9
Green, R.O., P.G. Brodrick, J.W. Chapman, M. Eastwood, S. Geier, M. Helmlinger, S.R. Lundeen, W. Olson-Duvall, R. Pavlick, L.M. Rios, D.R. Thompson, and A.K. Thorpe. 2023a. AVIRIS-NG L1B Orthocorrected Surface Radiance, Facility Instrument Collection. ORNL DAAC, Oak Ridge, Tennessee, USA. https://doi.org/10.3334/ORNLDAAC/2095
Green, R.O., S. Nolte, M. Helmlinger, and D.R. Thompson. 2023b. AVIRIS-NG L2 Orthocorrected Calibrated Reflectance, Facility Instrument Collection. ORNL DAAC, Oak Ridge, Tennessee, USA. https://doi.org/10.3334/ORNLDAAC/2110
Green, R.O., P.G. Brodrick, J.W. Chapman, M. Eastwood, S. Geier, M. Helmlinger, S.R. Lundeen, W. Olson-Duvall, R. Pavlick, L.M. Rios, D.R. Thompson, and A.K. Thorpe. 2023. AVIRIS Facility Instruments: Flight Line Geospatial Polygons and Contextual Data, V1. ORNL DAAC, Oak Ridge, Tennessee, USA. https://doi.org/10.3334/ORNLDAAC/2140
Green, R.O., D.R. Thompson, J.W. Boardman, J.W. Chapman, M. Eastwood, M. Helmlinger, S.R. Lundeen, and W. Olson-Duvall. 2023c. AVIRIS-Classic: L2 Calibrated Reflectance, Facility Instrument Collection. ORNL DAAC, Oak Ridge, Tennessee, USA. https://doi.org/10.3334/ORNLDAAC/2154
Thompson, D.R., K. Cawse-Nicholson, Z. Erickson, C.G. Fichot, C. Frankenberg, B.-C. Gao, M.M. Gierach, R.O. Green, D. Jensen, V. Natraj, and A. Thompson. 2019. A unified approach to estimate land and water reflectances with uncertainties for coastal imaging spectroscopy. Remote Sensing of Environment 231:111198. https://doi.org/10.1016/j.rse.2019.05.017
Thompson, D.R., B.C. Gao, R.O. Green, P.E. Dennison, D.A. Roberts, and S. Lundeen. 2015a. Atmospheric correction for global mapping spectroscopy: ATREM advances for the HyspIRI preparatory campaign. Remote Sensing of Environment 167:64-77. https://doi.org/10.1016/j.rse.2015.02.010
Thompson, D.R., R.O. Green, D. Keymeulen, S. Lundeen, Y. Mouradi, R. Castano, S.A. Chien. 2014. Rapid spectral cloud screening onboard aircraft and spacecraft. IEEE Transactions on Geoscience and Remote Sensing 52:6779-6792. https://doi.org/10.1109/TGRS.2014.2302587
Thompson, D.R., F.C. Seidel, B.C. Gao, M. Gierach, R.O. Green, R.M. Kudela, and P. Mouroulis. 2015b. Optimizing irradiance estimates for coastal and inland water imaging spectroscopy. Geophysical Research Letters 42:4116-4123. https://doi.org/10.1002/2015GL063287
Thompson, D. R., D.A. Roberts, B. C. Gao, R. O. Green, L. Guild, K. Hayashi, R. Kudela, and S. Palacios. 2016. Atmospheric correction with the Bayesian empirical line. Optics Express 24: 2134-2144. https://doi.org/10.1364/OE.24.002134