Documentation Revision Date: 2022-07-25
Dataset Version: 2.0
Summary
ATom deployed an extensive gas and aerosol payload on the NASA DC-8 aircraft for a systematic, global-scale sampling of the atmosphere, profiling continuously from 0.2–12 km altitude. Flights occurred in each of the four seasons from 2016 to 2018. Flights originate from the Armstrong Flight Research Center in Palmdale, California, fly north to the western Arctic, south to the South Pacific, east to the Atlantic, north to Greenland, and return to California across central North America. ATom established a single, contiguous, global-scale dataset. Profiles of the reactive gases will also provide critical information for the validation of satellite data, particularly in remote areas where in situ data is lacking. Complete aircraft flight information including, but not limited to, latitude, longitude, and altitude are also provided. This data release provides results from all instruments on all four ATom flight campaigns.
This is Version 2 of this dataset. All previously released data were updated to the latest available versions. For details, see Section 8. Dataset Revisions.
This dataset includes 28 data files in netCDF (*.nc) format. Files are organized by merge type (based on sampling interval) and airborne campaign (i.e., Atom-1, 2, 3, or 4).
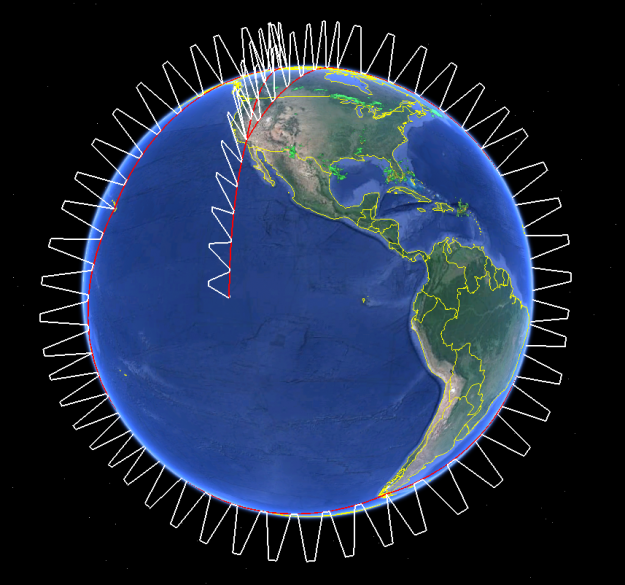
Figure 1. Generalized overview of ATom flights. During each of the four campaigns, ATom flights originated from California, flew south over the Pacific Ocean, then north to the western Arctic, southwest to New Zealand, east to Chile and the Atlantic Ocean, north to Greenland, and returned to California across North America. The aircraft continuously profiled the atmosphere from 0.2 to 12 km altitude.
Citation
Wofsy, S.C., S. Afshar, H.M. Allen, E.C. Apel, E.C. Asher, B. Barletta, J. Bent, H. Bian, B.C. Biggs, D.R. Blake, N. Blake, I. Bourgeois, C.A. Brock, W.H. Brune, J.W. Budney, T.P. Bui, A. Butler, P. Campuzano-Jost, C.S. Chang, M. Chin, R. Commane, G. Correa, J.D. Crounse, P. D. Cullis, B.C. Daube, D.A. Day, J.M. Dean-Day, J.E. Dibb, J.P. DiGangi, G.S. Diskin, M. Dollner, J.W. Elkins, F. Erdesz, A.M. Fiore, C.M. Flynn, K.D. Froyd, D.W. Gesler, S.R. Hall, T.F. Hanisco, R.A. Hannun, A.J. Hills, E.J. Hintsa, A. Hoffman, R.S. Hornbrook, L.G. Huey, S. Hughes, J.L. Jimenez, B.J. Johnson, J.M. Katich, R.F. Keeling, M.J. Kim, A. Kupc, L.R. Lait, K. McKain, R.J. Mclaughlin, S. Meinardi, D.O. Miller, S.A. Montzka, F.L. Moore, E.J. Morgan, D.M. Murphy, L.T. Murray, B.A. Nault, J.A. Neuman, P.A. Newman, J.M. Nicely, X. Pan, W. Paplawsky, J. Peischl, M.J. Prather, D.J. Price, E.A. Ray, J.M. Reeves, M. Richardson, A.W. Rollins, K.H. Rosenlof, T.B. Ryerson, E. Scheuer, G.P. Schill, J.C. Schroder, J.P. Schwarz, J.M. St.Clair, S.D. Steenrod, B.B. Stephens, S.A. Strode, C. Sweeney, D. Tanner, A.P. Teng, A.B. Thames, C.R. Thompson, K. Ullmann, P.R. Veres, N.L. Wagner, A. Watt, R. Weber, B.B. Weinzierl, P.O. Wennberg, C.J. Williamson, J.C. Wilson, G.M. Wolfe, C.T. Woods, L.H. Zeng, and N. Vieznor. 2021. ATom: Merged Atmospheric Chemistry, Trace Gases, and Aerosols, Version 2. ORNL DAAC, Oak Ridge, Tennessee, USA. https://doi.org/10.3334/ORNLDAAC/1925
Table of Contents
- Dataset Overview
- Data Characteristics
- Application and Derivation
- Quality Assessment
- Data Acquisition, Materials, and Methods
- Data Access
- References
- Dataset Revisions
Dataset Overview
This dataset provides information on greenhouse gases and human-produced air pollution, including atmospheric concentrations of carbon dioxide (CO2), methane (CH4), tropospheric ozone (O3), and black carbon (BC) aerosols, collected during airborne campaigns conducted by NASA's Atmospheric Tomography (ATom) mission. This dataset includes merged data from all instruments plus additional data such as numbered profiles and distance flown. Merged data products have been created for seven different aggregation intervals (1 second, 10 seconds, and 5 instrument-specific intervals). In the case of data obtained over longer time intervals (e.g., flask data), the merge files provide (weighted) averages to match the sampling intervals. This comprehensive dataset will be used to improve the representation of chemically reactive gases and short-lived climate forcers in global models of atmospheric chemistry and climate.
ATom deployed an extensive gas and aerosol payload on the NASA DC-8 aircraft for a systematic, global-scale sampling of the atmosphere, profiling continuously from 0.2–12 km altitude. Flights occurred in each of the four seasons from 2016 to 2018. Flights originate from the Armstrong Flight Research Center in Palmdale, California, fly north to the western Arctic, south to the South Pacific, east to the Atlantic, north to Greenland, and return to California across central North America. ATom established a single, contiguous, global-scale dataset. Profiles of the reactive gases will also provide critical information for the validation of satellite data, particularly in remote areas where in situ data is lacking. Complete aircraft flight information including, but not limited to, latitude, longitude, and altitude are also provided. This data release provides results from all instruments on all four ATom flight campaigns.
This is Version 2 of this dataset. All previously released data were updated to the latest available versions. For details, see Section 8. Dataset Revisions.
Project: Atmospheric Tomography Mission
The Atmospheric Tomography Mission (ATom) was a NASA Earth Venture Suborbital-2 mission. It studied the impact of human-produced air pollution on greenhouse gases and on chemically reactive gases in the atmosphere. ATom deployed an extensive gas and aerosol payload on the NASA DC-8 aircraft for systematic, global-scale sampling of the atmosphere, profiling continuously from 0.2 to 12 km altitude. Flights occurred in each of four seasons over a 4-year period.
Related Data
Wofsy, S.C., S. Afshar, H.M. Allen, E.C. Apel, E.C. Asher, B. Barletta, J. Bent, H. Bian, B.C. Biggs, D.R. Blake, N. Blake, I. Bourgeois, C.A. Brock, W.H. Brune, J.W. Budney, T.P. Bui, A. Butler, P. Campuzano-Jost, C.S. Chang, M. Chin, R. Commane, G. Correa, J.D. Crounse, P. D. Cullis, B.C. Daube, D.A. Day, J.M. Dean-Day, J.E. Dibb, J.P. DiGangi, G.S. Diskin, M. Dollner, J.W. Elkins, F. Erdesz, A.M. Fiore, C.M. Flynn, K.D. Froyd, D.W. Gesler, S.R. Hall, T.F. Hanisco, R.A. Hannun, A.J. Hills, E.J. Hintsa, A. Hoffman, R.S. Hornbrook, L.G. Huey, S. Hughes, J.L. Jimenez, B.J. Johnson, J.M. Katich, R.F. Keeling, M.J. Kim, A. Kupc, L.R. Lait, J.-F. Lamarque, J. Liu, K. McKain, R.J. Mclaughlin, S. Meinardi, D.O. Miller, S.A. Montzka, F.L. Moore, E.J. Morgan, D.M. Murphy, L.T. Murray, B.A. Nault, J.A. Neuman, P.A. Newman, J.M. Nicely, X. Pan, W. Paplawsky, J. Peischl, M.J. Prather, D.J. Price, E.A. Ray, J.M. Reeves, M. Richardson, A.W. Rollins, K.H. Rosenlof, T.B. Ryerson, E. Scheuer, G.P. Schill, J.C. Schroder, J.P. Schwarz, J.M. St.Clair, S.D. Steenrod, B.B. Stephens, S.A. Strode, C. Sweeney, D. Tanner, A.P. Teng, A.B. Thames, C.R. Thompson, K. Ullmann, P.R. Veres, N. Vieznor, N.L. Wagner, A. Watt, R. Weber, B. Weinzierl, P.O. Wennberg, C.J. Williamson, J.C. Wilson, G.M. Wolfe, C.T. Woods, and L.H. Zeng. 2018. ATom: Merged Atmospheric Chemistry, Trace Gases, and Aerosols. ORNL DAAC, Oak Ridge, Tennessee, USA. https://doi.org/10.3334/ORNLDAAC/1581
- Version 1.5 of the current dataset. Now superseded and available only upon request.
Wofsy, S.C., and ATom Science Team. 2018. ATom: Aircraft Flight Track and Navigational Data. ORNL DAAC, Oak Ridge, Tennessee, USA. https://doi.org/10.3334/ORNLDAAC/1613
- Flightpath (location and altitude) data for each of the four campaigns provided in KML and CSV format
HIAPER Pole-to-Pole Observations (HIPPO) of Carbon Cycle and Greenhouse Gases Study (2009-2011). Data available at https://www.eol.ucar.edu/field_projects/hippo
- HIPPO project homepage. HIPPO measured cross sections of atmospheric concentrations approximately pole-to-pole, from the surface to the tropopause, five times during different seasons over a three-year period. A comprehensive suite of atmospheric trace gases pertinent to understanding the Carbon Cycle was measured.
Acknowledgments
Table 1. The ATom team would like to thank the following individuals for their contributions to the success of the ATom Mission.
| Contributor | Affiliation |
|---|---|
| Science Team | |
| G. Dutton | NOAA Earth System Research Laboratory and University of Colorado CIRES |
| B.D. Hall | NOAA Earth System Research Laboratory |
| A. McClure-Begley | NOAA Earth System Research Laboratory and University of Colorado CIRES |
| J.D. Nance | NOAA Earth System Research Laboratory and University of Colorado CIRES |
| D. Sueper | University of Colorado CIRES and Department of Chemistry |
| D.S. Thomson | University of Colorado CIRES, Department of Chemistry, and Original Code Consulting, Boulder, CO |
| NASA Headquarters and Earth Systems Science Pathfinder Office | |
| B. Lefer | NASA Headquarters - Tropospheric Composition Program |
| J. Olson | NASA Langley Research Center - Earth Systems Science Pathfinder Program Office |
| NASA Earth Science Project Office | |
| Q. Allison | NASA Ames Research Center and BAERI |
| S. Beddingfield | NASA Ames Research Center and BAERI |
| B. Bulger | NASA Ames Research Center and BAERI |
| D. Chirica | NASA Ames Research Center and BAERI |
| E. Czech | NASA Ames Research Center |
| K. Drdla | NASA Ames Research Center |
| D. Jordan | NASA Ames Research Center |
| E. Justice | NASA Ames Research Center and BAERI |
| E. Juvera | NASA Ames Research Center and BAERI |
| B. Luna | NASA Ames Research Center |
| S. McFadden | NASA Ames Research Center and BAERI |
| A. Padhi | NASA Ames Research Center and BAERI |
| V. Salazar | NASA Ames Research Center |
| R. Strong | NASA Ames Research Center |
| A. Thompson | NASA Ames Research Center and BAERI |
| M. Vasques | NASA Ames Research Center |
| B. Williams | NASA Ames Research Center and BAERI |
| J. Zavaleta | NASA Ames Research Center |
| NASA DC-8 Team | |
| C. Bartholomew | NASA Armstrong Flight Research Center and i3 |
| F. Batteas | NASA Armstrong Flight Research Center |
| M. Berry | NASA Armstrong Flight Research Center |
| M. Bereda | NASA Armstrong Flight Research Center |
| J. Borton | NASA Armstrong Flight Research Center |
| T. Dilworth | NASA Armstrong Flight Research Center |
| B. Elit | NASA Armstrong Flight Research Center and i3 |
| M. Espinoza | NASA Armstrong Flight Research Center |
| D. Fedors | NASA Armstrong Flight Research Center |
| R. Garcia | NASA Armstrong Flight Research Center |
| T. Grindle | NASA Armstrong Flight Research Center |
| S. Johnson | NASA Armstrong Flight Research Center and L-3 |
| W. Klein | NASA Armstrong Flight Research Center |
| S. Koertge | NASA Armstrong Flight Research Center and i3 |
| D. Larson | NASA Armstrong Flight Research Center |
| L. Lohberger | NASA Armstrong Flight Research Center |
| T. Moes | NASA Armstrong Flight Research Center |
| M. Moore | NASA Armstrong Flight Research Center and L-3 |
| M. Pitsch | NASA Armstrong Flight Research Center and i3 |
| J. Proffitt | NASA Armstrong Flight Research Center and i3 |
| R. Renfro | NASA Armstrong Flight Research Center and i3 |
| W. Ringelberg | NASA Armstrong Flight Research Center |
| C. Rung | NASA Armstrong Flight Research Center |
| L. Sanchez | NASA Armstrong Flight Research Center |
| T. Sandon | NASA Armstrong Flight Research Center and i3 |
| M. Scherer | NASA Armstrong Flight Research Center and L-3 |
| S. Silver | NASA Armstrong Flight Research Center |
| E. Stith | NASA Armstrong Flight Research Center and BAERI |
| D. Van Gilst | NASA Armstrong Flight Research Center and BAERI |
| A. Webster | NASA Armstrong Flight Research Center and BAERI |
| B. Wehr | NASA Armstrong Flight Research Center |
| R. Williams | NASA Armstrong Flight Research Center |
| J. Wilson | NASA Armstrong Flight Research Center and Jacobs Technology, Inc. |
Data Characteristics
Spatial Coverage: Global. Flights circumnavigate the globe, primarily over the oceans
Spatial Resolution: Point measurements
Temporal Coverage: Periodic flights occurred during each campaign
| Deployment | Date Range |
|---|---|
| ATom-1 | July 29 - August 23, 2016 |
| ATom-2 | January 26 - February 21, 2017 |
| ATom-3 | September 28 - October 28, 2017 |
| ATom-4 | April 24 - May 21, 2018 |
Temporal Resolution: Native resolution ranges from <1–2 seconds, depending on instrument and flight. Merge files present the data from different instruments averaged to various time bases, including 10-seconds and 1-second.
Data File Information
This dataset includes 28 data files in netCDF (*.nc) format. Files are organized by merge type (based on aggregation interval; Table 3) and flight campaign (ATom-1, 2, 3, or 4). The netCDF files are structured as GeoTrajectory, where the observations for a flight segment are connected along a one-dimensional track in space, with time increasing monotonically along the track.
The files are named according to their merge type and flight date as MER-TYPE_DC8_ATom-N.nc, where
- MER-TYPE = merge type (Table 3)
- ATom-N = flight campaign, either ATom-1, 2, 3, or 4
Table 3. Merge Types. Instrument acronyms are listed in Table 5.
| Merge Type | Averaging Interval | Description |
|---|---|---|
| MER-1HZ | 1 second | Merge of measurement data at 1-second intervals across all instruments |
| MER-MED | 25 seconds | Data merged to MEDUSA sampling interval |
| MER-PFP | Between 5–40 minutes | Data merged to PFP sampling interval |
| MER-SAGA-AERO | Between 8–25 minutes | Data merged to SAGA-AERO sampling interval |
| MER-TOGA | 120 seconds | Data merged to TOGA sampling interval, from 1-second merge file |
| MER-WAS | Between 120–200 seconds | Data merged to WAS sampling interval |
| MER10 | 10 seconds | Merge of measurement data at 10-second intervals across all instruments |
Data File Details
There are over 450 individual variables measured by the 25 instruments onboard the NASA DC-8. A list of all data variables is provided in the companion file ALLNAMES.txt and in the header information of the netCDF files.
Table 4. Companion files that are included in this dataset.
| File Name | Description |
|---|---|
| ALLNAMES.txt | A list of all data variables included in the merge files |
| ATom_merge.pdf | A PDF copy of this user guide |
| ATom_merging_Rcode_20210804.pdf | R code used to create ATom merge ICARTT files The ORNL DAAC subsequently converted the ICARTT files to the provided netCDF format. |
Application and Derivation
ATom builds the scientific foundation for mitigation of short-lived climate forcers, in particular, methane (CH4), tropospheric ozone (O3), and Black Carbon aerosols (BC).
ATom Science Questions
Tier 1
- What are chemical processes that control the short-lived climate forcing agents CH4, O3, and BC in the atmosphere? How is the chemical reactivity of the atmosphere on a global scale affected by anthropogenic emissions? How can we improve chemistry-climate modeling of these processes?
Tier 2
- Over large, remote regions, what are the distributions of BC and other aerosols important as short-lived climate forcers? What are the sources of new particles? How rapidly do aerosols grow to CCN-active sizes? How well are these processes represented in models?
- What type of variability and spatial gradients occurs over remote ocean regions for greenhouse gases (GHGs) and ozone-depleting substances (ODSs)? How do the variations among air parcels help identify anthropogenic influences on photochemical reactivity, validate satellite data for these gases, and refine knowledge of sources and sinks?
Significance
ATom delivers unique data and analysis to address the Science Mission Directorate objectives of acquiring “datasets that identify and characterize important phenomena in the changing Earth system” and “measurements that address weaknesses in current Earth system models leading to improvement in modeling capabilities.” ATom will provide unprecedented challenges to the CCMs used as policy tools for climate change assessments, with comprehensive data on atmospheric chemical reactivity at global scales, and will work closely with modeling teams to translate ATom data to better, more reliable CCMs. ATom provides extraordinary validation data for remote sensing.
Quality Assessment
Quality assessment procedures differ by instrument. Quality flags are provided within the data files for many of the measured parameters.
Data Acquisition, Materials, and Methods
Project Overview
ATom makes global-scale measurements of the chemistry of the atmosphere using the NASA DC-8 aircraft. Flights span the Pacific and Atlantic Oceans, nearly pole-to-pole, in continuous profiling mode, covering remote regions that receive long-range inputs of pollution from expanding industrial economies. The payload has proven instruments for in situ measurements of reactive and long-lived gases, diagnostic chemical tracers, and aerosol size, number, and composition, plus spectrally resolved solar radiation and meteorological parameters.
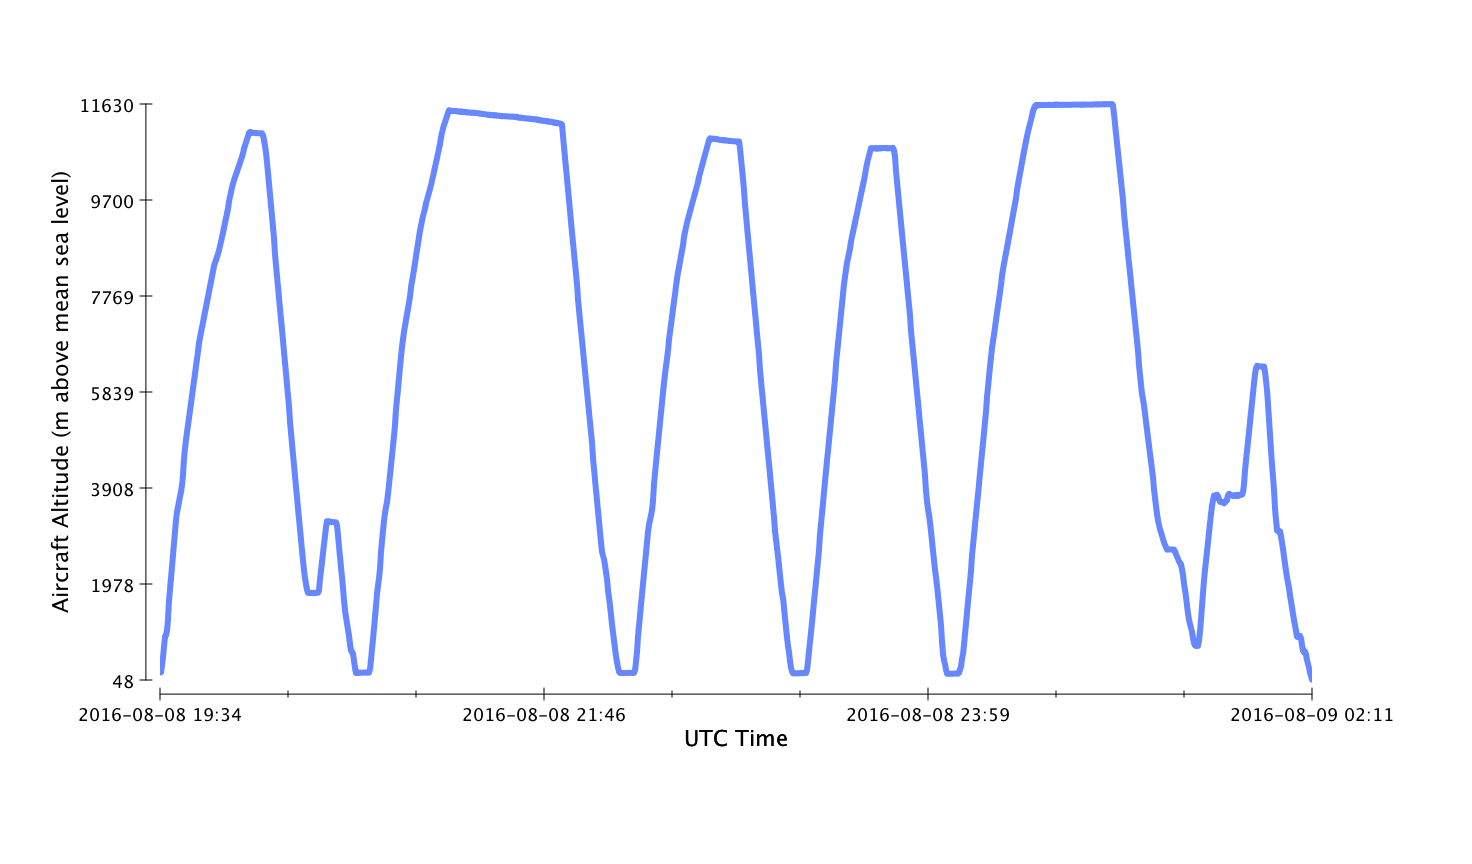
Figure 2. ATom flights continuously sampled atmospheric profiles. In this flight from Pago Pago, American Samoa to Christchurch, New Zealand, on August 8, 2016, the aircraft sampled 12 vertical profiles from about 50 to 11,000 meters above mean sea level. ATom measures more than 100 distinct chemical, aerosol, radiative, and physical parameters. Fast instrument sampling rates provide spatially resolved, simultaneous, and contiguous observational data, providing a nearly complete chemical description of each air parcel.
Combining distributions of aerosols and reactive gases with long-lived GHGs and ODSs enables disentangling of the processes that regulate atmospheric chemistry: emissions, transport, cloud processes, and chemical transformations. ATom analyzes measurements using customized modeling tools to derive daily averaged chemical rates for key atmospheric processes and to critically evaluate CCMs. ATom also differentiates between hypotheses for the formation and growth of aerosols over the remote oceans.
Table 5. Instruments on board the NASA DC-8 for ATom campaigns, their measurements, and associated variable groups in netCDF data files. Additional information about each instrument and the DC-8 platform is available at https://espo.nasa.gov/atom/instruments.
| Instrument | Full Name | Investigator | Type | Measurements | Variable Group in netCDF Files |
|---|---|---|---|---|---|
| AMP | In Situ Measurements of Aerosol Microphysical Properties | Charles Brock | Spectrometer (in situ) | Aerosol Size Distribution | NAerosol, SDAerosol |
| AO2 | NCAR Airborne Oxygen Instrument | Britton Stephens | O2, CO2 | AO2 | |
| ATHOS | Airborne Tropospheric Hydrogen Oxides Sensor | William H. Brune | Fluorescence | OH, Naphthalene, HO2, NO | ATHOS-HOx, ATHOS-OHI, ATHOS-OHR |
| CAFS | Charged-coupled device Actinic Flux Spectroradiometers | Samuel R. Hall | Spectrometer (in situ) |
Spectrally resolved actinic flux and photolysis frequencies typically calculated for the following species: O3, NO2, NO3, CH2O, HONO, HNO3, N2O5, HNO4, PAN, H2O2, CH3OOH, CH3ONO2, CH3CH2ONO2, CH3CHO, CH3CH2CHO, CHOCHO, CH3COCHO, 3-Butanedione, Methacrolein, MVK, (CH3)2CO, MEK, Br2, BrO, BrNO, BrNO2, BrONO, BrONO2, BrCl, HOBr, CHBr3, Cl2, ClO, ClNO2, ClONO, ClONO2 |
CAFS-JV |
| CAPS Vienna | Cloud Aerosol and Precipitation Spectrometer (University of Vienna) | Bernadett Weinzierl | Aerosol, Particle size distribution, Cloud Liquid Water Content |
Cloudindicator, |
|
| CIT-CIMS | Chemical Ionization Mass Spectrometer (California Institute of Technology) | Paul Wennberg | Chemical Ionization Mass Spectrometer | HNO3, H2O2, CH3OOH, HCN, PAA, PNA, SO2 | CIT-H2O2, CIT-HCN, CIT-HNO3, CIT-MHP, CIT-PAA, CIT-PNA, CIT-SO2 |
| DLH | Diode Laser Hygrometer | Glenn S. Diskin | Laser absorption | H2O | DLH-H2O |
| GT-CIMS | Chemical Ionization Mass Spectrometer (Georgia Tech) | L. Greg Huey | Chemical Ionization Mass Spectrometer | HNO3, SO2, HNO4, HCl, Br2, BrO, PAN | GTCIMSPANS |
| HR-AMS | Aircraft High-Resolution Time-of-Flight Aerosol Mass Spectrometer (University of Colorado, Boulder) | Jose-Luis Jimenez | Spectrometer (in situ) |
Organic Aerosol, NH4, NO3, SO4, NR-Cl, Br-, Iodine, seasalt, MSA, ClO4, pRONO2 |
AMS, AMSSD |
| ISAF | In Situ Airborne Formaldehyde | Glenn M. Wolfe | Fluorescence | CH2O | ISAF-H2CO |
| LIF-SO2 | Laser Induced Fluorescence - Sulfur Dioxide | Andrew Rollins | Fluorescence | SO2 | SO2-LIF |
| Medusa | Medusa Whole Air Sampler | Britton Stephens | Whole Air Sampling | O2, CO2, N2, Argon, CO2 isotopes | MEDUSA MEDUSA-Kernel |
| MMS | Meteorological Measurement System | T. Paul Bui | 3D Wind, Turbulence, Temperature, Position, Velocities, Attitudes, True-Airspeed, Potential Temperature |
MMS | |
| NOAA Picarro | NOAA Picarro | Kathryn McKain | Spectrometer (in situ) | CO2, CH4, CO | NOAA-Picarro |
| NOAA ToF CIMS | NOAA Iodide Ion Time-of-Flight Chemical Ionization Mass Spectrometer | J. Andy Neuman | Chemical Ionization Mass Spectrometer | HCOOH, ClNO2, N2O5, BrO, Cl2, BrCN, BrCl, C2H4O3S |
NOAACIMS-BrCN, |
| NOyO3 | NOAA Nitrogen Oxides and Ozone | Thomas B Ryerson | Chemiluminescence | NO, NO2, NOy, O3 | NOyO3-NO, NOyO3-NO2, NOyO3-NOy, NOyO3-O3 |
| PALMS | Particle Analysis By Laser Mass Spectrometry | Gregory Schill | Spectrometer (in situ) | Particle Composition, Aerosol | PALMS, PALMS-PartType-Mass, PALMS-Chem-Mass |
| PANTHER | PAN and Trace Hydrohalocarbon ExpeRiment | James W. Elkins | Gas chromatography | (CH3)2CO, PAN, H2, CH4, CO, N2O, SF6, CFCl3, CF2Cl2, Halon-1211 | GCECD, GCMSD |
| PFP | Programmable Flask Package Whole Air Sampler | Stephen (Steve) Montzka | Whole Air Sampling | N2O, SF6, H2, CS2, OCS, CO2, CH4, CO, CFCs, HCFCs, HFCs, Solvents, Methyl Halides, Hydrocarbons, Perfluorocarbons | PFP |
| QCLS | Quantum Cascade Laser System | Bruce Daube | Laser absorption | CO2, CO, CH4, N2O | QCLS-CH4-CO-N2O, QCLS-CO2 |
| SAGA | Soluble Acidic Gases and Aerosols | Jack Dibb | Ion Chromatography | Na, NH4, K, Mg, Ca+2, Cl, Br-, NO3, SO4, C2O4-2, Be-7, Pb-210, HNO3 | SAGA-AERO, SAGA-MC |
| SP2 | Single Particle Soot Photometer (NOAA) | Joshua (Shuka) Schwarz | Photometer | Black Carbon, Aerosol | SP2-BC |
| TOGA | Trace Organic Gas Analyzer | Eric Apel | Gas chromatography, Spectrometer (in situ) | VOCs | TOGA |
| UCATS | UAS Chromatograph for Atmospheric Trace Species | Brad Hall | Gas chromatography, Spectrometer (in situ) | N2O, SF6, CH4, CO, O3, H2, H2O, CHCl3, CCl4, CF2Cl2, CFCl3, CF2ClCFCl2, Halon-1211 | UCATS-GC, UCATS-H2O, UCATS-O3 |
| WAS (UCI) | Whole Air Sampler (University of California, Irvine) | Donald R. Blake | Whole Air Sampling | NMHCs, Halocarbons, Alkyl Nitrates, OCS, DMS, CS2 | WAS |
| GEOS5 | Paul Newman | Weather Analysis and Prediction Model | GEOS5 forward processing meteorological products interpolated to the flight track: winds, vorticity, humidity, temperature, simply specified tracers (CO, SO2, many aerosol types) | GEOS5 | |
| GMI | Sarah Strode | Chemistry-Transport Model | GMI full chemistry CTM hindcast: gas-phase chemistry (40 species) along 10-sec merge, interpolated to the flight track | GMI |
ATom is closely linked to satellites measuring atmospheric chemical composition: (i) ATom provides unique data for validation and algorithm development for OCO-2, GOME-2, TROPOMI, GOSAT, plus those planned for geostationary orbit (TEMPO), and the TCCON network. (ii) ATom uses satellite data to extend its airborne in-situ observations to a global scale. (iii) ATom directly engages CCM groups and delivers a single, large-scale, contiguous in-situ dataset for model evaluation and improvement.
Merge File Methods
This dataset includes merged data from all instruments. A variety of merged file types have been created for each flight date. The merge files include additional data such as numbered profiles and distance flown. In the case of data obtained over longer time intervals (e.g., flask data), the merge files provide (weighted) averages of 1-second data to match the sampling intervals. The ICARTT file merge procedure was performed by the ATom team. It was executed in R language and the merge script ATom_merging_Rcode_20210804.pdf)is provided as a companion file with this dataset. The merged ICARTT files were then converted to netCDF-4 format by ORNL DAAC.
For more information, see the ATom website on the NASA Earth Science Project Office (ESPO) site at https://espo.nasa.gov/atom.
Data Access
These data are available through the Oak Ridge National Laboratory (ORNL) Distributed Active Archive Center (DAAC).
ATom: Merged Atmospheric Chemistry, Trace Gases, and Aerosols, Version 2
Contact for Data Center Access Information:
- E-mail: uso@daac.ornl.gov
- Telephone: +1 (865) 241-3952
References
Dataset Revisions
| Version | Release Date | Description |
|---|---|---|
| 2.0 | 2022-07-26 | Table 5 of the User Guide was updated to fix errors in the Measurements column. |
| 2.0 | 2021-08-26 | All previously-released data were updated to the latest available versions. |
| 1.5 | 2020-09-24 | All previously-released data were updated to the latest available versions. |
| 1.4 | 2019-11-25 | Initial release of MER-TOGA and MER-WAS data from ATom-4 campaign. All previously-released data were updated to the latest available versions. |
| 1.3 | 2019-06-14 | Initial release of MER-TOGA and MER-WAS data from ATom-3 campaign. All previously-released data were updated to the latest available versions. |
| 1.2 | 2019-04-05 | Initial release of partial ATom-3 and Atom-4 data. Data from Atom-1 and Atom-2 were updated to the latest versions. |
| 1.1 | 2018-08-23 | Provides updated data from ATom-1 and ATom-2 with edits to the author list, metadata, and user guide. |
| 1.0 | 2018-03-28 | Initial release of data from ATom-1 and ATom-2 |