Documentation Revision Date: 2020-03-30
Dataset Version: 1
Summary
The ATom mission deployed an extensive gas and aerosol payload on the NASA DC-8 aircraft for systematic, global-scale sampling of the atmosphere, profiling continuously from 0.2 to 12 km altitude. Flights occurred in each of 4 seasons from 2016 to 2018.
This dataset includes 168 files in comma-delimited text (ICARTT) format, with three data files (one for each instrument) for each of the 56 flights.
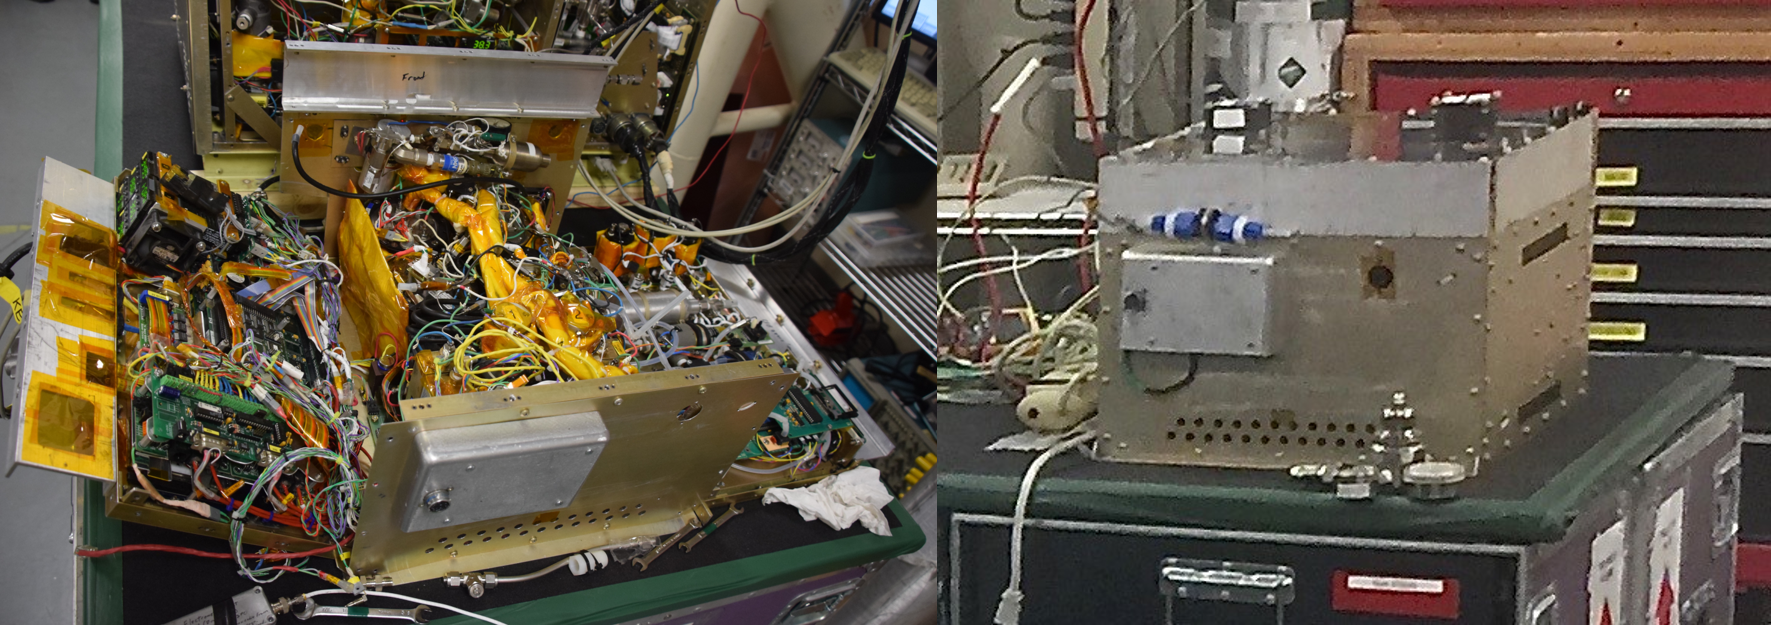
Figure 1. The UCATS system is three different instruments in one enclosure: a two-channel chromatograph with electron capture detectors (one measures N2O and SF6, the other measures CH4, H2 and CO), a tunable diode laser instrument for H2O, and a dual-beam O3 photometer.
Citation
Elkins, J.W., E.J. Hintsa, and F.L. Moore. 2019. ATom: Measurements from the UAS Chromatograph for Atmospheric Trace Species (UCATS). ORNL DAAC, Oak Ridge, Tennessee, USA. https://doi.org/10.3334/ORNLDAAC/1750
Table of Contents
- Dataset Overview
- Data Characteristics
- Application and Derivation
- Quality Assessment
- Data Acquisition, Materials, and Methods
- Data Access
- References
Dataset Overview
This dataset, collected with the Unmanned Aircraft Systems (UAS) Chromatograph for Atmospheric Trace Species (UCATS), provides atmospheric concentrations of nitrous oxide (N2O), sulfur hexafluoride (SF6), methane (CH4), hydrogen (H2), carbon monoxide (CO), water vapor (H2O), and ozone (O3). The UCATS system is three different instruments in one enclosure: a two-channel chromatograph with electron capture detectors (one measures N2O and SF6, the other measures CH4, H2 and CO), a tunable diode laser instrument for H2O, and a dual-beam O3 photometer.
The ATom mission deployed an extensive gas and aerosol payload on the NASA DC-8 aircraft for systematic, global-scale sampling of the atmosphere, profiling continuously from 0.2 to 12 km altitude. Flights occurred in each of 4 seasons from 2016 to 2018.
Project: Atmospheric Tomography Mission
The Atmospheric Tomography Mission (ATom) was a NASA Earth Venture Suborbital-2 mission. It studied the impact of human-produced air pollution on greenhouse gases and on chemically reactive gases in the atmosphere. ATom deployed an extensive gas and aerosol payload on the NASA DC-8 aircraft for systematic, global-scale sampling of the atmosphere, profiling continuously from 0.2 to 12 km altitude. Flights occurred in each of four seasons over a 4-year period.
Related Data:
ATom: Merged Atmospheric Chemistry, Trace Gases, and Aerosols. Data from all ATom instruments and all four flight campaigns, including aircraft location and navigation data, merged to several different time bases: https://doi.org/10.3334/ORNLDAAC/1581
ATom Flight Track and Navigational Data. Flight path (location and altitude) data for each of the four campaigns provided in KML and csv format: https://doi.org/10.3334/ORNLDAAC/1613
Data Characteristics
Spatial Coverage: Global. Flights circumnavigated the globe, primarily over the oceans.
Spatial Resolution: In situ sampling and analysis frequencies vary by instrument, thus the distance between data points varies.
Temporal Coverage: Periodic flights occurred during each campaign
Table 1. Flight campaign schedule
| Deployment | Date Range |
|---|---|
| ATom-1 | July 29 - August 23, 2016 |
| ATom-2 | January 26 - February 21, 2017 |
| ATom-3 | September 28 - October 28, 2017 |
| ATom-4 | April 24 - May 21, 2018 |
Temporal Resolution:
GC: Sample collection = 3 seconds. Reporting Frequency = 70 or 140 seconds.
Dual-beam ozone photometer: ATom-1 10 second data, ATom-2, 3, and 4 are 2 second data.
Tunable diode laser spectrometer: 1 second water vapor data
Data File Information
This dataset includes 168 files, with 56 files for each instrument type, in comma-delimited text (ICARTT) format. That is three instrument files per flight date for all four ATom flight campaigns. Data files conform to the ICARTT File Format Standards V1.1.
File Naming Convention
File names are structured as UCATS-X_DC8_YYYYMMDD_R#.ict
Where X is the measurement abbreviation (GC = gas chromatograph, H2O = water vapor, O3 = ozone),
YYYYMMDD is the start date (in UTC time) of the flight, and
R# is the file version or revision number.
Data Variables
Missing data are indicated by -9999.000.
Table 2. Variables in the data files UCATS-GC_DC8_YYYYMMDD_R#.ict.
| Name | Units | Description |
|---|---|---|
| Start_UTC | seconds | elapsed time in seconds from 00:00:00 UTC on flight date to start of sampling |
| Stop_UTC | seconds | elapsed time in seconds from 00:00:00 UTC on flight date to end of sampling |
| N2O_UCATS | ppb | nitrous oxide dry mole fraction mixing ratio |
| N2Oe_UCATS | ppb | nitrous oxide measurement error: 1 sigma* |
| SF6_UCATS | ppt | sulfur hexafluoride dry mole fraction mixing ratio |
| SF6e_UCATS | ppt | sulfur hexafluoride measurement error: 1 sigma* |
| CH4_UCATS | ppb | methane dry mole fraction mixing ratio |
| CH4e_UCATS | ppb | methane measurement error: 1 sigma* |
| H2_UCATS | ppb | dihydrogen dry mole fraction mixing ratio |
| H2e_UCATS | ppb | dihydrogen measurement error: 1 sigma* |
| CO_UCATS | ppb | carbon monoxide dry mole fraction mixing ratio |
| COe_UCATS | ppb | carbon monoxide measurement error: 1 sigma* |
*The error estimates are based on in-flight measurement precision of a calibration standard, the precision of laboratory measurements of a suite of calibration standards, and the goodness of fit of a simple curve to calibration data.
Table 3. Variables in the data files UCATS-H2O_DC8_YYYYMMDD_R#.ict.
| Name | Units | Description |
|---|---|---|
| Start_UTC | seconds | elapsed time in seconds from 00:00:00 UTC on flight date to start of sampling |
| Stop_UTC | seconds | elapsed time in seconds from 00:00:00 UTC on flight date to end of sampling |
| H2O_UWV | ppm | water vapor mixing ratio |
| H2Oe_UWV | ppm | water vapor measurement error: currently estimated at 5% + 1 ppm |
Table 4. Variables in the data files UCATS-O3_DC8_YYYYMMDD_R#.ict.
Note that ATom-1 data have known quality issues. See Section 4.
| Name | Units | Description |
|---|---|---|
| Start_UTC | seconds | elapsed time in seconds from 00:00:00 UTC on flight date to start of sampling |
| Stop_UTC | seconds | elapsed time in seconds from 00:00:00 UTC on flight date to end of sampling |
| O3_UCATS | ppb | ozone mixing ratio |
| O3e_UCATS | ppb | ozone measurement error: 1-sigma precision of the measurement, with some consideration of accuracy as well. See additional info in Section 4. |
Application and Derivation
ATom builds the scientific foundation for mitigation of short-lived climate forcers, in particular methane (CH4), tropospheric ozone (O3), and Black Carbon aerosols (BC).
ATom Science Questions
Tier 1
- What are chemical processes that control the short-lived climate forcing agents CH4, O3, and BC in the atmosphere? How is the chemical reactivity of the atmosphere on a global scale affected by anthropogenic emissions? How can we improve chemistry-climate modeling of these processes?
Tier 2
- Over large, remote regions, what are the distributions of BC and other aerosols important as short-lived climate forcers? What are the sources of new particles? How rapidly do aerosols grow to CCN-active sizes? How well are these processes represented in models?
- What type of variability and spatial gradients occur over remote ocean regions for greenhouse gases (GHGs) and ozone depleting substances (ODSs)? How do the variations among air parcels help identify anthropogenic influences on photochemical reactivity, validate satellite data for these gases, and refine knowledge of sources and sinks?
Significance
ATom delivers unique data and analysis to address the Science Mission Directorate objectives of acquiring “datasets that identify and characterize important phenomena in the changing Earth system” and “measurements that address weaknesses in current Earth system models leading to improvement in modeling capabilities.” ATom will provide unprecedented challenges to the CCMs used as policy tools for climate change assessments, with comprehensive data on atmospheric chemical reactivity at global scales, and will work closely with modeling teams to translate ATom data to better, more reliable CCMs. ATom provides extraordinary validation data for remote sensing.
Quality Assessment
Measurement error is reported as a separate variable with each measured variable.
Ozone Uncertainty
The ozone uncertainty is an attempt at an estimate of the combined precision and accuracy of the measurement. From the 2B Technologies manual for this instrument (Model 211), the precision is stated as "greater of 0.5 ppb or 1% of reading for 10-s average", and accuracy as "1.0 ppb or 2% of reading". For ATom-1, we had problems with our inlet, and left the uncertainty the same as what it had been for our previous instrument (5% + 2 ppb). For ATom-2, 3, and 4, we used a different inlet with improved results, and changed the uncertainty to 1% + 1.5 ppb, for 2 second data, to reflect this.
Ozone ATom -1 Time Issue
There is a start/stop time issue in the ATom-1 (10-second) ozone file. The start to stop difference is 11 seconds, and the next start time is 1 second earlier. There was a bug in the analysis code. Time is correct for all ATom-2, 3, and 4 (2-second) data. ATom-1 data were not updated because of overall higher uncertainty due to problems with the inlet, the fact that it is 10-second data, and NASA ESPO did not require it.
Data Acquisition, Materials, and Methods
ATom makes global-scale measurements of the chemistry of the atmosphere using the NASA DC-8 aircraft. Flights span the Pacific and Atlantic Oceans, nearly pole-to-pole, in continuous profiling mode, covering remote regions that receive long-range inputs of pollution from expanding industrial economies. The payload has proven instruments for in situ measurements of reactive and long-lived gases, diagnostic chemical tracers, and aerosol size, number, and composition, plus spectrally resolved solar radiation and meteorological parameters.
Combining distributions of aerosols and reactive gases with long-lived GHGs and ODSs enables disentangling of the processes that regulate atmospheric chemistry: emissions, transport, cloud processes, and chemical transformations. ATom analyzes measurements using customized modeling tools to derive daily averaged chemical rates for key atmospheric processes and to critically evaluate Chemistry-Climate Models (CCMs). ATom also differentiates between hypotheses for the formation and growth of aerosols over the remote oceans.
Unmanned Aircraft Systems Chromatograph for Atmospheric Trace Species
| Instrument | Full Name | Contact Person | Type | Measurements | Data Variables |
|---|---|---|---|---|---|
| UCATS | Unmanned Aircraft Systems Chromatograph for Atmospheric Trace Species | James W. Elkins | gas chromatography, spectrometer (in situ), photometer | trace gasses | N2O, SF6, CH4, CO, O3, H2, H2O |
The Unmanned Aircraft Systems (UAS) Chromatograph for Atmospheric Trace Species (UCATS) was designed and built for autonomous operation on pilotless aircraft. UCATS is three different instruments in one enclosure:
- It uses chromatography to separate atmospheric trace gases along a narrow heated column, followed by precise and accurate detection with electron capture detectors. There is a 2-channel gas chromatograph on UCATS, one channel measures nitrous oxide and sulfur hexafluoride, the other measures methane, hydrogen, and carbon monoxide.
- In addition, there is a dual-beam ozone photometer,
- and a tunable diode laser spectrometer for water vapor.
Gas is pumped into the instruments from an inlet outside the aircraft, measured, and vented.
UCATS is relatively lightweight and compact, making it ideal for smaller platforms, but it is easily adaptable to larger platforms. The data are used to measure sources and sinks of trace gases involved in climate and air quality, as well as transport through the atmosphere.
Data Access
These data are available through the Oak Ridge National Laboratory (ORNL) Distributed Active Archive Center (DAAC).
ATom: Measurements from the UAS Chromatograph for Atmospheric Trace Species (UCATS)
Contact for Data Center Access Information:
- E-mail: uso@daac.ornl.gov
- Telephone: +1 (865) 241-3952