Documentation Revision Date: 2022-01-26
Dataset Version: 1
Summary
There are 192 data files included in this dataset, 48 in ICARTT (*.ict) format and 144 in netCDF format (*.nc). Also included are three companion files in comma-separated values (*.csv) format.
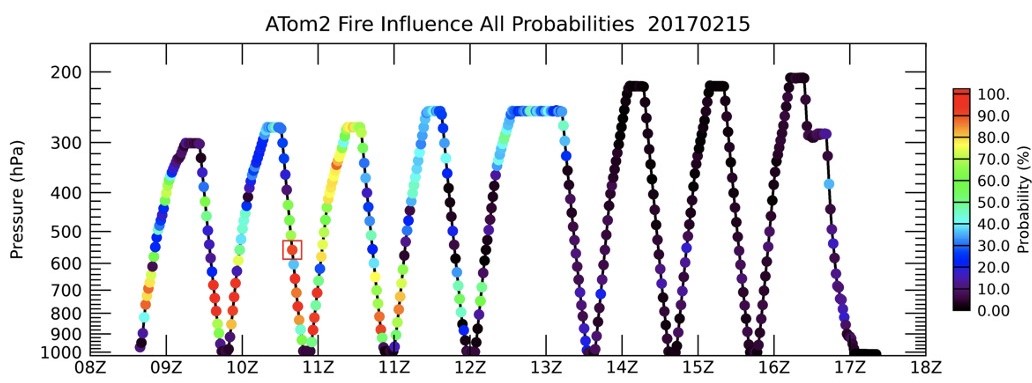
Figure 1. Fire influences for air parcels on the ATom-2 research flight that occurred on 2017-02-15.
Citation
Ray, E.A. 2021. ATom: Back Trajectories and Influences of Air Parcels Along Flight Track, 2016-2018. ORNL DAAC, Oak Ridge, Tennessee, USA. https://doi.org/10.3334/ORNLDAAC/1889
Table of Contents
- Dataset Overview
- Data Characteristics
- Application and Derivation
- Quality Assessment
- Data Acquisition, Materials, and Methods
- Data Access
- References
Dataset Overview
This dataset contains back trajectories, boundary layer influences, and convective influences of air parcels along NASA DC-8 aircraft's flight tracks during the four ATom campaigns that occurred from 2016 to 2018. Back trajectories were interpolated using National Centers for Environmental Prediction (NCEP) Global Forecast System (GFS) and Modern-Era Retrospective analysis for Research and Applications, Version 2 (MERRA2) meteorology. Back trajectory analysis determines the origin of air masses by modeling the path of an air parcel backward in time. It can be used to better understand the sources of atmospheric compounds. Boundary layer Influences were determined based on 30 Day Back Trajectories. The atmospheric boundary layer is the lowest part of the troposphere that is directly influenced by earth's surface. The boundary layer influences wind patterns and thus the dispersal of pollutants and other atmospheric compounds of interest. Convective influences were based on 10 Day Back Trajectories and NASA Langley cloud products. Convective influences model the effects of convection on the movement of water vapor through the atmosphere, which influences cloud behavior.
Project: Atmospheric Tomography Mission
The Atmospheric Tomography Mission (ATom) was a NASA Earth Venture Suborbital-2 mission. It studied the impact of human-produced air pollution on greenhouse gases and on chemically reactive gases in the atmosphere. ATom deployed an extensive gas and aerosol payload on the NASA DC-8 aircraft for a systematic, global-scale sampling of the atmosphere, profiling continuously from 0.2 to 12 km altitude. Flights occurred in each of four seasons over a 4-year period.
Related Datasets
Wofsy, S.C., S. Afshar, H.M. Allen, E.C. Apel, E.C. Asher, B. Barletta, et al. 2021. ATom: Merged Atmospheric Chemistry, Trace Gases, and Aerosols, Version 2. ORNL DAAC, Oak Ridge, Tennessee, USA. https://doi.org/10.3334/ORNLDAAC/1925.
- Data from all ATom instruments and all four flight campaigns, including aircraft location and navigation data, merged to several different time bases.
Wofsy, S.C., and ATom Science Team. 2018. ATom: Aircraft Flight Track and Navigational Data. ORNL DAAC, Oak Ridge, Tennessee, USA. https://doi.org/10.3334/ORNLDAAC/1613
- Flight path (location and altitude) data for each of the four campaigns provided in KML and CSV formats.
Data Characteristics
Spatial Coverage: Global. Flights circumnavigate the globe, primarily over the oceans
Spatial Resolution: Point measurements for Influences ICARTT files; 0.3 degrees north x 0.3 degrees east x 20 hPa cubes for BackTraj, BdyInfluence, and ConvectInfluence NetCDF files (see Table 1)
Temporal Coverage: Periodic flights occurred during each campaign
| Campaign | Date Range |
|---|---|
| ATom-1 | July 29 - August 23, 2016 |
| ATom-2 | January 26 - February 21, 2017 |
| ATom-3 | September 28 - October 28, 2017 |
| ATom-4 | April 24 - May 21, 2018 |
Temporal Resolution: 60 seconds
Data File Information
There are 192 data files included in this dataset, 48 in ICARTT (*.ict) format and 144 in netCDF format (*.nc). The data files conform to the ICARTT File Format Standards V1.1 or CF Conventions. Also included are three companion files in comma-separated values (*.csv) format. The files are named FileType _DC8_YYYYMMDD_R#.ext, where FileType is the type of data (Table 1), YYYYMMDD is the start date (in UTC time) of the flight, R# is the file version or revision number, and ext is the file extension ("csv" or "nc").
Table 1. File names and descriptions.
| File Name | Description |
|---|---|
| Data Files | |
| BackTraj_DC8_YYYYMMDD_R#.nc | NetCDF files containing back trajectories that were interpolated from NCEP and MERRA outputs. |
| BdyInfluence_DC8_YYYYMMDD_R#.nc | NetCDF files containing boundary layer influences that were determined based on 30 day back trajectories. |
| ConvectInfluence_DC8_YYYYMMDD_R#.nc | NetCDF files containing convective influences that were based on 10 day back trajectories and NASA Langley cloud products. |
| Influences_DC8_YYYYMMDD_R#.ict | ICARTT files containing convective and boundary influences that were derived from back trajectories derived from trajectories run with NCEP GFS and NASA Langley cloud products. These variables were taken directly from the NetCDF files. |
| Companion Files | |
| BackTraj_data_dictionary.csv | Contains the data dictionary for files named BackTraj_DC8_YYYYMMDD_R#.nc |
| BdyInfluence_data_dictionary.csv | Contains the data dictionary for files named BdyInfluence_DC8_YYYYMMDD_R#.nc |
| ConvectInfluence_data_dictionary.csv | Contains the data dictionary for files named ConvectInfluence_DC8_YYYYMMDD_R#.nc |
Data File Details
Missing data are indicated by -9999.
The data dictionaries for the data files are provided as companion files (Table 1), except for files named Influences_DC8_YYYYMMDD_R#.ict, which is provided in Table 2.
Table 2. Variable names and descriptions for files named Influences_DC8_YYYYMMDD_R#.ict.
| Variable | Units | Description |
|---|---|---|
| Start_UTC | Seconds | Start time in seconds since 0000 UTC |
| Stop_UTC | Seconds | Stop time in seconds since 0000 UTC |
| Julian_Day | Days | Julian day |
| Lat | Degrees north | Latitude in decimal degrees |
| Lon | Degrees east | Longitude in decimal degrees |
| Pres | hPa | Pressure |
| Prob_ConvInf | Percent | Probability of convective influence based on the coincidence of the cluster of back trajectories with satellite derived clouds products, RH threshold of 50% and NCEP GFS cloud water. Trajectories were run with NCEP GFS input winds. |
| Prob_ConvInf_Land | Percent | Probability of convective influence over land based on the coincidence of the cluster of back trajectories with satellite derived clouds products, RH threshold of 50% and NCEP GFS cloud water. |
| ConvInf_CldTop | Km | Cloud top height of most recent convective influence. |
| Days_Since_ConvInf | Days | Average days since all convective influence in each trajectory cluster. |
| Days_Since_Most_Recent_ConvInf | Days | Most recent days since convective influence in each trajectory cluster. |
| Prob_BdyInf | Percent | Average probability of boundary layer influence for all trajectory times. |
| Days_Since_BdyInf_Most_Recent | Days | Average time since most recent boundary layer influence in each trajectory cluster. |
| Days_Since_BdyInf_All | Days | Average time since all boundary layer influence in each trajectory cluster. |
| Prob_Land_BdyInf | Percent | Average probability of boundary layer influence over land for all trajectory times. |
| Days_Since_Land_BdyInf_Most_Recent | Days | Average time since most recent boundary layer influence over land in each trajectory cluster. |
| Prob_SeaIceInf | Percent | Average probability of sea ice boundary layer influence. |
| Prob_StratInf | Percent | Average probability of stratospheric influence. |
| Days_Since_StratInf_Most_Recent | Days | Average time since most recent stratospheric influence in each trajectory cluster. |
| Days_Since_StratInf_All | Days | Average time since all stratospheric influence in each trajectory cluster. |
| Prob_FireInf | Percent | Average probabilities of trajectory coincidence with MODIS and GFED fire locations. Fire plume heights were estimated from fire radiative power. |
| Days_Since_FireInf_Most_Recent | Days | Average time since most recent fire influence in each trajectory cluster. |
| Days_Since_FireInf_All | Days | Average time since all fire influence in each trajectory cluster. |
| Sunlight_Exposure | Hours | Total sunlight exposure over the trajectories. |
Application and Derivation
ATom builds the scientific foundation for mitigation of short-lived climate forcers, in particular, methane (CH4), tropospheric ozone (O3), and Black Carbon aerosols (BC).
ATom Science Questions
Tier 1
- What are chemical processes that control the short-lived climate forcing agents CH4, O3, and BC in the atmosphere? How is the chemical reactivity of the atmosphere on a global scale affected by anthropogenic emissions? How can we improve chemistry-climate modeling of these processes?
Tier 2
- Over large, remote regions, what are the distributions of BC and other aerosols important as short-lived climate forcers? What are the sources of new particles? How rapidly do aerosols grow to CCN-active sizes? How well are these processes represented in models?
- What type of variability and spatial gradients occurs over remote ocean regions for greenhouse gases (GHGs) and ozone-depleting substances (ODS)? How do the variations among air parcels help identify anthropogenic influences on photochemical reactivity, validate satellite data for these gases, and refine knowledge of sources and sinks?
Significance
ATom delivers unique data and analysis to address the Science Mission Directorate objectives of acquiring “datasets that identify and characterize important phenomena in the changing Earth system” and “measurements that address weaknesses in current Earth system models leading to improvement in modeling capabilities.” ATom will provide unprecedented challenges to the CCMs used as policy tools for climate change assessments, with comprehensive data on atmospheric chemical reactivity at global scales, and will work closely with modeling teams to translate ATom data to better, more reliable CCMs. ATom provides extraordinary validation data for remote sensing.
Quality Assessment
Quality flags are provided within the data files for some parameters.
Data Acquisition, Materials, and Methods
Project Overview
ATom makes global-scale measurements of the chemistry of the atmosphere using the NASA DC-8 aircraft. Flights span the Pacific and Atlantic Oceans, nearly pole-to-pole, in continuous profiling mode, covering remote regions that receive long-range inputs of pollution from expanding industrial economies. The payload has proven instruments for in situ measurements of reactive and long-lived gases, diagnostic chemical tracers, and aerosol size, number, and composition, plus spectrally resolved solar radiation and meteorological parameters.
Combining distributions of aerosols and reactive gases with long-lived GHGs and ODSs enables disentangling of the processes that regulate atmospheric chemistry: emissions, transport, cloud processes, and chemical transformations. ATom analyzes measurements using customized modeling tools to derive daily averaged chemical rates for key atmospheric processes and to critically evaluate CCMs. ATom also differentiates between hypotheses for the formation and growth of aerosols over the remote oceans.
Back Trajectories
Back trajectory analysis determines the origin of air masses by modeling the path of an air parcel backward in time. It can be used to better understand the sources of atmospheric compounds. Back trajectories were interpolated from National Centers for Environmental Prediction (NCEP) Global Forecast System (GFS) and Modern-Era Retrospective analysis for Research and Applications, Version 2 (MERRA-2) meteorology. A cluster of 245 trajectories was initialized in a cube centered at each one-minute interval along the ATom flight tracks and run backward with the Traj3D trajectory model (Bowman, 1993; Bowman and Carrie, 2002). NCEP GFS is a global numerical weather prediction system containing a global computer model and variational analysis. Additional information can be found on the NCEP GFS description webpage. MERRA-2 models atmospheric characteristics utilizing long-term global reanalysis to assimilate space-based observations of aerosols and represent their interactions with other physical processes in the climate system. Additional information can be found on NASA’s MERRA-2 webpage.
Boundary Influences
The atmospheric boundary layer is the lowest part of the troposphere that is directly influenced by the earth's surface. The boundary layer influences wind patterns and thus the dispersal of pollutants and other atmospheric compounds of interest. Boundary layer Influences were determined based on 30 Day Back Trajectories.
Convective Influences
Convective influences model the effects of convection on the movement of water vapor through the atmosphere, which influences cloud behavior. Convective influences were based on 10 Day Back Trajectories and NASA Langley cloud products.
Data Access
These data are available through the Oak Ridge National Laboratory (ORNL) Distributed Active Archive Center (DAAC).
ATom: Back Trajectories and Influences of Air Parcels Along Flight Track, 2016-2018
Contact for Data Center Access Information:
- E-mail: uso@daac.ornl.gov
- Telephone: +1 (865) 241-3952
References
Bowman, K. P., 1993. Large-scale isentropic mixing properties of the Antarctic polar vortex from analyzed winds. Journal of Geophysical Research 98:23013–23027. https://doi.org/10.1029/93JD02599.
Bowman, K. P., and G. R. Carrie. 2002. The mean-meridional transport circulation of the troposphere in an idealized GCM. Journal of the Atmospheric Sciences 59:1502–1514. https://doi.org/10.1175/1520-0469(2002)059<1502:TMMTCO>2.0.CO;2.