Documentation Revision Date: 2016-11-29
Data Set Version: V1
Summary
This data set includes 1069 files in netCDF (*.nc4) format: 34 monthly files and 1035 daily files. Daily files contain NEE data at an hourly resolution. The algorithm theoretical basis document (ATBD) for this data product is included as a companion file.

Figure 1: Estimated continental-scale Net Ecosystem Exchange (NEE) of CO2 in February 2012.
Citation
Ali, A.A., K. Zhang, A. Antonarakis, and P.R. Moorcroft. 2016. AirMOSS: L4 Modeled Net Ecosystem Exchange (NEE), Continental USA, 2012-2014. ORNL DAAC, Oak Ridge, Tennessee, USA. http://dx.doi.org/10.3334/ORNLDAAC/1423
Table of Contents
- Data Set Overview
- Data Characteristics
- Application and Derivation
- Quality Assessment
- Data Acquisition, Materials, and Methods
- Data Access
- References
Data Set Overview
This data set provides Level 4 estimates of Net Ecosystem Exchange (NEE) of CO2 across the conterminous USA at a spatial resolution of 50 km. Modeled estimates are provided at hourly and monthly temporal resolutions, from January 2012 through October 2014. The AirMOSS L4 Regional NEE data were produced by the Ecosystem Demography Biosphere Model (ED2) augmented by the AirMOSS-derived L2/3 root zone soil moisture data as an additional input. The AirMOSS soil moisture data were used to estimate the sensitivity of carbon fluxes to soil moisture and to diagnose and improve estimation and prediction of NEE by constraining the model’s predictions of soil moisture and its impact on above- and below-ground fluxes.
Project: Airborne Microwave Observatory of Subcanopy and Subsurface (AirMOSS)
The goal of NASA’s Airborne Microwave Observatory of Subcanopy and Subsurface (AirMOSS) investigation is to provide high-resolution observations of root-zone soil moisture over regions representative of the major North American climatic habitats (biomes), quantify the impact of variations in soil moisture on the estimation of regional carbon fluxes, and extrapolate the reduced-uncertainty estimates of regional carbon fluxes to the continental scale of North America.
- The AirMOSS campaign used an airborne ultra-high frequency synthetic aperture radar flown on a Gulfstream-III aircraft to derive estimates of soil moisture down to approximately 1.2 meters.
- Extensive ground, tower, and aircraft in-situ measurements were collected to validate root-zone soil measurements and carbon flux model estimates.
The AirMOSS soil measurements can be used to better understand carbon fluxes and their associated uncertainties on a continental scale. Additionally, AirMOSS data provide a direct means for validating root-zone soil measurement algorithms from the Soil Moisture Active & Passive (SMAP) mission and assessing the impact of fine-scale heterogeneities in its coarse-resolution products.
Related Data:
The following AirMOSS data were directly used to generate this data:
Moghaddam, M., A. Tabatabaeenejad, R.H. Chen, S.S. Saatchi, S. Jaruwatanadilok, M. Burgin, X. Duan, and M.L. Truong-Loi. 2016. AirMOSS: L2/3 Volumetric Soil Moisture Profiles Derived From Radar, 2012-2015. ORNL DAAC, Oak Ridge, Tennessee, USA. http://dx.doi.org/10.3334/ORNLDAAC/1418
Zhang, K., A.A. Ali, A. Antonarakis, and P.R. Moorcroft. 2016. AirMOSS: L4 Daily Modeled Net Ecosystem Exchange (NEE), AirMOSS sites, 2012-2014. ORNL DAAC, Oak Ridge, Tennessee, USA. http://dx.doi.org/10.3334/ORNLDAAC/1422
A full list of AirMOSS data products is available at: https://airmoss.ornl.gov/dataproducts.html.
Data Characteristics
Spatial Coverage: Conterminous USA
Spatial Resolution: 50 km grid
Temporal Coverage: 20120101 to 20141031
Temporal Resolution: Hourly and monthly
Study Area (coordinates in decimal degrees)
|
Site |
Westernmost Longitude |
Easternmost Longitude |
Northernmost Latitude |
Southernmost Latitude |
|
North America |
-124.938 |
-66.937 |
53.062 |
25.062 |
Data File Information
This data set includes 1069 files in netCDF (*.nc4) format: 34 monthly files and 1035 daily files. Daily files contain 24 data layers, one for each hour of the day. Monthly files contain one data layer, showing the estimated net ecosystem exchange for the whole month. The algorithm theoretical basis document (ATBD) for this data product is included as a companion file (AirMOSS_L4NEE_ATBD_V2.0_160928.pdf).
File naming convention
AirMOSS L4 Daily NEE data file names have the format:
L4BNEE_yyyy-mm-dd_vv.nc4 or L4BNEE_yyyy-mm_vv.nc4
where:
yyyy-mm-dd = date for daily files
yyyy-mm = month for the monthly files
vv = version number
Table 1. Data fields in the L4 Regional NEE data files. Missing data are represented by -9999.
|
Data Field |
Units |
Description |
|
lat |
degrees North |
Latitude of grid cell |
|
lon |
degrees East |
Longitude of grid cell |
|
time |
UTC time |
Date of modeled output. Daily files: hours since 2010-01-01 00:00:00 UTC. Monthly files: months since 2010-01-01 00:00:00 UTC. |
|
NEE |
Daily files: gC/m^2/hour or |
Net ecosystem exchange of CO2 per grid cell |
Application and Derivation
The AirMOSS data products and expected science results are tailored to meet the need to reduce uncertainty in estimates of net ecosystem exchange (NEE) through the development of methodologies to integrate remote sensing observations, in-ground soil sensors, and flux tower data into regional/continental flux models. Additionally, AirMOSS data provide a direct means for evaluating RZSM algorithms of the SMAP Decadal Survey mission and assessing the impact of fine-scale heterogeneities in its coarse-resolution products.
Quality Assessment
A key science objective of AirMOSS is a quantitative understanding of the impact of root-zone soil moisture on ecosystem carbon fluxes. The sensitivity of carbon flux to changes in soil moisture was calculated by comparing between ED2 model simulations that did, or did not, make use of AirMOSS soil moisture data. These comparisons are shown in the ATBD document for this data product.
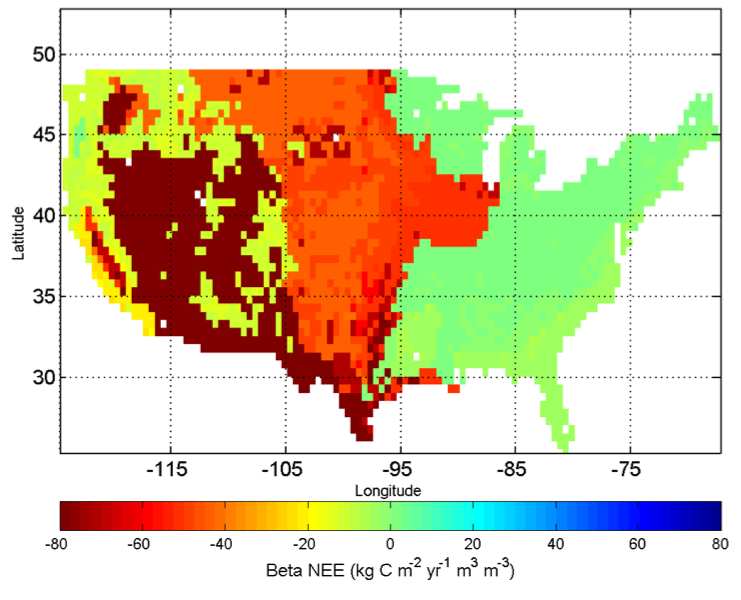
Figure 2. Patterns of NEE sensitivity to changes in soil moisture across the continental US (notation based on Friedlingstein et al. 2006).
There are several qualitatively different sources of error in the L4A/B-NEE products. These include 1) uncertainty in initial ecosystem structure and composition, 2) error in phenology, 3) errors in the meteorological forcing, 4) errors in the AirMOSS RZSM, and 5) model process error. The contributions of these different sources of error to the NEE estimates are described in the accompanying ATBD for this data product.
Data Acquisition, Materials, and Methods
The goal of the Airborne Microwave Observatory of Subcanopy and Subsurface (AirMOSS) investigation is to provide high-resolution observations of root-zone soil moisture over regions representative of the major North American climatic habitats (biomes), quantify the impact of variations in soil moisture on the estimation of regional carbon fluxes, and extrapolate the reduced-uncertainty estimates of regional carbon fluxes to the continental scale of North America.
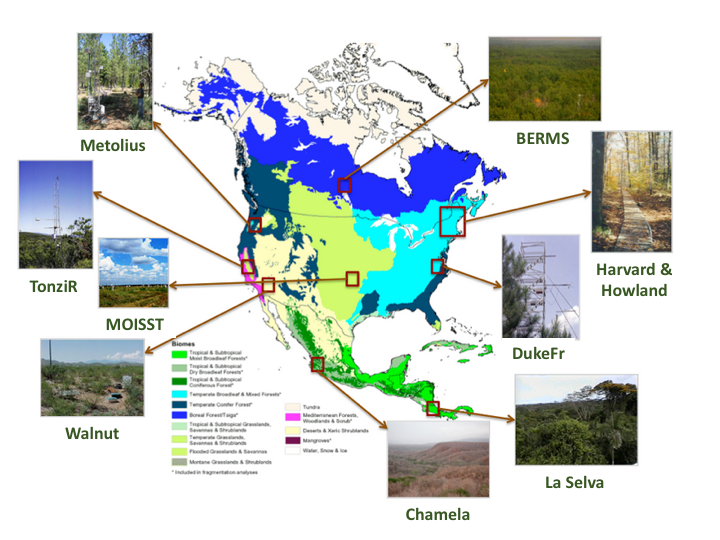
Figure 3. AirMOSS study sites were co-located with flux towers in nine different biomes across North America.
AirMOSS Flights
For AirMOSS, NASA's Uninhabited Aerial Vehicle Synthetic Aperture Radar (UAVSAR) was flown on a Gulfstream-III aircraft, making frequent flights over ten sites (Table 2 and Figure 3) in 9 different biomes of North America over the course of four years (Chapin et al. 2012).
Table 2. AirMOSS sites
|
Site name |
North latitude |
South latitude |
East longitude |
West longitude |
Fluxnet Site ID |
Description |
|
BermsP |
54.125 |
53.501 |
-103.626 |
-107.125 |
CA-Ojp & CA-Oas |
BERMS (Boreal Ecosystem Research and Monitoring Sites), Saskatchewan, Canada. Landcover: Mixed boreal forest. Elevation: 518m. |
|
Chamel |
20.326 |
19.316 |
-104.22 |
-105.29 |
MX-Cha |
Chamela Biological Station, Jalisco, Mexico. Landcover: Seasonally dry tropical forest. Elevation: 58m. |
|
DukeFr |
36.368 |
35.437 |
-78.694 |
-79.849 |
US-Dk1,US-Dk2, US-Dk3 |
Duke Forest site, North Carolina, USA. Landcover: Mature oak-hickory dominated hardwood forest. Elevation: 169m. |
|
Harvrd |
43.376 |
42.293 |
-71.839 |
-72.389 |
US-Ha1 & US-Ha2 |
Harvard Forest site, Massachusetts, USA. Landcover: Temperate deciduous forest. Elevation: 353m. |
|
Howlnd |
45.778 |
44.669 |
-68.336 |
-69.086 |
US-Ho1, US-Ho2, US-Ho3 |
Howland Forest site, Maine, USA. Landcover: boreal - northern hardwood transitional forest. Elevation 72m. |
|
LaSelv |
10.878 |
9.92 |
-83.519 |
-84.57 |
CR-Lse |
La Selva Biological Station, Costa Rica. Landcover: tropical rain forest. Elevation 93m. |
|
Metoli |
45.242 |
43.38 |
-120.363 |
-123.283 |
US-Me1 to US-Me6 |
Metolius site, Oregon, USA. Landcover: evergreen needleleaf forest. Elevation 1237m. |
|
Moisst |
36.880 |
35.775 |
-96.824 |
-98.996 |
US-ARM |
The Marena, Oklahoma In Situ Sensor Testbed (MOISST) is located in Oklahoma, USA. Landcover: temperate grasslands, crops. Elevation: 312m. |
|
TonziR |
38.625 |
37.501 |
-120.001 |
-121.25 |
US-Ton |
Tonzi Ranch site, California, USA. Landcover: oak savanna and grazed grassland. Elevation 170m. |
|
Walnut |
32.125 |
31.501 |
-109.376 |
-111.5 |
US-Wkg & US-Whs |
Walnut Gulch site, Arizona, USA. Landcover: warm season C4 grassland with a few shrubs. Elevation 1524m. |
Beginning in September 2012, the AirMOSS instrument flew 215 flight campaigns. A summary of flight campaigns by year and site is found in Table 3. Typically, the aircraft made repeat visits to sites in the same region in a single week and then proceeded to another region. Most sites had at least three campaigns per year. The Harvard and Howland forest sites were flown together in a single day. In 2012, Chamela, La Selva, and Tonzi were not surveyed.
Table 3. Summary of AirMOSS flight campaigns.
|
Site |
||||||||||
|
Year |
BermsP |
Chamel |
DukeFr |
Harvrd |
Howlnd |
LaSelv |
Metoli |
Oklaho |
TonziR |
Walnut |
|
2012 |
3 |
0 |
3 |
3 |
3 |
0 |
4 |
3 |
0 |
3 |
|
2013 |
6 |
3 |
9 |
9 |
9 |
6 |
7 |
8 |
5 |
6 |
|
2014 |
7 |
3 |
10 |
9 |
9 |
3 |
9 |
9 |
6 |
5 |
|
2015 |
9 |
2 |
5 |
5 |
5 |
3 |
9 |
6 |
5 |
6 |
|
Total |
25 |
8 |
27 |
26 |
26 |
12 |
29 |
26 |
16 |
20 |
A complete list of AirMOSS flights can be found at: https://airmoss.ornl.gov/flights.html.
AirMOSS Level 4B Regional NEE Data Product
Root-zone soil moisture and its spatial and temporal heterogeneity influences NEE. The L4B-NEE product consists of hourly and monthly estimates of carbon fluxes over the continental United States at 50km resolution. We used two approaches to scale the L4A-Daily-NEE products to the continental United States. The first method was to implement the Ecosystem Demography Model (ED2; see Medvigy et al., 2009) simulation algorithm developed for L4A-Daily-NEE a coarser spatial resolution of 50km. The second was a statistical extrapolation of L4A-Daily-NEE products onto the 50-km resolution continental-scale grid. Details of both procedures can be found in the algorithm theoretical basis document (ATBD) for this data product, included with this data set, AirMOSS_L4NEE_ATBD_V2.0_160928.pdf.
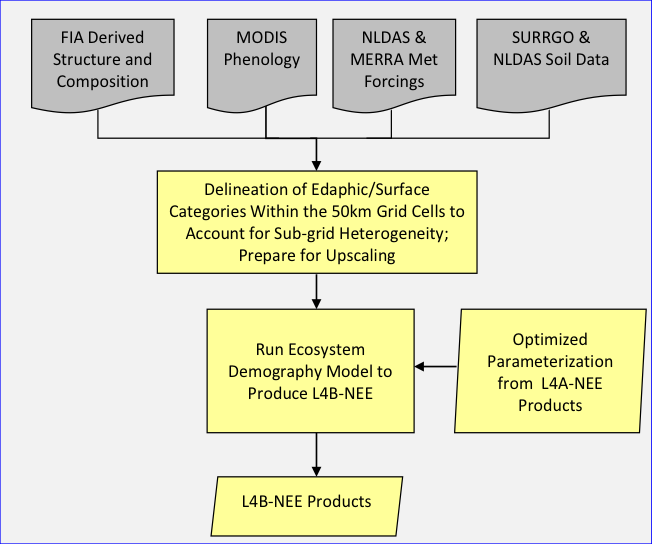
Figure 4. Multiple ancillary data sources were aggregated to the CONUS 50km grid cells relative to certain edaphic/surface conditions. The final L4B-Regional-NEE outputs were produced by the ED2 model.
Data Access
These data are available through the Oak Ridge National Laboratory (ORNL) Distributed Active Archive Center (DAAC).
AirMOSS: L4 Modeled Net Ecosystem Exchange (NEE), Continental USA, 2012-2014
Contact for Data Center Access Information:
- E-mail: uso@daac.ornl.gov
- Telephone: +1 (865) 241-3952
References
Chapin, E., A. Chau, J. Chen, B. Heavey, S. Hensley, Y. Lou, R. Machuzak, and M. Moghaddam. 2012. AirMOSS: An Airborne P-band SAR to measure root-zone soil moisture, 2012 IEEE Radar Conference, Atlanta, GA, 2012, pp. 0693-0698. http://dx.doi.org/10.1109/RADAR.2012.6212227
Friedlingstein, P., et al. (2006). Climate–Carbon Cycle Feedback Analysis: Results from the C4MIP Model Intercomparison, Journal of Climate, 19, 3337-3353. http://dx.doi.org/10.1175/JCLI3800.1
Medvigy, D, SC Wofsy, J.W. Munger, D.Y. Hollinger and P.R. Moorcroft (2009). Mechanistic scaling of ecosystem function and dynamics in space and time: the Ecosystem Demography model version 2, Journal of Geophysical Research – Biogeosciences, 114(G1). http://dx.doi.org/10.1029/2008JG000812