Documentation Revision Date: 2016-05-11
Data Set Version: V1
Summary
The peatland classification at 10-m resolution (bog, fen, marsh, swamp) and level of biomass (open, forested) at each wildfire area was based on a pre-burn, multi-date (1997 - 2013), multi-sensor (Optical and L-band SAR) fusion approach.
The fire progression maps were made using an algorithm that enabled an assessment of wildfire progression rates at a daily time scale. Fire progression was based on observed active fire detections from both the Terra and Aqua satellites using the MODIS active fire product (MCD14ML; Giglio et al. 2003).
The field data were collected at various sites across the study areas. All data were not collected at each site. Burn severity data, along with thaw and peat depths, were collected at 30 burned sites. Additional aboveground biomass, soil moisture, and woody seedling/sprouting data were collected at 17 of the same sites. The vegetation communities of 43 sites were characterized for validation of the peatland landcover classification.
There are five peatland type classification maps in GeoTIFF (*.tif) format and one fire progression file in shapefile (.shp) format. The field data are provided in six comma-separated (.csv) files. In addition, companion shapefile (.shp) and Google Earth (.kmz) files provide geo-located photos taken at the study sites, with location and field of view files.
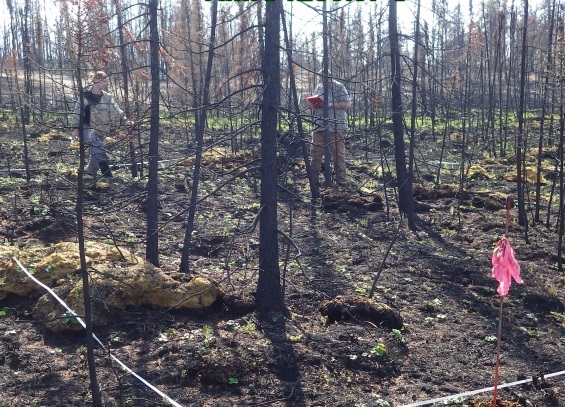
Figure 1. Field work at burned site (ZF-17) to collect burn severity, thaw and peat depths, biomass, soil moisture, and woody seedling/sprouting data in 2015.
Citation
Bourgeau-Chavez, L.L., N.H.F. French, S. Endres, L. Jenkins, M. Battaglia, E. Serocki, and M. Billmire. 2016. ABoVE: Burn Severity, Fire Progression, Landcover and Field Data, NWT, Canada, 2014. ORNL DAAC, Oak Ridge, Tennessee, USA. http://dx.doi.org/10.3334/ORNLDAAC/1307
Table of Contents
- Data Set Overview
- Data Characteristics
- Application and Derivation
- Quality Assessment
- Data Acquisition, Materials, and Methods
- Data Access
- References
Data Set Overview
Project: ABoVE
This data set provides peatland landcover classification maps, fire progression maps, and vegetation community biophysical data collected from areas burned by the 2014 wildfires in the Northwest Territories, Canada. The peatland maps include peatland type (bog, fen, marsh, swamp) and level of biomass (open, forested). The fire progression maps enabled an assessment of progression rates at a daily time scale. Field data include burn severity, woody seedling/sprouting data, soil moisture, and tree diameter and height of burned sites and similar vegetation characterization at landcover validation sites.
The peatland classification at 10-m resolution (bog, fen, marsh, swamp) and level of biomass (open, forested) at each wildfire area was based on a pre-burn, multi-date (1997 - 2013), multi-sensor (Optical and L-band SAR) fusion approach.
The fire progression maps were made using an algorithm that enabled an assessment of wildfire progression rates at a daily time scale. Fire progression was based on observed active fire detections from both the Terra and Aqua satellites using the MODIS active fire product (MCD14ML; Giglio et al. 2003).
The field data were collected at various sites across the study areas. All data were not collected at each site. Burn severity data, along with thaw and peat depths, were collected at 30 burned sites. Additional aboveground biomass, soil moisture, and woody seedling/sprouting data were collected at 17 of the same sites. The vegetation communities of 43 sites were characterized for validation of the peatland landcover classification.
The Arctic-Boreal Vulnerability Experiment (ABoVE) is a NASA Terrestrial Ecology Program field campaign taking place in Alaska and western Canada between 2016 and 2021. Climate change in the Arctic and Boreal region is unfolding faster than anywhere else on Earth, resulting in reduced Arctic sea ice, thawing of permafrost soils, decomposition of long-frozen organic matter, widespread changes to lakes, rivers, coastlines, and alterations of ecosystem structure and function. ABoVE seeks a better understanding of the vulnerability and resilience of ecosystems and society to this changing environment.
Data Characteristics
Spatial Coverage: Northwest Territories, Canada.
Site
Domain: Core ABoVE
State/territory: NWT
Grid cells: Ah2v1.Bh0v5, Ah2v1.Bh1v4, Ah2v1.Bh1v5, Ah2v1.Bh2v5, and Ah2v2.Bh0v0
Region: Great Slave Lake
Locale: Yellowknife
Spatial Resolution
Peatland type maps are 10-m resolution.
Fire progression maps (shapefiles) are 1-km resolution
Validation field sites are points in the center of 0.5-acre plots at selected locations. Validation locations were selected based on map classes in mostly unburned regions to provide better assessments of peatland types.
Aboveground biomass, biophysical site characteristics, burn severity, soil moisture, and woody seedling/sapling data were collected in six plots along two transects representing each 1-ha site.
Temporal Coverage
The peatland type maps were based on multi-date, multi-sensor fusion (Optical and L-band SAR) from 1997-07-07 to 2013-08-04.
Field data were collected from 2015-06-04 to 2015-07-15.
Fire progression maps cover the period 2014-06-06 to 2014-09-22.
Study Area: (all latitudes and longitudes given in decimal degrees)
| Site (Region) | Westernmost Longitude | Easternmost Longitude | Northernmost Latitude | Southernmost Latitude |
|---|---|---|---|---|
| Northwest Territories, Canada | -121.2030 | -111.178540 | 64.301420 | 60.5 |
Data File Information
There are five peatland type maps in GeoTIFF (*.tif) format and one fire progression file in shapefile (.shp) format (individual wildfire progression maps can be extracted from this shapefile). The field data are provided in six comma-separated (.csv) files.
Peatland Type Maps
There are five peatland type landcover maps of the wildfire areas in GeoTIFF (*.tif) including peatland type (bog, fen, marsh, swamp) and level of biomass (open, forested). The focus area of this study covered nine wildfire areas: SS03, SS68, SS130, FS33, FS26, ZF46, ZF85, ZF70, and ZF17. The maps are named according to the area names. Note-additional fire areas (due to close proximity-they were in the same scene) included SS33 (partial), SS15, SS70, SS97, SS81, SS82, SS152, SS96, FS49, ZF126, ZF143, ZF124, ZF92 (partial), and ZF45 (partial).
Table 1. Peatland type landcover maps as displayed in Figure 4 for wildfire areas shown in Figure 3.
| File Name | Wildfire Area |
|---|---|
| NWT_Wildfire_sites_zf20_zf85_zf46.tif | ZF20, ZF85, and ZF46 |
| NWT_Wildfire_sites_zf17.tif | ZF17 |
| NWT_Wildfire_sites_ss68.tif | SS68 |
| NWT_Wildfire_sites_ss03_ss130.tif | SS03, SS130 |
| NWT_Wildfire_sites_fs33_fs26.tif | FS33, FS26 |
Fire Progression Maps
The fire progression maps are in shapefile format (.shp) provided in the zip file (*.zip) 2014_NWT_fireprogression.zip.
Shapefile: 2014_NWT_fireprogression.shp.
This shapefile shows the overall spatial extent and date (DOY) burned of 1-km pixels of selected fires over the period June 6 - September 22, 2014 . Fire progression was based on observed active fire detections from both the Terra and Aqua satellites using the MODIS active fire product.
Properties
When unzipped, the shapefile contains six files (*.shx, *.dbf, *.prj, *.sbn, *.sbx, and *.shp).
Parameters of the shapefile:
Geometry Type: Polygon
Geographic Coordinate System: GCS_WGS_1984
Datum: _WGS_1984
Prime Meridian: Greenwich
Angular Unit: Degree
Extent:
North: 64.301420
South: 60.649240
West: -120.729210
East: -111.178540
Attributes of the shapefile:
FID: Shapefile feature ID
Shape: Feature type
Date: Date burned
mtbs_id: Monitoring trends in burn severity index ID
fire name: Year of burn and district-fire number
JulianDay: Burned date in julian day (added to visualize in arc map)
Field Data - Burned Sites
There are five comma-separated files (.csv) of burn severity, inventory, woody seedling/sapling, soil moisture, and biophysical data collected in 2015 from selected wildfire areas.
Burn severity was measured at 30 sites located in five 2014 wildfire areas (SS3, SS82, ZF17, ZF20, and ZF46).
Seventeen sites were selected for more additional measurements which are found in the biophysical, inventory, seedling and soil moisture data files.
Note: Photos were taken at the sites (noted in three of the burned site data files) and are provided in companion files (.shp and .kmz formats). A description of the companion files is provided at the end of this section.
Table 2. Summary listing of wildfire areas, burned sites, and data types collected at each site.
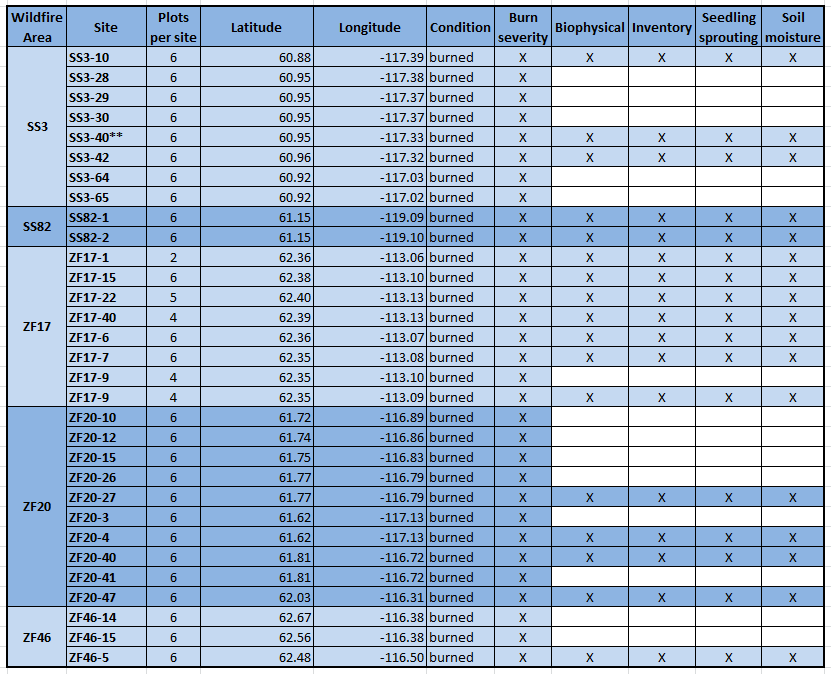
This table is also provided in *.csv format as the companion file NWT_CANADA_Wildfires_2014_generaltable.csv
**The SS3-40 site is also the field validation site SS3-40-1.
Burn Severity Data:
This file provides burn severity data collected from 30 sites located in five areas: SS3, SS82, ZF17, ZF20, and ZF46. Data not provided or not reported are recorded as -9999; data not applicable are recorded as not_applicable.
File: NWT_Wildfires_burn_severity_2015.csv
| Variable | Units | Description |
|---|---|---|
| Site_Name | Unique name given to a field site. The initial alphanumeric code indicates site and fire number and the second part of the name is a site code designated by the research team. | |
| Plot | Plot number within the site; there are up to 6 plots per site | |
| Date | YYYYMMDD | Sampling date |
| Time | HH:MM | Time at which field work began in local time (MDT) |
| Latitude | decimal degrees | Latitude of plot. Coordinates were taken with a handheld GPS unit in a plot corner |
| Longitude | decimal degrees | Longitude of plot. Coordinates were taken with a handheld GPS unit in a plot corner |
| Observer | Initials of person(s) who collected the data | |
| Ecosystem | Type of ecosystem; where the site included multiple ecosystem types they are all reported. See documentation for ecosystem characteristics. | |
| Thaw_Depth | cm | Depth of soil to frozen ground layer reported in centimeters from surface |
| Peat_Depth | cm | Thickness of organic peat soil layer reported in centimeters |
| Ash | Amount of ash present on ground surface. Reported as: No, Light, Moderate, or Heavy | |
| Moss_Unburned | percent | Percent of moss in plot (10 x 10-m area) that is unburned |
| Moss_Singed | percent | Percent of moss in plot (10 x 10-m area) that is singed |
| Moss_Light | percent | Percent of moss in plot (10 x 10-m area) that is lightly burned |
| Moss_Moderate | percent | Percent of moss in plot (10 x 10-m area) that is moderately burned |
| Moss_Severe | percent | Percent of moss in plot (10 x 10-m area) that is severely burned |
| Litter_Unburned | percent | Percent of litter in plot (10 x 10-m area) that is unburned |
| Litter_Singed | percent | Percent of litter in plot (10 x 10-m area) that is lightly singed |
| Litter_Charred | percent | Percent of litter in plot (10 x 10-m area) that is charred |
| Litter_Ashed | percent | Percent of litter in plot (10 x 10-m area) that is ashed |
| Shrub_Unburned | percent | Percent of shrubs in plot (10 x 10-m area) that is unburned |
| Shrub_Scorched | percent | Percent of shrubs in plot (10 x 10-m area) that is lightly scorched |
| Shrub_LimbsLeft | percent | Percent of shrubs in plot (10 x 10-m area) with some limbs left |
| Shrub_Consumed | percent | Percent of shrubs in plot (10 x 10-m area) that is consumed |
| Live_trees | percent | Percent of trees in plot (10 x 10-m area) live and undamaged |
| Dead_foliage_intact | percent | Percent of trees in plot (10 x 10-m area) dead but with no foliage consumed |
| Dead_foliage_burned | percent | Percent of trees in plot (10 x 10-m area) dead with needles and small branches burned |
| Dead_trees_secondary | percent | Percent of trees in plot (10 x 10-m area) dead with only some secondary branches remaining |
| Dead_trees_minor_primary | percent | Percent of trees in plot (10 x 10-m area) dead with secondary branches burned and more than 30 percent of primary branches left |
| Dead_trees_major_primary | percent | Percent of trees in plot (10 x 10-m area) dead with less than 30 percent of primary branches remaining |
| Dead_trees_charred_pole | percent | Percent of trees in plot (10 x 10-m area) dead with no primary branches and a charred pole |
| Root1_ht | cm | Height from current ground level up to first randomly selected adventitious root reported in meters |
| Root2_ht | cm | Height from current ground level up to second randomly selected adventitious root reported in meters |
| Root3_ht | cm | Height from current ground level up to third randomly selected adventitious root reported in meters |
| Root4_ht | cm | Height from current ground level up to fourth randomly selected adventitious root reported in meters |
| NadirCover_ShrubLive | percent | Percent ground cover composed of live shrubs. Nadir cover is from a birds eye view of the plot so multiple layers are not considered and thus all nadir cover values must add to no more than 100 percent |
| NadirCover_ShrubDead | percent | Percent ground cover composed of dead shrubs. Nadir cover is from a birds eye view of the plot so multiple layers are not considered and thus all nadir cover values must add to no more than 100 percent |
| NadirCover_WoodyDebris | percent | Percent ground cover composed of woody debris. Nadir cover is from a birds eye view of the plot so multiple layers are not considered and thus all nadir cover values must add to no more than 100 percent |
| NadirCover_HerbaceousLive | percent | Percent ground cover composed of live herbaceous plants. Nadir cover is from a birds eye view of the plot so multiple layers are not considered and thus all nadir cover values must add to no more than 100 percent |
| NadirCover_HerbaceousDead | percent | Percent ground cover composed of dead herbaceous plants. Nadir cover is from a birds eye view of the plot so multiple layers are not considered and thus all nadir cover values must add to no more than 100 percent |
| NadirCover_MossLive | percent | Percent ground cover composed of live moss. Nadir cover is from a birds eye view of the plot so multiple layers are not considered and thus all nadir cover values must add to no more than 100 percent |
| NadirCover_MossDead | percent | Percent ground cover composed of dead moss. Nadir cover is from a birds eye view of the plot so multiple layers are not considered and thus all nadir cover values must add to no more than 100 percent |
| Tree_ht1 | m | Height of tree 1 reported in meters |
| Tree_Condition1 | Condition of tree 1: live or dead | |
| Tree_ht2 | m | Height of tree 2 reported in meters |
| Tree_Condition2 | Condition of tree 2: live or dead | |
| Tree_ht3 | m | Height of tree 3 reported in meters |
| Tree_Condition3 | Condition of tree 3: live or dead | |
| Camera_ID | Camera name used to photograph the site. This is also the companion folder-file name where a photo would be found. Described in the companion files table at the end of this document section | |
| North_Photo | North facing photo id number | |
| East_Photo | East facing photo id number | |
| South_Photo | South facing photo id number | |
| West_Photo | West facing photo id number | |
| Nadir_Photo | Nadir facing photo id number | |
| Notes | additional comments |
Vegetation Biophysical Data:
This file provides vegetation community biophysical data collected from five sites in 2015. Data not applicable are reported as not_applicable.
File: NWT_Wildfires_Biophysical_2015.csv
| Variable | Unit | Explanation |
|---|---|---|
| Site | Unique name given to a field site. The initial alphanumeric code indicates site and fire number and the second part of the name is a site code designated by the research team. | |
| Plot | Plot number within site | |
| Plot_Size | Size of sampling plot reported in meters by meters | |
| Date | YYYYMMDD | Sampling date |
| Observer | text | Initials of person(s) who collected the information |
| Burn_Severity | Burned or no | |
| Latitude | decimal degrees | Latitude of plot. Coordinates were taken with a handheld GPS unit in a plot corner |
| Longitude | decimal degrees | Longitude of plot. Coordinates were taken with a handheld GPS unit in a plot corner |
| Time | HH:MM | Time that data collection at that location began in local time MDT (UTC-6) |
| Live_Canopy_Cover | percent | Percent of canopy (tree) cover classified as live |
| Dominant_Cover | Description of the dominant cover type. Choices included: forested; shrub; herbaceous or some combination of these cover types | |
| Ecosystem_Type | Ecosystem type(s) represented in the plot: bog; fen; lowland; upland see table for defining characteristics | |
| Ground_Wetness | Description of the soil moisture status: dry, moist, soggy, standing water, or some combination of these conditions | |
| Soil_top_moss_condition | Notes on the condition of the top layer of organic soil (moss) with respect to burning: ash, burned, singed, charred, or unburned | |
| Soil_Live_moss_thickness | cm | Thickness of the live moss component of the organic soil layer reported in centimeters |
| Soil_Dead_moss_layer_thickness | cm | Thickness of the dead moss component of the organic soil layer reported in centimeters |
| Soil_Upper_duff_layer_thickness | cm | Thickness of the upper duff component of the organic soil layer reported in centimeters |
| Soil_Lower_duff_layer_thickness | cm | Thickness of the lower duff component of the organic soil layer reported in centimeters |
| Total_Peat_depth | cm | Depth of entire peat layer calculated as the sum of the previous 4 columns reported in centimeters from surface |
| Low_Shrubs_coverage | percent | Percent of ground covered in low shrubs reported as percent of total plot area |
| Low_Shrubs_distribution | Pattern of distribution of low shrubs: reported as E (even), P (peripheral), or patchy | |
| Woody_debris_coverage | percent | Percent of ground covered in woody debris reported as percent of total plot area |
| Woody_debris_distribution | Pattern of distribution of low shrubs: reported as E (even), P (peripheral), or patchy | |
| Sphag_coverage | percent | Percent of ground covered in Sphagnum moss reported as percent of total plot area |
| Sphag_distribution | Pattern of distribution of Sphagnum moss: reported as E (even), P (peripheral), or patchy | |
| Reindeer_lichen_coverage | percent | Percent of ground covered in reindeer lichen reported as percent of total plot area |
| Reindeer_lichen_distribution | Pattern of distribution of reindeer lichen: reported as E (even), P (peripheral), or patchy | |
| Grasses_coverage | percent | Percent of ground covered in grasses reported as percent of total plot area |
| Grasses_distribution | Pattern of distribution of grasses: reported as E (even), P (peripheral), or patchy | |
| Herbaceous_coverage | percent | Percent of ground covered in herbaceous plants reported as percent of total plot area |
| Herbaceous_distribution | Pattern of distribution of herbaceous plants: reported as E (even), P (peripheral), or patchy | |
| Open_water_coverage | percent | Percent of ground covered in open water reported as percent of total plot area |
| Open_water_distribution | Pattern of distribution of open water: reported as E (even), P (peripheral), or patchy | |
| other_type | Description of other ground cover type | |
| other_coverage | percent | Percent of ground covered in other ground cover reported as percent of total plot area |
| other_distribution | Pattern of distribution of other ground cover: reported as E (even), P (peripheral), or patchy | |
| Camera_ID | Camera name used to photograph the site. This is also the companion folder-file name where a photo would be found. Described in the companion files table at the end of this document section | |
| Photo_ID_North | North facing photo id number | |
| Photo_ID_East | East facing photo id number | |
| Photo_ID_South | South facing photo id number | |
| Photo_ID_West | West facing photo id number | |
| Photo_ID_Nadir | Nadir facing photo id number | |
| Photo_other | ID number of additional photos where taken | |
| Notes | Description of additional photos or other field notes |
Soil Moisture and Temperature Data:
This file provides soil moisture and temperature data collected from five sites in 2015. Data not provided or missing are reported as -9999.
File: NWT_Wildfires_soil_moisture_2015.csv
| Variable | Unit | Explanation |
|---|---|---|
| Site | Unique name given to a field site. The initial alphanumeric code indicates site and fire number and the second part of the name is a site code designated by the research team. | |
| Plot | Plot number. Each site had up to six plots | |
| Date | YYYYMMDD | Sampling date |
| Start_Time | HH:MM | Time that data collection at that location began in local time MDT ( UTC-6) |
| Observers | Initials | Person(s) who collected data |
| Latitude | decimal degrees | Latitude of plot. Coordinates were taken with a handheld GPS unit in a plot corner |
| Longitude | decimal degrees | Longitude of plot Coordinates were taken with a handheld GPS unit in a plot corner |
| Probe_depth | cm | The depth to which the tip of the data probe was inserted |
| Probe_angle | The angle the data probe was inserted into the soil. Two different lengths of probes were used: 20 cm and 12 cm. Both probes were placed straight down into the soil. In addition at 6-cm depth, the 12-cm probe was placed at a 30- degree angle. | |
| Sampling_period | Seconds | The time in seconds taken to record the volumetric water content (VMC) |
| VWC | Percentage | Volumetric Water Content of the soil reported in percentage. Soil moisture was measured with two Campbell Scientific CS620 Hydrosense handheld probes: one 12 cm long the other 20 cm long. |
| Soil_T | Degrees Celsius | Temperature of soil reported in degrees Celsius. Soil temperature was measured at 11.5-cm depth using a Hannah Instruments HI 145 probe. Note temperatures were recorded in degrees Fahrenheit and then converted. |
Seedling and Sprouting Data:
This file provides observations of woody vegetation seedling/saplings and sprouting of mosses and lichen collected from five sites in 2015.
File: NWT_Wildfires_seedling_sprouting_2015.csv
| Variable | Unit | Explanation |
|---|---|---|
| Site | Unique name given to a field site.The initial alphanumeric code indicates site and fire number and the second part of the name is a site code designated by the research team. | |
| Plot | Plot number. Each site had up to six plots | |
| Date | YYYYMMDD | Sampling date |
| Observers | Initials of person(s) who collected data | |
| Latitude | decimal degrees | Latitude of plot. Coordinates were taken with a handheld GPS unit in a plot corner |
| Longitude | decimal degrees | Longitude of plot. Coordinates were taken with a handheld GPS unit in a plot corner |
| Species | Scientific name of vegetation species measured | |
| Veg_stage | Growth stage of vegetation: seedling or sprouting | |
| Number | Number of seedlings or sproutings recorded. For mosses and lichens where number was difficult to determine four codes were used: -1111 indicating a small patch of approximately 10 by 15 cm; -2222 indicating 20 percent of the plot area covered; -3333 indicating less than 10 percent of the plot area covered; -4444 indicating 35 percent of the plot area covered | |
| Seedbed | Seedbed type: sphagnum, unburned organic material (duff and litter), thick burned organic material, thin burned organic material, or exposed mineral soil | |
| Camara_ID | Camera name used to photograph the site. This is also the companion folder-file name where a photo would be found. Described in the companion files table at the end of this document section | |
| Photo_ID | Plot photo id number(s) |
Plot Vegetation Inventory Data:
This file provides site/plot observations, species inventory, diameter, and height data collected from five sites in 2015. Data not provided or missing are reported as -9999.
File: NWT_Wildfires_Inventory_2015.csv
| Variable | Unit | Explanation |
|---|---|---|
| Site | Unique name given to a field site. The initial alphanumeric code indicates site and fire number and the second part of the name is a site code designated by the research team. | |
| Plot | Plot number. Each site had up to six plots | |
| Date | YYYYMMDD | Sampling date |
| Observer | Initials of person(s) who collected the information | |
| Burn_severity | Burn severity classification either burned or no | |
| Plot_size | m x m | Size of sampling plot reported as meters by meters |
| Life_form | Life form: shrub or tree | |
| Condition | Stem condition either live or dead | |
| Species | Scientific name of stem measured | |
| Diameter_type | Diameter was measured at one of three locations on the trunk: dbh measured at 1.3 meters above the ground, 1 meter above the ground, and basal diameter measured at ground level | |
| Diameter | cm | Diameter reported in centimeters |
| Height | m | Height of stem reported in meters |
Field Data - Validation Sites
This file provides vegetation community characterization data collected from 43 field sites in 2015; one the sites was a burned site and five others were large unburned patches adjacent to burned sites. Data were collected at the additional SS82 and SS70 sites but were not collected the SS68 or FS33 sites.
Note: Photos were taken at the validation sites and are provided in companion files. A description of the companion files is provided at the end of this section.
Table 3. Summary listing of wildfire areas, validation sites, and data types collected at each site.
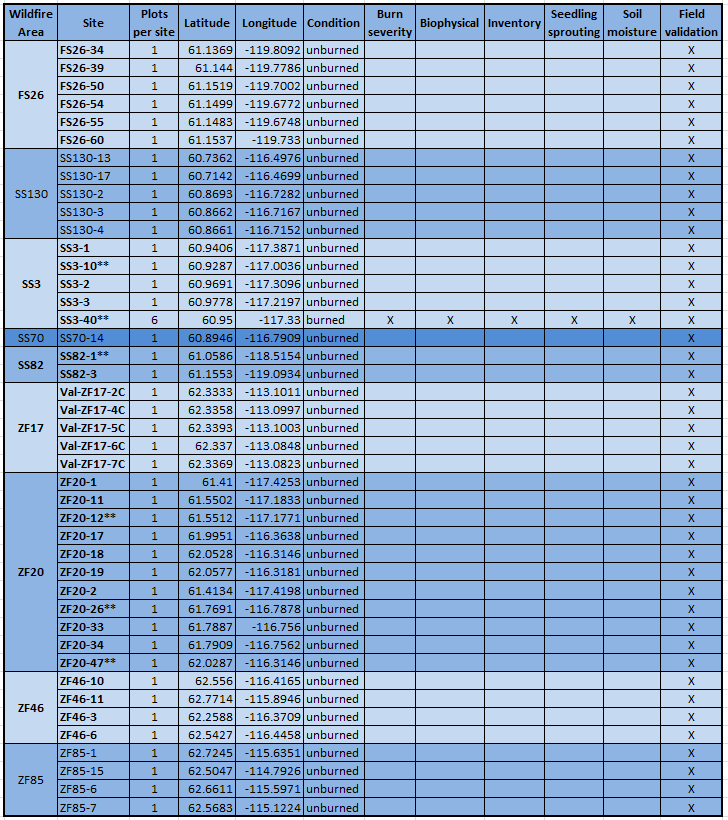
** The SS3-40 site in the field validation file corresponds to the SS3-40-1 site in the burned field data files. Five other sites are large unburned patches adjacent to burned sites and have the same site name in the burned field data files.
* This table is also provided in *.csv format as the companion file NWT_CANADA_Wildfires_2014_generaltable.csv
Vegetation Community Characterization Data:
Data not provided or not reported are recorded as -9999; data not applicable are recorded as not_applicable.
File: NWT_Wildfires_fieldvalidation_2015.csv
| Variable Name | Unit | Explanation |
|---|---|---|
| Site_Name | Unique name given to a field point | |
| Date | YYYYMMDD | Sampling date |
| Time | HH:MM | Time at which field work began in local time (MDT) |
| Latitude | decimal degrees | Latitude of plot. Coordinates were taken with a handheld GPS unit in a plot corner |
| Longitude | decimal degrees | Longitude of plot. Coordinates were taken with a handheld GPS unit in a plot corner |
| Observers | Text | Initials of person(s) who collected data |
| Thaw_depth | cm | Depth of soil to frozen ground layer reported in centimeters. Measurements were made from the top of the ground cover at the 37 unburned sites. |
| Peat_Depth | cm | Depth of organic peat soil reported in centimeters |
| Soil_pH | pH units | |
| Ecosystem | Type of ecosystem, individually or in combination; Bog/Bog Like, Fen/Fen Like, Treed Bog, Shrub Fen, Treed Fen, Open Fen, Upland, Marsh, Shrubby, Sparse Trees, Lowland White Pine | |
| Ground_Wetness | Wetness of ground: Dry (no moisture present), Moist (moisture present but not saturated), Soggy (saturated with water but no areas of standing water), or Standing Water (visible standing water present in plot) | |
| Vegetation | List of vegetation species present | |
| Dense_trees | percent | Percent of plot covered in dense trees. Plot areas were 0.5 acre |
| Dense_trees_dist | Description of dense tree distribution: E (evenly distributed), C (center only), and P (peripheral) | |
| Moderate_trees | percent | Percent of plot covered in moderate trees. Plot areas were 0.5 acre |
| Moderate_trees_dist | Description of moderate tree distribution: E (evenly distributed), C (center only), and P (peripheral) | |
| Sparse_trees | percent | Percent of plot covered in sparse trees. Plot areas were 0.5 acre |
| Sparse_trees_dist | Description of sparse tree distribution: E (evenly distributed), C (center only), and P (peripheral) | |
| Open_water | percent | Percent of plot covered in open water. Plot areas were 0.5 acre |
| Open_water_dist | Description of open water distribution: E (evenly distributed), C (center only), and P (peripheral) | |
| Shrubby | percent | Percent of plot covered in shrubs. Plot areas were 0.5 acre |
| Shrubby_dist | Description of shrub distribution: E (evenly distributed), C (center only), and P (peripheral) | |
| Moss | percent | Percent of plot covered in moss. Plot areas were 0.5 acre |
| Moss_dist | Description of moss distribution: E (evenly distributed), C (center only), and P (peripheral) | |
| Grass_sedge | percent | Percent of plot covered in grass/sedge. Plot areas were 0.5 acre |
| Grass_sedge_dist | Description of grass/sedge distribution: E (evenly distributed), C (center only), and P (peripheral) | |
| Other_descrip | Description of other vegetation cover | |
| Other | percent | Percent of plot covered in other vegetation. Plot area is 0.5 acre |
| Other_dist | Description of other vegetation distribution: E (evenly distributed), C (center only), and P (peripheral) | |
| Dom_spp1 | genus_species | Scientific name of dominant species ( grasses and sedges not identified to species) |
| Live_ht_spp1 | m | Average height of live dominant species 1 |
| Dead_ht_spp1 | m | Average height of dead dominant species 1 |
| Density_spp1 | percent | Percent of area covered by dominant species 1 |
| Live_spp1 | percent | Percent of dominant species 1 live (by area) |
| Dead_spp1 | percent | Percent of dominant species 1 dead (by area) |
| Stage_spp1 | Growth Stage for dominant species: dormant, emerging, seedling, immature, mature, flowering | |
| Dom_spp2 | genus_species | Scientific name of dominant species ( grasses and sedges not identified to species) |
| Live_ht_spp2 | m | Average height of live dominant species 2 |
| Dead_ht_spp2 | m | Average height of dead dominant species 2 |
| Density_spp2 | percent | Percent of area covered by dominant species 2 |
| Live_spp2 | percent | Percent of dominant species 2 live (by area) |
| Dead_spp2 | percent | Percent of dominant species 2 dead (by area) |
| Stage_spp2 | Growth Stage for dominant species: dormant, emerging, seedling, immature, mature, flowering | |
| Lowest_ branch_ht | m | Height of average lowest living branch reported in meters |
| Soil_live_moss | cm | Depth of live moss layer present in 40-cm soil profile |
| Soil_dead_moss | cm | Depth of dead moss layer present in 40-cm soil profile |
| Soil_upper_duff | cm | Depth of upper duff layer present in 40-cm soil profile |
| Soil_ lower_duff | cm | Depth of lower duff layer present in 40-cm soil profile |
| Camera_ID | Camera name used to photograph the site- this is also the companion folder-file name where a photo would be found. Described in the companion files table at the end of this document section | |
| North_Photo | North facing photo id number | North facing photo id number |
| East_Photo | East facing photo id number | East facing photo id number |
| South_Photo | South facing photo id number | South facing photo id number |
| West_Photo | West facing photo id number | West facing photo id number |
| Nadir_Photo | Nadir facing photo id number | Nadir facing photo id number |
| Notes |
Companion Files
- NWT_CANADA_Wildfires_2014_generaltable.csv: A summary of site names, plots, latitude, longitude, site condition, and variables measured at each site
- Wildfires_2014_NWT_Canada.pdf: This document in pdf format
- 2014_NWT_fireprogression.kmz: The shapefile 2014_NWT_fireprogression.shp provided in .kmz format for visualization in Google Earth
Site Photograph Companion Files
Photographs were taken at many of the sites; they were numbered, and are contained in five folders. The folder names correspond to the camera used to take the photo, called Camera_ID in the data files. Different cameras were not used for each site so the Camera_ID does not correspond to particular sites. Also, the photo numbers in the first two folders below overlap, however, the sites are provided in the data files so each photo number and camera ID correspond to a site in each particular file. See the example provided at the end of this section.
Folder names (also Camera_ID name) and photo numbers:
- june_1326: contains photos numbered 52-885
- june_1327: contains photos numbered 3-384
- june_eastern: contains photos numbered 5727-5817
- july_1326: contains photos numbered 959-1341
- july_eastern: contains photos numbered 5896-5985
Each folder contains the following files (named with the folder name):
- The photos provided in*.kmz format for visualization in Google Earth
- A zip file with the photos in *.jpg format
- A zip file which contains a shapefile (*.shp) of the field of view of the photo
- A zip file which contains a shapefile (*.shp) of the locations of the photos.
Example folder and file names in the folder:
Folder june_eastern (photos numbered 5727-5817) contains:
- june_eastern.kmz: photos provided for visualization in Google Earth
- june_eastern_photos.zip: photos in .jpg format
- june_eastern_field_of_view.zip: zipped shapefile contains polygon representations of the field of views of the photos with ID’s numbered 5727-5817
- june_eastern_photo_locations.zip: zipped shapefile contains point locations of the photos with ID’s numbered 5727-5817
Data files with photos include:
- NWT_Wildfires_Biophysical_2015.csv
- NWT_Wildfires_seedling_sprouting_2015.csv
- NWT_Wildfires_fieldvalidation_2015.csv
- NWT_Wildfires_burn_severity_2015.csv
Example data file content showing Camera_ID and Photo_ID: NWT_Wildfires_seedling_sprouting_2015.csv
| Site | Plot | Date | Latitude | Longitude | Observers | Species | Condition | Number | Seedbed | Camera_ID | Photo_ID |
| SS3-10 | 1 | 20150605 | 60.87818 | -117.394 | MB | Populus balsamifera | Seedling | 1 | Burned Thick | june_1326 | 129 |
Application and Derivation
The goal was to identify and collect remote sensing and field data to support the science necessary to investigate the impacts and consequences of the 2014 fires in Northwest Territories.
Quality Assessment
The overall accuracy for all peatland type maps was 90.8%. Twenty percent of supervised training data were reserved for the validation assessment.
The total accuracy for the ZF20/ZF85/ZF46 maps was 92%, ZF17 86%, SS68 88%, SS03/SS130 91%, and FS33/FS26 was 94%.
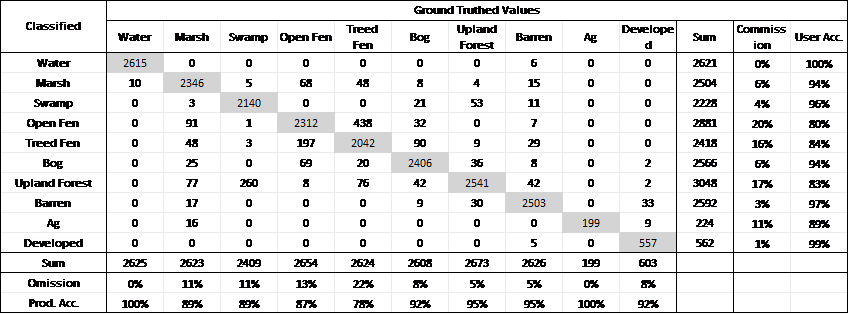
Figure 2. Combined overall accuracy for Northwest Territories peatland type maps.
Data Acquisition, Materials, and Methods
Study areas
This project used remote sensing and field data to characterize the impacts of wildfires that occurred in 2014 in the North Slave, South Slave, and Dehcho Regions of Northwest Territories, Canada. The main focus areas were nine 2014 wildfires: FS33, FS26, SS03, SS130, SS68, ZF17, ZF20, ZF85, and ZF46. Additional fires (because of proximity) included SS33 (partial), SS15, SS70, SS97, SS81, SS82, SS152, SS96, FS49, ZF126, ZF143, ZF124, ZF92 (partial), and ZF45 (partial). The ABoVE Project grid locations of these study areas are Ah2v1.Bh0v5, Ah2v1.Bh1v4, Ah2v1.Bh1v5, Ah2v1.Bh2v5, and Ah2v2.Bh0v0. For additional information, refer the ABoVE Grid Reference: https://above.maps.arcgis.com/home/item.html?id=ad3dc7c0ecef41bb8e2d928ce2ed7a48
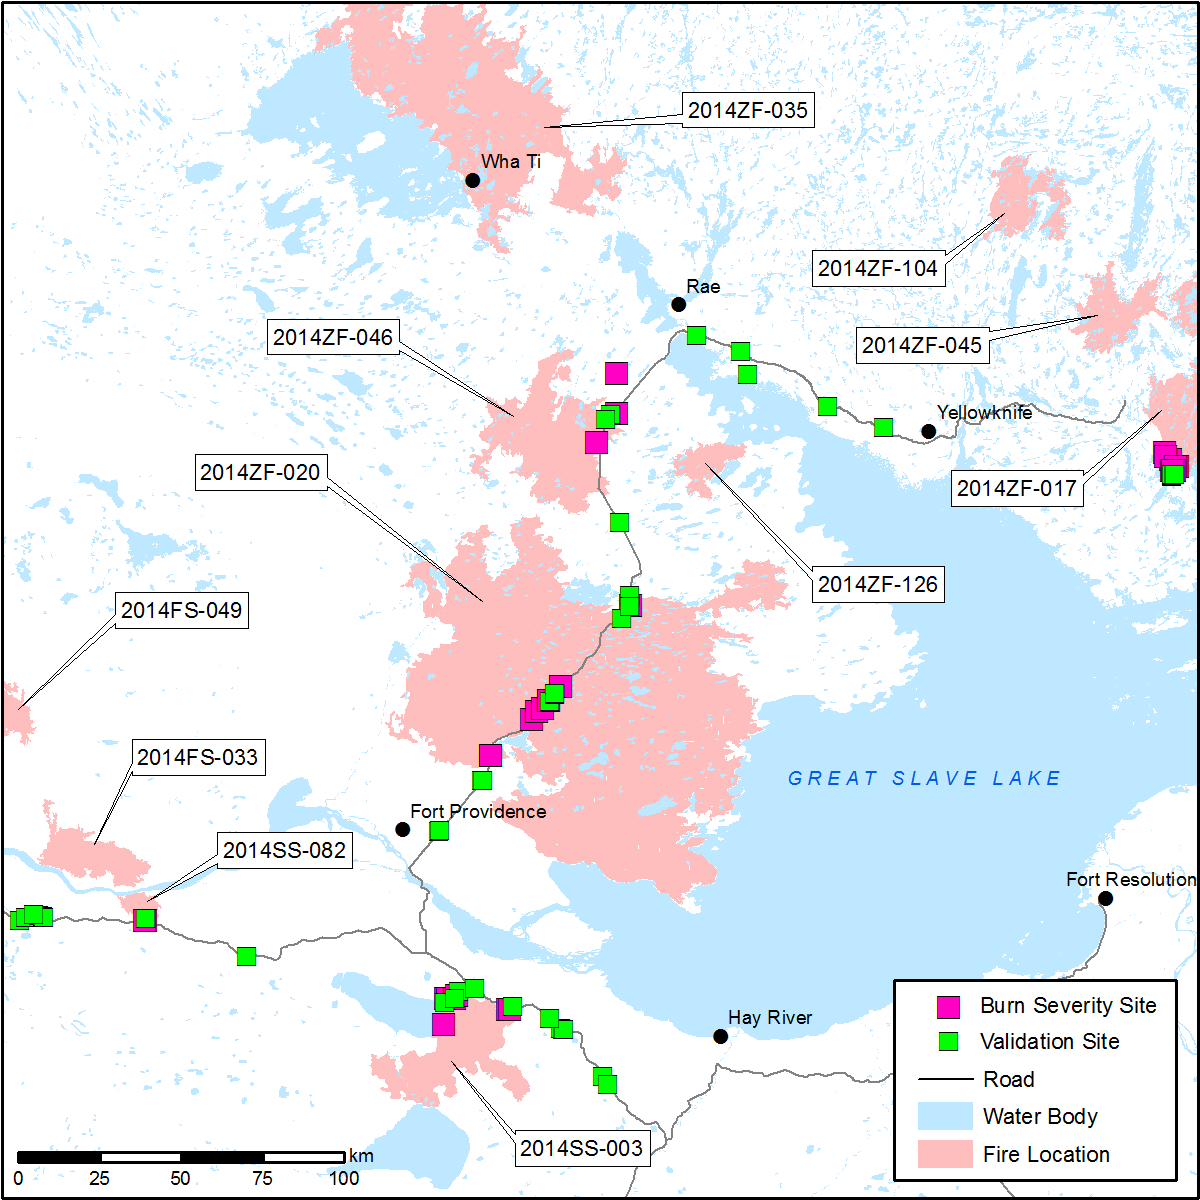
Figure 3. Wildfire areas (from 2014_NWT_fireprogression.shp) with burned and validation field site locations (from NWT_CANADA_Wildfires_2014_generaltable.csv) in the Northwest Territories.
Peatland Type Mapping
The peatland classification (bog, fen, marsh, swamp) and level of biomass (open, forested) at each site was based on a pre-burn multi-date, multi-sensor fusion (Optical and L-band SAR) approach. A Random Forest classifier was used to generate a group of independent classification trees and the pixel class was determined by a majority vote of the trees. This classifier is a machine learning algorithm that takes advantage of an ensemble of classifiers that are built using training data. The training data were created through aerial photo interpretation combined with field data.
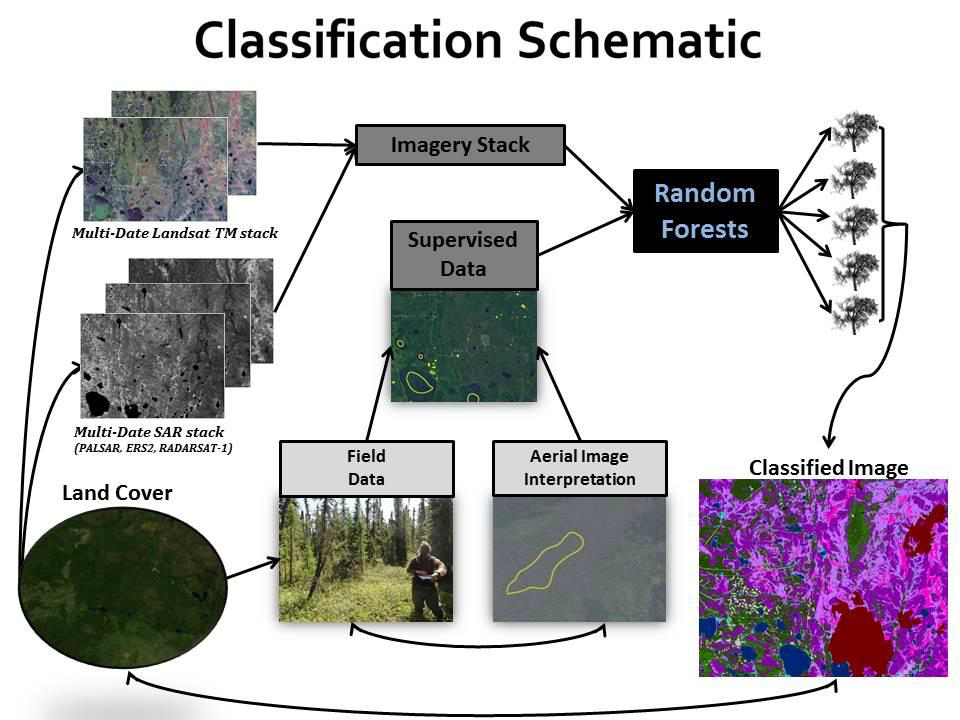
Figure 4. Classification schematic showing the mapping methodology from field data, aerial image interpretation, and imagery to classified map with a table of class id information.
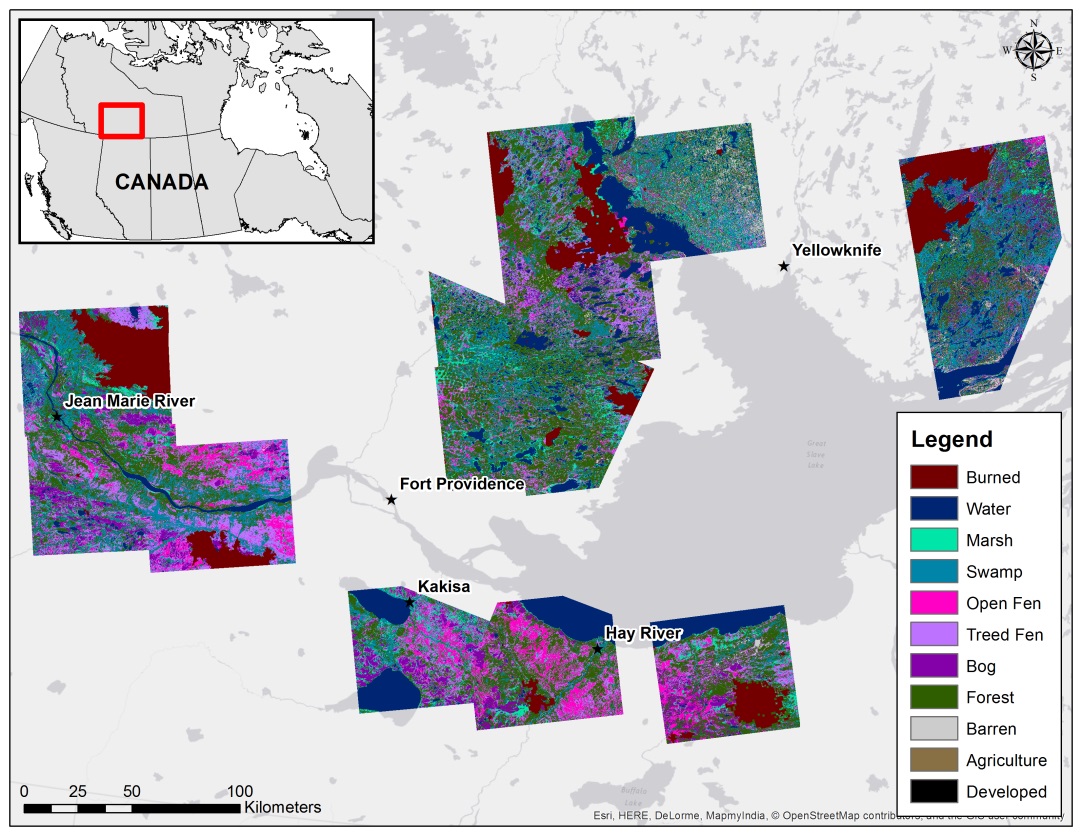
Figure 5. Peatland classification maps of the wildfire study areas in the Northwest Territories. Figure includes maps from all five peatland type landcover data files provided with the data set.
Peatland Type Validation
A total of 43 field locations were sampled in NWT, Canada to validate the peatland type maps. Field points were selected based on map classes. Of these 43 locations, one was a burned site (SS3-40) and five other locations represent measurements taken in large unburned patches adjacent to burned sites with the same name in other field data files. Data collections followed a standardized protocol. Field crews used a hand held GPS, a GPS camera, maps of aerial photographs, and tape measures. At each location, a vegetative index was constructed, ecosystem type was assigned, species diversity noted, dominant species composition assigned, water level measured, vegetation life stage recorded, and height and density measured for the overstory. Thaw depth was measured with a peat rod from the top of the moss to the frozen layer. Additionally, hand drawn maps and delineation of laminated aerial photograph maps distinguished unique vegetation types and species transition areas. Geolocated photographs were taken in the four cardinal directions at a centralized location providing an additional layer of validation and ground truth for each location.
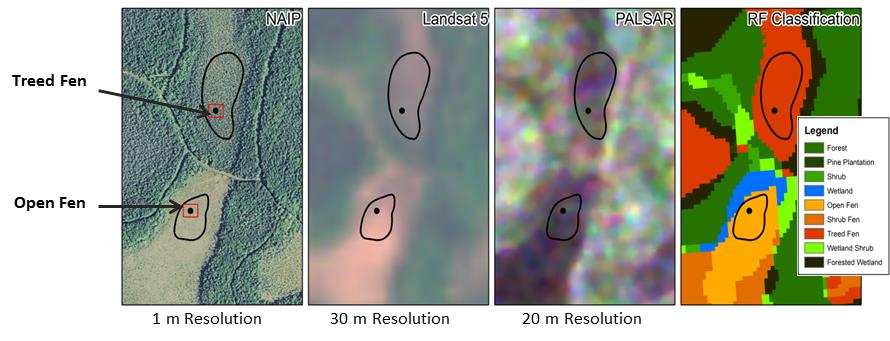
Figure 6. Field validation sampling plot in relation to the 30-m resolution Landsat, 20-m resolution SAR and the output map product. The red box shows a field-measured 40 x 50-m plot. The black dot is the center of the plot. Black outline polygons are air photo interpreted areas for training data in the classifier.
Fire Progression Maps
A fire progression algorithm was used that enabled an assessment of wildfire progression rates at a daily time scale. This algorithm was developed as a semi-automated approach suitable for developing daily estimates of area burned from satellite observations of fire occurrence. Fire progression was based on observed active fire detections from both the Terra and Aqua satellites using the MODIS active fire product (MCD14ML; Giglio et al., 2003). Fire progression was assessed at a daily time step and was based on the first observation of fire occurrence in a particular MODIS 1-km pixel within a burn scar. The algorithm was focused on modeling the approximate date of burning within the combined burned area product using the date/time information contained in the MODIS active fire product and adjusted for the local standard time correction.
Active fire detections were first processed using the Fire Spread Reconstruction (FSR) approach, which clusters individual fire points in space-time to identify contiguous fire events and groups of fire events creating a single burn scar (Loboda and Csiszar 2007). The clustered fire events were subsequently processed to separate the first date of fire detection within a specific MODIS pixel from subsequent detections, wherein the pixel continues to emit a sufficient amount of thermal energy to warrant the detection of on-going burning. The date of burning between adjacent dates of fire detections in fire progression surfaces was interpolated using the inverse distance mapping algorithm with a radius of 3 km.
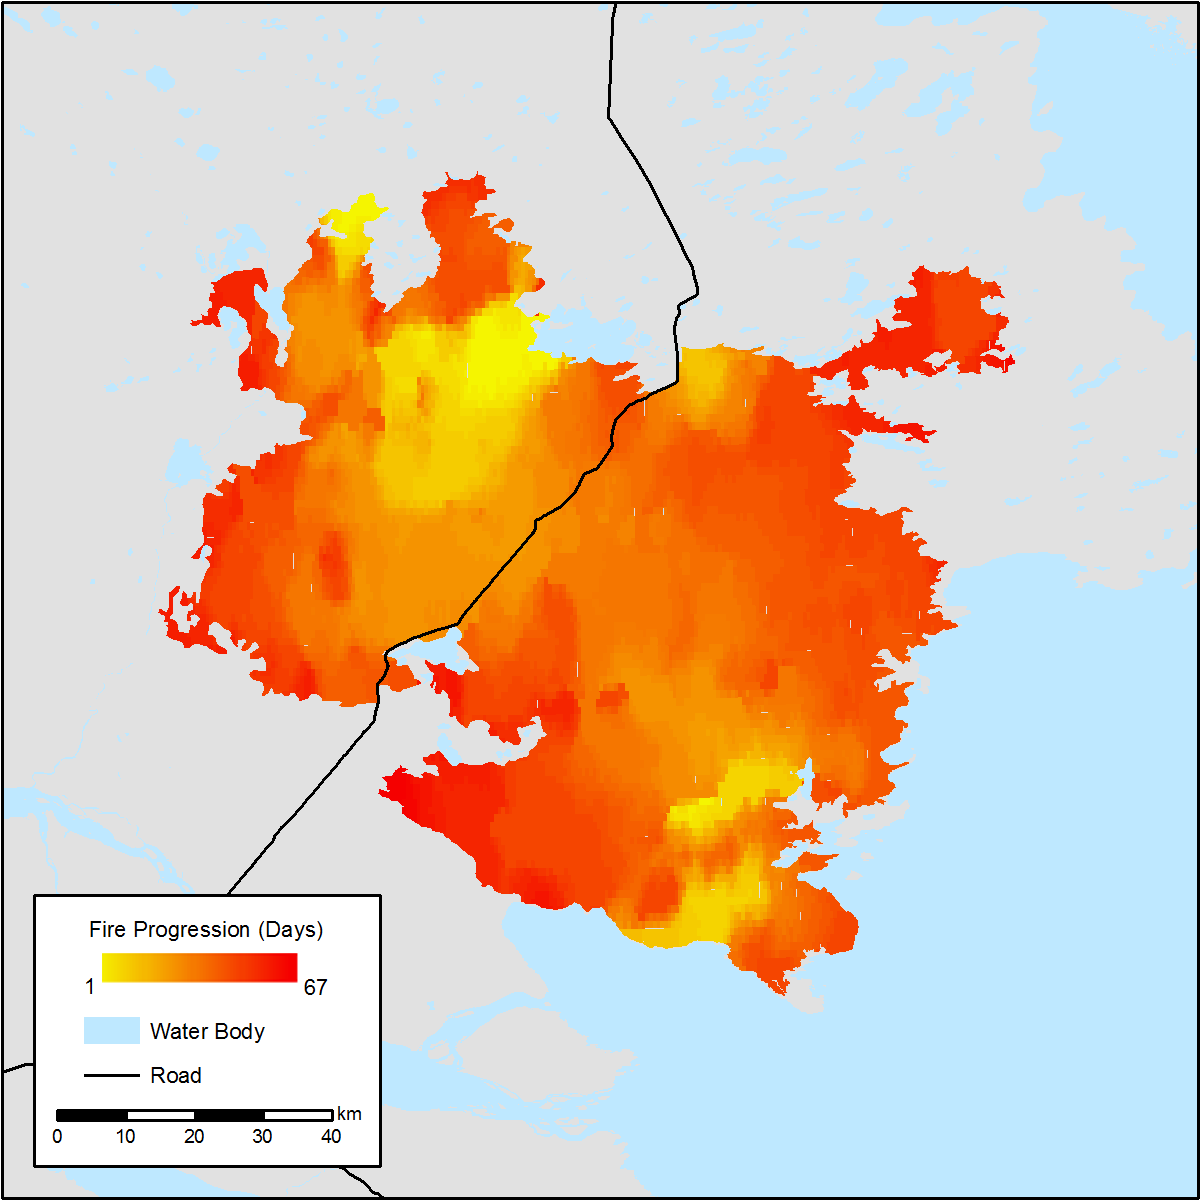
Figure 7. Fire progression of a 2014 wildfire at area ZF-020 (refer to Figure 3 for area location).
Field Data
Above ground biomass, biophysical site characteristics, burn severity, soil moisture, thaw depth, and woody seedling/sapling data were collected in six plots along two transects representing each 1-ha site.
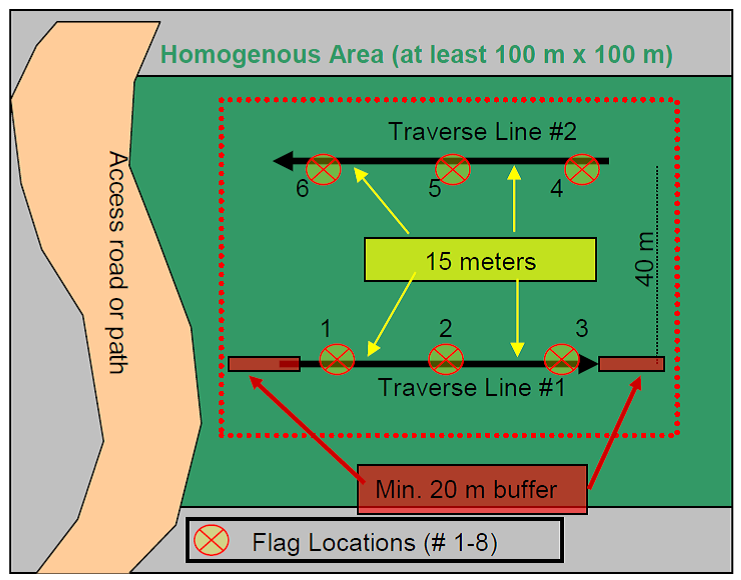
Figure 8. Plot set-up of homogeneous area of 100-m by 100-m with two transects of three plots for field sampling.
Burn Severity
A total of 30 sites were sampled. A 10-m x 10-m plot was created using reel tape. Burn damage severity class was recorded for moss, litter, shrub and canopy. Nadir percent cover by vegetation class was recorded for live/dead shrubs, woody debris, herbaceous, and moss. Three representative tree heights were recorded and up to four adventitious root heights were recorded. Peatland type, thaw depth, and peat thickness as well as ash presence are also reported for all plots.
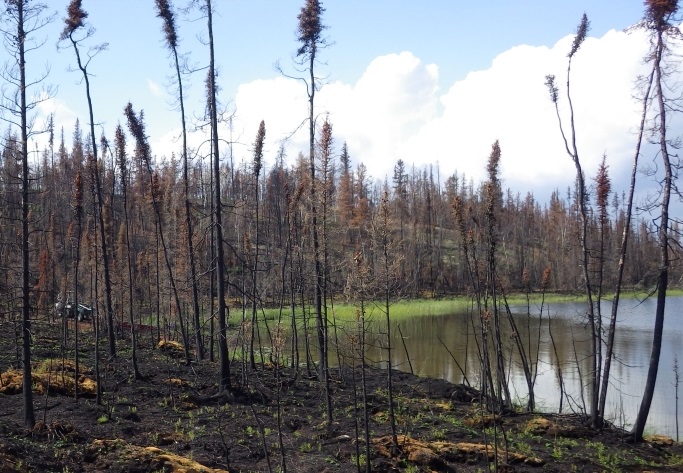
Figure 9. Photo of a burned site in area ZF-17 (refer to Figure 3 for area location).
Biophysical Characteristics
At the same 17 sites where aboveground biomass was measured, field surveys noted peatland type, wetness, thaw depth, soil organic layer thicknesses and the type of ground cover present as well as area covered by each ground cover type. In addition five field photos were taken for each site and photo identifications were recorded.
Soil Moisture
A total of 17 sites were sampled. Five measurements were made at each depth for each plot.
Soil moisture data were collected with a Campbell Scientific CS620 Hydrosense handheld probe. Temperature was measured using a Hannah Instruments HI 145 probe. Two different lengths of probes were used: 20 cm and 12 cm. Both probes were placed straight down into the soil. In addition at 6-cm depth, the 12-cm probe was placed at a 30- degree angle. The probe period and %VWC were collected at two to six points within each plot. For validation of remote sensing data, the moisture data were collected during Radarsat-2 overpasses.
Woody Seedling/Sprouting
A total of 17 sites were sampled. A 1-m x 1-m plot was set up in the corner of each site, where all woody seedling and sprouting vegetation was recorded along with the ground cover type. A nadir photo was also taken of the plot.
Inventory-Aboveground Biomass
A total of 17 sites were sampled. At each site a plot was taped off (varying in size between 5-m by 5-m and 10-m by 10-m) and each standing tree/shrub was measured. The tree/shrub species and DBH or basal diameter was recorded along with the height of at least five representative trees.
Data Access
This data is available through the Oak Ridge National Laboratory (ORNL) Distributed Active Archive Center (DAAC).
ABoVE: Burn Severity, Fire Progression, Landcover and Field Data, NWT, Canada, 2014
Contact for Data Center Access Information:
- E-mail: uso@daac.ornl.gov
- Telephone: +1 (865) 241-3952
References
Giglio, L., Descloitres, J., Justice, C.O., and Y.J. Kaufman (2003) “An Enhanced Contextual Fire Detection Algorithm for MODIS.” Remote Sensing of Environment 87, no. 2-3, 276-282.
Loboda TV, Csiszar IA (2007) Reconstruction of fire spread within wildland fire events in Northern Eurasia from the MODIS active fire product. Global and Planetary Change 56, 258–273.