Documentation Revision Date: 2019-06-18
Dataset Version: 1
Summary
The approach used a nominal peak greenness period, July 1 to August 31, to accommodate tundra of all regions for Landsat data selection. This peak-greenness period was expected to be representative of the forest zone as well, which has a longer greenness period. Only terrain-corrected scenes were considered, and scenes were excluded that had cloud cover more than 80%. As a result, a total of 87,762 Landsat scenes over 1,271 Path/Row locations were selected from 1984–2012 to develop the 30-m pixel NDVI time series.
There are 1,020 data files in GeoTIFF (.tif) format with this data set. The files provide the NDVI trend and NDVI trend significance in the ABoVE 30-m reference grid system for tiles across Alaska and Canada.
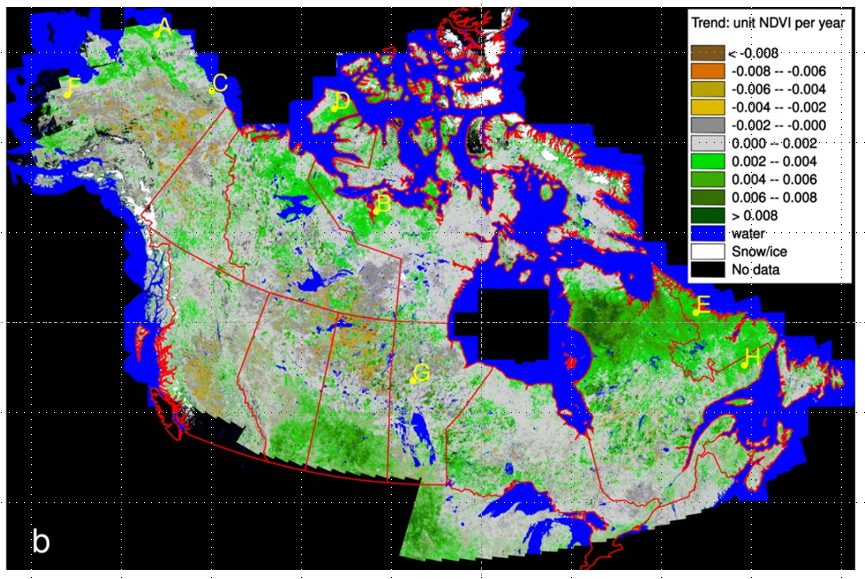
Figure 1: NDVI trends derived from 30-m Landsat NDVI times series for 1984-2012 for Canada and Alaska (Ju and Masek, 2016).
Citation
Ju, J., and J.G. Masek. 2018. ABoVE: NDVI Trends across Alaska and Canada from Landsat, 1984-2012. ORNL DAAC, Oak Ridge, Tennessee, USA. https://doi.org/10.3334/ORNLDAAC/1576
Table of Contents
- Dataset Overview
- Data Characteristics
- Application and Derivation
- Quality Assessment
- Data Acquisition, Materials, and Methods
- Data Access
- References
Dataset Overview
This dataset provides the summer NDVI trend and trend significance for the period 1984-2012 over Alaska and Canada. The NDVI were calculated per-pixel from all available peak-summer 30-m Landsat 5 and 7 surface reflectance data for the period. NDVI time series were assembled for each 30-m land location (i.e., non-water, non-snow), from observations that were unaffected by clouds as indicated by data-quality masks and following additional processing to remove anomalous NDVI values. A simple linear regression via ordinary least squares was applied to the per-pixel NDVI time series. The slope of the regression was taken as the annual NDVI trend (unit NDVI change per year) and is reported in the "trend" data files. A Student's t-test was used to assess the significance of the trend and the per-pixel significance is reported in the "trend_sig" data files. A significant positive slope indicates a greening trend, and a significant negative slope indicates a browning trend.
Project: Arctic-Boreal Vulnerability Experiment
The Arctic-Boreal Vulnerability Experiment (ABoVE) is a NASA Terrestrial Ecology Program field campaign based in Alaska and western Canada between 2016 and 2021. Research for ABoVE links field-based, process-level studies with geospatial data products derived from airborne and satellite sensors, providing a foundation for improving the analysis and modeling capabilities needed to understand and predict ecosystem responses and societal implications.
Related Publication:
Ju, Junchang, and J.G. Masek. 2016. The vegetation greenness trend in Canada and US Alaska from 1984–2012 Landsat data. Remote Sensing of Environment, (176), 1-6. https://doi.org/10.1016/j.rse.2016.01.001
Acknowledgement:
This research was supported by the NASA Terrestrial Ecology program, grant number NNG11HP16A.
Data Characteristics
Spatial Coverage: ABoVE domain in Alaska and Canada
ABoVE Reference Locations:
Domain: Core ABoVE
State/territory: Alaska and Canada
Grid cell(s): The data files provide data in the A grid cells Ah000v000-Ah005v003, and the B grid cells Bh001v004-Bh034v019
Spatial Resolution: 30 m
Temporal Coverage: 1984-01-01 to 2012-12-31
Temporal Resolution: One time estimate of NDVI trend
Study Area (coordinates in decimal degrees)
|
Site |
Westernmost Longitude |
Easternmost Longitude |
Northernmost Latitude |
Southernmost Latitude |
|---|---|---|---|---|
| Alaska and Canada | -169.9658333 | -50.16944444 | 80.50833333 | 41.61 |
Data File Information
There are 1,020 GeoTIFF (.tif) files in this dataset. The data are provided in the ABoVE 30-m reference grid system (Loboda et al., 2017)
File naming convention:
The file names include the ABoVE grid tiles for each data type: trend or trend_sig.
ABoVE_NDVI_trend_AXXXXXXXX_BYYYYYYYY.tif
ABoVE_NDVI_trend_sig_ AXXXXXXXX_BYYYYYYYY.tif
Where: AXXXXXXXX_BYYYYYYYY indicates the ABoVE grid tile
Example file names:
ABoVE_NDVI_trend_Ah000v000_Bh001v004.tif
ABoVE_NDVI_trend_sig_Ah000v000_Bh001v004.tif
Data Properties and Attributes
NDVI_trend
The NDVI_trend_*.tif files contain the derived annual NDVI trends (unit NDVI change per year). The per-pixel trend values may range between -0.009 to +0.009. Values outside of this range after the scale factor (0.0001) is applied are considered invalid. A significant positive slope indicates a greening trend, and a significant negative slope indicates a browning trend. See Figure 1.
File Attributes:
| The values have a scale factor of 0.0001 |
| Values of 10000 indicate water; 10001 indicates snow/ice |
| The no data value is -10000 |
| Map units are in meters |
| Native datatype = Int16 |
| Projection = Canada Albers Equal Area Projection, EPSG code 102001 |
NDVI_trend_sig
The NDVI_trend_sig_*.tif files contain the results of the Student's t-test to assess the significance of the trend of the per-pixel NDVI trend. A significant positive slope indicates a greening trend, and a significant negative slope indicates a browning trend. See Figure 4.
The trend significance is coded as a categorical variable with following values and descriptions.
| Value | Description |
|---|---|
| -4 | p < 0.001 (negative trend) |
| -3 | p < 0.010 (negative trend) |
| -2 | p < 0.025 (negative trend) |
| -1 | p < 0.050 (negative trend) |
| 0 | not significant |
| 1 | p < 0.050 (positive trend) |
| 2 | p < 0.025 (positive trend) |
| 3 | p < 0.010 (positive trend) |
| 4 | p < 0.001 (positive trend) |
File Attributes:
| No scale factor is applied. |
| Values of 10000 indicate water; 10001 indicates snow/ice |
| The no data value is -10000 |
| Map units are in meters |
| Native datatype = Int16 |
| Projection = Canada Albers Equal Area Projection, EPSG code 102001 |
Application and Derivation
These Landsat-derived NDVI data could be useful to climate change studies in assessing the North American high-latitude vegetation response to climate change.
Quality Assessment
For comparison, the same regression method was applied to the most recent GIMMS NDVI3g time series (Pinzon and Tucker, 2014) of the same period, 1984–2012. The GIMMS NDVI3g data are available bimonthly with a pixel size of 1/12 degrees (roughly 8 km at equator). Unlike with Landsat data, valid NDVI3g time series are available for nearly all pixels. At the continental scale, the Landsat NDVI trends were broadly similar to those derived from the GIMMS AVHRR NDVI3g dataset. However, the geographic patterns of the greenness trend do not always align between the two data sources for the tundra and the boreal forest zones. For the boreal forests of western Alaska, our Landsat analysis indicated no statistically significant trend, but the GIMMS AVHRR NDVI3g analysis indicated a significant negative trend.
The differences between Landsat and AVHRR results underscore the importance of further investigation on the properties of these two datasets. Our Landsat analysis for Alaska suffers to some extent from data deficiency, but Landsat data, where available, provide not only finer-resolution observations, but also spatially more complete coverage, as the signal in the GIMMS AVHRR NDVI comes from an area that comprises only 7% of the pixel size (Ju and Masek, 2016).
Data Acquisition, Materials, and Methods
Site description
The study area consisted of all of Alaska and Canada (exclusive of the Aleutian Islands). The land cover type map based on circa-2000 Landsat data is shown in Figure 2. The land cover type map for the region was created by harmonizing and mosaicking land cover datasets from three sources: land cover of northern Canada by Canadian Centre for Remote Sensing (CCRS) (URL1, Northern Canada land cover), land cover of forested area of Canada by Canadian Forest Service (URL2, Canadian forest land cover), and National Land Cover Data of Alaska by the United States USGS (URL3, Alaska land cover). As temperature exerts the primary control of vegetation distribution in this region, vegetation abundance increases generally from north to south. The Canadian Arctic is mostly barren or sparsely vegetated. Graminoid-dominated tundra extends along the northern parts of Alaska, Yukon, Northwest Territories, Manitoba, Ontario, and around the main water body of Hudson Bay to northern Quebec. Further south, tall-shrub-dominated tundra exists as a transitional ecosystem with the boreal forests to its south. Extensive wetlands of graminoids and forests are present south of Hudson Bay between the tundra and forest zones. South of the forest zone is potentially the prairie zone, which was largely converted to farmland during the past few centuries (Ju and Masek, 2016).
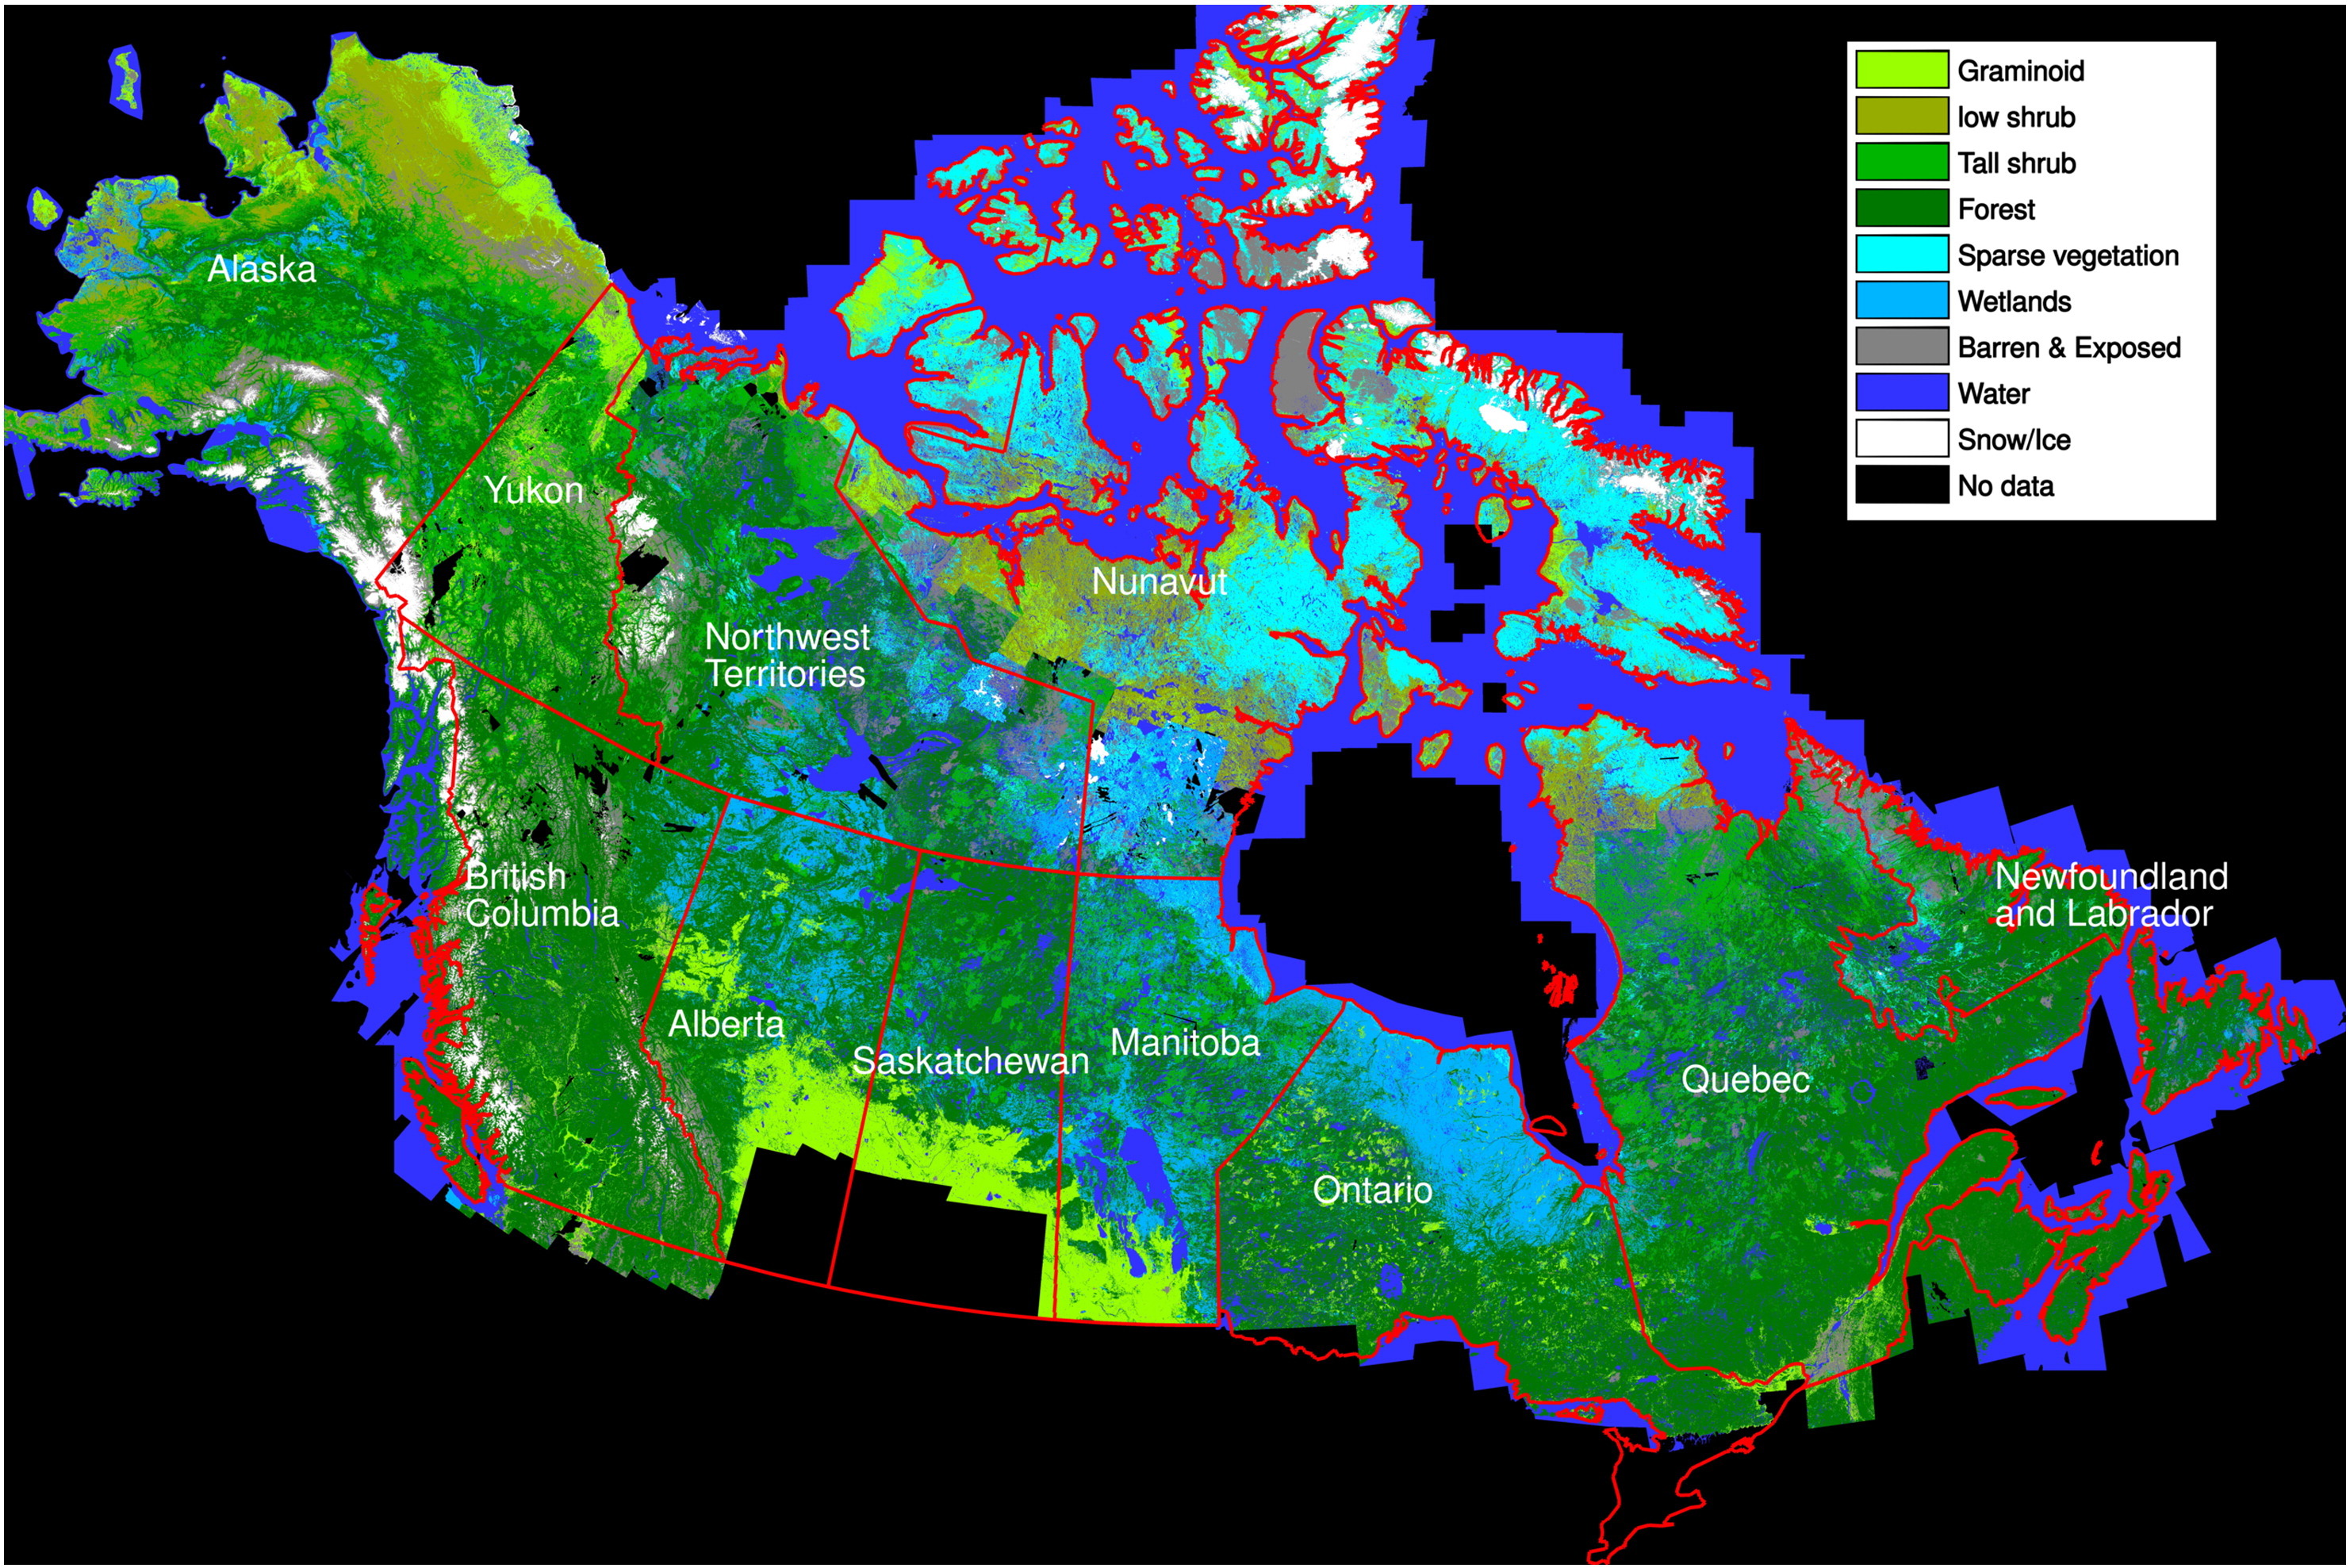
Figure 2. Land cover type map of Canada and Alaska (Ju and Masek, 2016).
Landsat data
This research used a nominal peak greenness period, July 1 to August 31, to accommodate tundra of all regions for Landsat data selection. This peak-greenness period was expected to be representative of the forest zone as well, which has a longer greenness period. As precise geolocation is critical for trend analysis, we only considered the terrain-corrected scenes (i.e. L1T scenes as indicated in the metadata MTL files). Additionally, to ensure the geolocation quality of the L1T scenes, L1T scenes were excluded that had cloud cover more than 80%, as high cloud cover can reduce the number of available ground control points and therefore the geolocation accuracy.
As a result, a total of 87,762 Landsat scenes over 1,271 Path/Row locations were selected from 1984–2012. Of these, 63% were from Landsat-5, as Landsat-5 provided the only data source for 1984–1998 and continued to acquire data until 2011. Having two satellites in orbit concurrently (1999–2011) nearly doubled the number of usable scenes.
Landsat surface reflectance data for the selected scenes were provided on demand by the USGS Earth Resources Observation and Science (EROS) Science Processing Architecture (ESPA) running the LEDAPS atmospheric correction code (Masek et al., 2006). Ancillary cloud mask, cloud shadow mask, adjacent cloud mask, snow mask, and water mask produced by LEDAPS are available for data quality assessment (QA). An additional QA mask identifying water, cloud, cloud shadow, and snow is included in the ESPA surface reflectance product and was used in conjunction with the LEDAPS masks in this study.
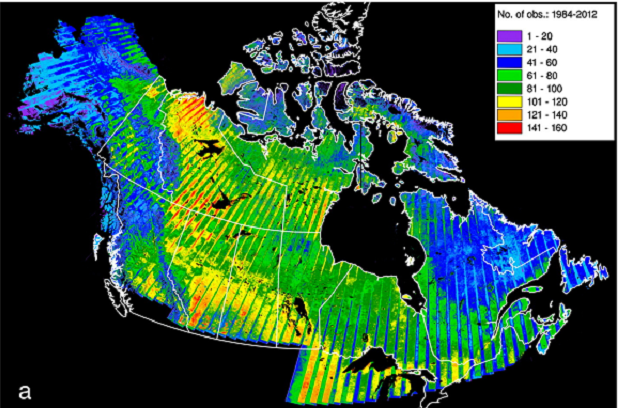
Figure 3. The number of valid NDVI observations at the pixel level (Ju and Masek, 2016).
Figure 3 illustrates the number of valid NDVI observations at the pixel level. The Canadian Arctic islands and Alaska had a smaller number of valid observations, probably due to persistent cloudiness, and (for Alaska) also due to data limitations when Landsat-5 was the only satellite available. The small number of, and even no, valid observations for mountain ridges of Alaska and western Canada were due to the exclusion of snow and ice from trend analysis. The number of valid observations in northeastern Canada area was also small, at approximately 45 for the 29-year period, but enough Landsat-5 observations were available before 1999 to make valid NDVI time series and so there was little gap in derived trend map. High numbers of observations were available east of the Rocky Mountains, with up to 160 observations for some high-latitude locations during the study period.
NDVI trend derivation
The NDVI were calculated per-pixel. Landsat NDVI time series were assembled for each 30-m land (i.e., non-water, non-snow) location, from observations that were unaffected by clouds as indicated by the data-quality masks. The NDVI values in the time series for each location were also examined as a whole. For three consecutive NDVI values that were within a 3-year window, if the second NDVI was lower than both of the other two by more than an arbitrary value (0.3), it was discarded. This test can remove some of the low NDVI values due to undetected snow, cloud, or cloud shadow, but is much less likely to remove those low NDVI values due to real, abrupt surface changes such as fires, since post-fire greenness recovery usually takes a much longer time. For the derived NDVI trend to be representative of the entire study period for a location, the years of NDVI should ideally be uniformly distributed over the study period. Out of this consideration, the study period, 1984–2012, was divided into 3 segments, and a valid time series needed to have at least two valid observations in each segment; otherwise, an NDVI trend would not be derived. This requirement created some data gaps in the final trend results, particularly for Alaska and northern Canada, due to the limited data coverage discussed above.
A simple linear regression via ordinary least squares was applied to the NDVI time series. The slope of regression was taken as the annual NDVI trend. A Student's t-test was used to assess the significance of the trend. Trends with p < 0.05 were considered significant, and more strict thresholds (p < 0.02, 0.01, and 0.001) were also evaluated. A significant positive slope indicates a greening trend, and a significant negative slope indicates a browning trend (Ju et al., 2016).
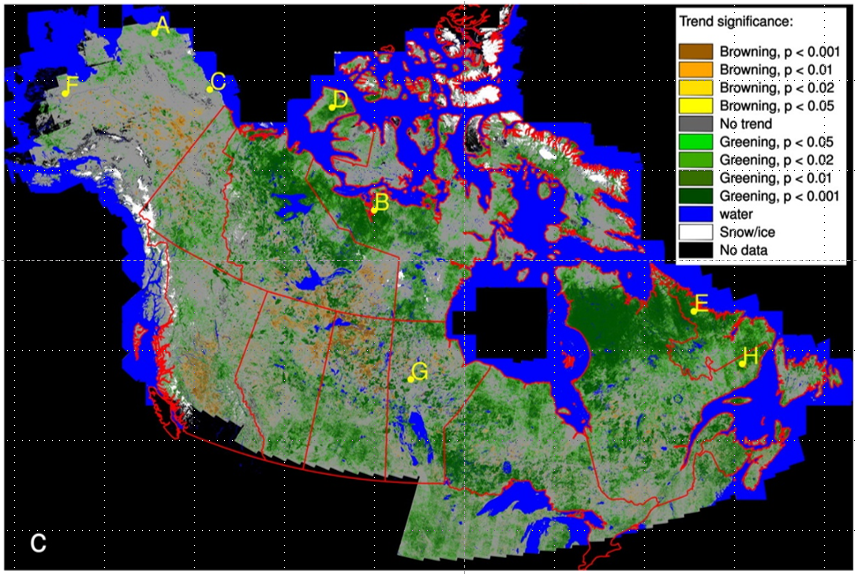
Figure 4. NDVI trend significance as derived from 30-m Landsat NDVI time series for Canada and Alaska (Ju and Masek, 2016).
Data Access
These data are available through the Oak Ridge National Laboratory (ORNL) Distributed Active Archive Center (DAAC).
ABoVE: NDVI Trends across Alaska and Canada from Landsat, 1984-2012
Contact for Data Center Access Information:
- E-mail: uso@daac.ornl.gov
- Telephone: +1 (865) 241-3952
References
Ju, Junchang, and J.G. Masek. 2016. The vegetation greenness trend in Canada and US Alaska from 1984–2012 Landsat data. Remote Sensing of Environment, (176), 1-6. https://doi.org/10.1016/j.rse.2016.01.001
Loboda, T.V., E.E. Hoy, and M.L. Carroll. 2017. ABoVE: Study Domain and Standard Reference Grids, Version 2. ORNL DAAC, Oak Ridge, Tennessee, USA. https://doi.org/10.3334/ORNLDAAC/1527
Masek, J.G., E.F. Vermote, N.E. Saleous, R. Wolfe, F.G. Hall, K.F. Huemmrich, Feng Gao, J. Kutle, and Teng-Kui Lim. 2006. A Landsat surface reflectance dataset for North America, 1990-2000. IEEE Geoscience and Remote Sensing Letters., 3 (1) (2006), pp. 68-72. https://doi.org/10.1109/LGRS.2005.857030
Pinzon, J.E., and C.J. Tucker. 2014. A non-stationary 1981–2012 AVHRR NDVI 3g time series. Remote Sensing, 6(8), 6929–6960. https://doi.org/10.3390/rs6086929