Documentation Revision Date: 2022-04-28
Dataset Version: 1
Summary
There are two data files in comma-separated values (*.csv) format included in this dataset.
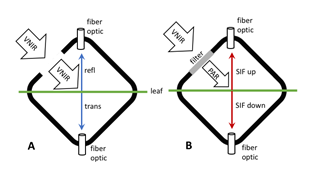
Figure 1. Schematic of FluoWat leaf clip operation for measuring leaf reflectance, transmittance, and upward and downward fluorescence (SIF). The leaf is placed in the clip and illuminated through the open port (A). Reflected and transmitted radiance are measured by attaching a fiber optic cable from the spectrometer to the top or bottom of the clip. To measure fluorescence spectra a low pass filter is placed across the illumination port (B). Two filters are applied in sequence, they block incident wavelengths above 650 nm and 700 nm, therefore any radiance measured in the longer wavelengths can come only from fluorescence. Source: Van Wittenberghe et al. (2015)
Citation
Huemmrich, K.F., and P.K. Campbell. 2022. Tundra Plant Leaf-level Spectral Reflectance and Chlorophyll Fluorescence, 2019-2021. ORNL DAAC, Oak Ridge, Tennessee, USA. https://doi.org/10.3334/ORNLDAAC/2005
Table of Contents
- Dataset Overview
- Data Characteristics
- Application and Derivation
- Quality Assessment
- Data Acquisition, Materials, and Methods
- Data Access
- References
Dataset Overview
This dataset provides leaf-level visible-near infrared spectral reflectance, chlorophyll fluorescence spectra, species, plant functional type (PFT), and chlorophyll content of common high latitude plant samples collected near Fairbanks, Utqiagvik, and Toolik, Alaska, U.S., during the summers of 2019, 2020, and 2021. A FluoWat leaf clip was used to measure leaf-level visible-near infrared spectral reflectance and chlorophyll fluorescence spectra. Fluorescence yield (Fyield) was calculated as the ratio of the emitted fluorescence divided by the absorbed radiation for the wavelengths from 400 nm up to the wavelength of the cut off for the FluoWat low pass filter (either 650 or 700 nm). Chlorophyll content of samples was measured using a CCM-300 Chlorophyll Content.
Project: Arctic-Boreal Vulnerability Experiment
The Arctic-Boreal Vulnerability Experiment (ABoVE) is a NASA Terrestrial Ecology Program field campaign based in Alaska and western Canada between 2016 and 2021. Research for ABoVE links field-based, process-level studies with geospatial data products derived from airborne and satellite sensors, providing a foundation for improving the analysis and modeling capabilities needed to understand and predict ecosystem responses and societal implications.
Related Publication
Huemmrich, K.F., P. Campbell, S.A. Vargas Z, S. Sackett, S. Unger, J. May, C. Tweedie, and E. Middleton. 2022. Leaf-level chlorophyll fluorescence and reflectance spectra of high latitude plants. Environmental Research Communications 4:035001. https://doi.org/10.1088/2515-7620/ac5365
Related Datasets
Huemmrich, K.F., and J.A. Gamon. 2021. Tundra Plant Reflectance, CO2 Exchange, PAM Fluorometry, and Pigments, AK, 2001-2002. ORNL DAAC, Oak Ridge, Tennessee, USA. https://doi.org/10.3334/ORNLDAAC/1960
Zesati, S.V., C.E. Tweedie, K.F. Huemmrich, P.K. Campbell, and M. Velez-Reyes. 2019. ABoVE: Reflectance Spectra of Tundra Plant Communities across Northern Alaska. ORNL DAAC, Oak Ridge, Tennessee, USA. https://doi.org/10.3334/ORNLDAAC/1685
Acknowledgments
This study was funded by the NASA ABoVE Program (grant 80NSSC19M0110).
Data Characteristics
Spatial Coverage: Areas around Fairbanks, Utqiagvik, and Toolik Lake, Alaska
ABoVE Reference Locations:
Domain: Core ABoVE
State/territory: Alaska
Grid cells ("c" grid): Ch040v032, Ch048v020, Ch050v007
Spatial Resolution: multiple points
Temporal Coverage: 2019-07-19 to 2021-09-30
Temporal Resolution: varied
Study Areas: Latitude and longitude are given in decimal degrees.
| Site (Region) | Westernmost Longitude | Easternmost Longitude | Northernmost Latitude | Southernmost Latitude |
|---|---|---|---|---|
| Fairbanks, Utqiagvik, and the Toolik Lake area, Alaska | -156.599 | -147.811 | 71.313 | 68.638 |
Data File Information
There are two data files in comma-separated values (*.csv) format included in this dataset: Northern_AK_Leaf_FluoWat_Reflectance.csv and Northern_AK_Leaf_FluoWat_Fluorescence.csv.
Data File Details
Table 1. Variable names and descriptions in the file Northern_AK_Leaf_FluoWat_Reflectance.csv.
| Variable | Description | Units |
|---|---|---|
| Species | Species name of the sample | |
| Sample_number | Number of the different samples measured | |
| Type | Plant functional type | |
| Source | Location where sample was collected | |
| Latitude | Latitude coordinate for location | degrees north |
| Longitude | Longitude coordinate for location | degrees east |
| Date | Date of FluoWat measurement | yyyy-mm-dd |
| Chlorophyll_content | Chlorophyll content measured with CCM-300 | mg m-2 |
| Rfl_400 - Rfl_1000 | Spectral reflectance interpolated to 1 nm intervals; the numbers in the column names refer to the wavelengths in nm | unitless |
| Notes | Descriptive notes on samples and measurements |
Table 2. Variable names and descriptions in the file Northern_AK_Leaf_FluoWat_Fluorescence.csv.
| Variable | Description | Units |
|---|---|---|
| Species | Species name of the sample | |
| Sample_number | Number of the different samples measured | |
| Type | Plant functional type | |
| Source | Location where sample was collected | |
| Latitude | Latitude coordinate for location | degrees north |
| Longitude | Longitude coordinate for location | degrees east |
| Date | Date of FluoWat measurement | yyyy-mm-dd |
| Chlorophyll_content | Chlorophyll content measured with CCM-300 | mg m-2 |
| Fluorence_yield_661 - Fluorence_yield_898 | Smoothed fluorescence yield times 106; the numbers in the column names refer to the wavelengths in nm (there is a gap in the Fyield spectra from 708 to 713 nm for the transition from data collected using the 650 nm filter and those collected using the 700 nm filter) | unitless |
| Notes | Descriptive notes on samples and measurements |
Application and Derivation
For these high latitude plant samples, both reflectance and fluorescence have been shown to indicate chlorophyll content and to exhibit distinct patterns among plant functional types. Combining these two different types of optical information may improve retrievals of landscape characteristics, fill in data gaps, and for temporal and spatial scaling (Huemmrich et al., 2022).
Quality Assessment
The statistical significance of the differences in fluorescence yield (Fyield) and chlorophyll content among samples were determined based on an ANOVA general linear model (GLM) analysis (SYSTAT 12.3, SYSTAT Software Inc., San Jose, CA, USA) (Zar, 2010). This approach was chosen due to the unbalanced design and uneven number of measured sample types, which occurred due to outliers and missing values in this study. The values for Fyield were examined for a sample plant functional types (i.e., conifer, deciduous, herbaceous, lichen, moss), species, sample sources, and their interactions using this approach (Huemmrich et al., 2022).
Data Acquisition, Materials, and Methods
Site Description
Plant samples were collected near Fairbanks (64.826°N, -147.811°E), Utqiagvik (71.313°N, -156.599°E), and Toolik (68.638°N, -149.597°E), AK, USA during the summers of 2019, 2020, and 2021. Upon collection, the samples were stored in plastic bags or containers, kept hydrated, and express mailed to Maryland, where they were measured. The small herbaceous plants were dug up to include roots and soil when shipped. For the shrub and tree samples, twigs were cut from the plants and then wrapped in wet paper towels and placed in plastic bags for shipment. As soon as the plants arrived in Maryland, they were watered and placed under diffuse light. The ends of the twigs were cut and immediately placed in water.
The aim was to collect a set of samples representing major types of plant cover for these regions (Table 3).
Table 3. Summary of species collected and measured with the FluoWat.
| Common Name | Scientific Name | Functional Type |
|---|---|---|
| Reindeer moss | Cladonia rangiferina | Lichen |
| Freckle pelt | Peltigera aphthosa | Lichen |
| Sphagnum moss | Sphagnum spp. | Moss |
| Feather moss | Hylocomnium splendens | Moss |
| Black spruce | Picea mariana | Conifer |
| Tamarack | Larix laricina | Conifer |
| White spruce | Picea glauca | Conifer |
| Cotton grass | Eriophorum spp. | Herbaceous plant |
| Water sedge | Carex aquatilis | Herbaceous plant |
| Sweet coltsfoot | Petasites frigidus | Herbaceous plant |
| Pendant grass | Arctophila fulva | Herbaceous plant |
| Vaccinium heath | Vaccinium vitis-idaea | Evergreen shrub |
| Alpine bearberry | Arctous alpina | Evergreen shrub |
| Arctic bell-heather | Cassiope tetragona | Evergreen shrub |
| Labrador tea | Rhododendron tomentosum | Evergreen shrub |
| Tealeaf willow | Salix pulchra | Deciduous shrub/tree |
| Dwarf birch | Betula nana | Deciduous shrub/tree |
| Birch spp. | Betula spp. | Deciduous shrub/tree |
| Quaking aspen | Populus tremuloides | Deciduous shrub/tree |
| Green alder | Alnus viridis | Deciduous shrub/tree |
Measurement Frequency
Samples were collected during the summers of 2019, 2020, and 2021. The sample plants were measured within a few days of their arrival in Maryland. Samples were measured on: July 19 and 25, 2019; September 15, October 3, and November 3, 2020; and July 23, 26, and 29, August 16, 17, 25, and 26; and September 30, 2021.
Measurement Methods
The FluoWat leaf clip is designed to make consistent reflectance and fluorescence spectral measurements (Figure 1; Van Wittenberghe et al, 2013). In use, the open port of the clip was aimed directly at an illumination source (VNIR arrow in Figure 1A) which illuminated the sample held in the clip at a consistent 45° angle to the fiber optic connected to the spectrometer (ASD FieldSpec, Malvern Panalytical). In this study, a halogen light source was used to illuminate the samples.
FluoWat measurements begin with a calibration panel placed in the clip with an open illumination port. After measuring the calibration panel, it is removed from the clip, and the leaf sample is placed in the clip for reflectance measurements. Then the illumination port is covered with low pass filters. Filters with 650 and 700 nm cut-offs were used in the measurements. These filters blocked all incident light above the cut-off wavelength (PAR arrow in Figure 1B), thus the only photons reaching the sensor in these longer wavelengths are from solar-induced fluorescence (SIF) emitted from the sample (SIF up and down in Figure 1B). Finally, a dark reading is collected with the illumination port completely covered to detect any light leaks into the clip (Huemmrich et al., 2022).
Using the FluoWat clip, measurements of both radiance from the leaf top and leaf bottom (reflectance and transmittance) can be collected. However, due to the nature of the plant samples in this study, with small leaves on the conifers and herbaceous tundra plants, and no leaves on the mosses and lichens, only the top reflectance and fluorescence are reported.
Reflectance (Reflλ) for each wavelength, l, was calculated as:
Reflλ = (Rλ - Dλ)/(Cλ - Dλ) (1)
where Rλ is the reflected radiance, Dλ is the dark measurement, and Cλ is the calibration panel radiance.
Fluorescence yield (Fyieldλ) was calculated as:
Fyieldλ = (Fλ - Dλ)/APAR (2)
where Fλ is the emitted radiance measured with a filter across the illumination port, Dλ is the dark measurement, and APAR is the sum of the absorption for the wavelengths from 400 nm to the filter cut off wavelength (650 or 700 nm).
In the reported Fyield spectra, wavelengths from 659 to 709 nm are measured using the 600 nm low pass filter to cover the wavelengths of the fluorescence red peak, and the Fyield for wavelengths longer than 712 nm is measured using the 700 nm filter for the fluorescence far-red peak. The use of the 700 nm filter allows incident light transmittance through the filter to the sample in the important chlorophyll absorption red spectral bands. A gap has been placed in the Fyield spectra from 708 to 713 nm to indicate the transition from Fyields measured with the 650 nm filter to those using the 700 nm filter. The Fyield spectra are multiplied by 106 and smoothed using a five-point running average.
During the FluoWat measurements an attempt was made to completely fill the spectrometer field of view with the plant sample. This was straightforward for plants with large leaves, and when possible, single leaves were measured. For smaller or narrow leaves, such as grass-like leaves, the leaves were arranged side by side to fill the field of view, while avoiding overlaps or gaps between leaves as much as possible. For the conifer samples, entire shoots including twigs and needles were placed in the FluoWat clip for measurement. Samples of mosses and lichens were placed in the clip filling the field of view and arranged so the light was illuminating the tops of the mats.
Chlorophyll content was measured using a CCM-300 Chlorophyll Content Meter (Opti-Sciences, Hudson, NH, USA). Unlike some other types of chlorophyll sensors, the CCM-300 does not use transmitted light, rather the CCM emits a beam of light at ~460 nm for excitation and measures the fluorescence emissions at ~700 and 735 nm through a fiber optic probe in contact with the sample. Chlorophyll concentration is determined by a linear relationship to the ratio of F735/F700. Thus, the CCM-300 is appropriate to measure materials such as lichens and mosses and small leaflets where measurements of transmittance are problematic. The reported chlorophyll content values are the averages of five measurements with the CCM-300.
Refer to Huemmrich et al. (2022) for additional details.
Data Access
These data are available through the Oak Ridge National Laboratory (ORNL) Distributed Active Archive Center (DAAC).
Tundra Plant Leaf-level Spectral Reflectance and Chlorophyll Fluorescence, 2019-2021
Contact for Data Center Access Information:
- E-mail: uso@daac.ornl.gov
- Telephone: +1 (865) 241-3952
References
Huemmrich, K.F., P. Campbell, S.A. Vargas Z, S. Sackett, S. Unger, J. May, C. Tweedie, and E. Middleton. 2022. Leaf-level chlorophyll fluorescence and reflectance spectra of high latitude plants. Environmental Research Communications 4:035001. https://doi.org/10.1088/2515-7620/ac5365
Van Wittenberghe, S., L. Alonso, J. Verrelst, I. Hermans, J. Delegido, F. Veroustraete, R. Valcke, J. Moreno, and R. Samson. 2013. Upward and downward solar-induced chlorophyll fluorescence yield indices of four tree species as indicators of traffic pollution in Valencia. Environmental Pollution 173:29-37. https://doi.org/10.1016/j.envpol.2012.10.003
Van Wittenberghe, S., L. Alonso, J. Verrelst, J. Moreno, and R. Samson. 2015. Bidirectional sun-induced chlorophyll fluorescence emission is influenced by leaf structure and light scattering properties — A bottom-up approach. Remote Sensing of Environment 158:169-179. https://doi.org/10.1016/j.rse.2014.11.012
Zar, J.H. 2010. Biostatistical Analysis 5th Edition. Saddle River, New Jersey: Prentice-Hall/Pearson. p.944