Documentation Revision Date: 2018-12-31
Data Set Version: 1
Summary
There are four compressed shapefiles (*.zip) and one geotiff (*.tif) in this data set. The geobotanical atlas of the Prudhoe Bay Region (Walker et al. 1980) is provided as a companion file in .pdf format. The shapefile data are also provided as companion files in .kmz format for viewing in Google Earth.
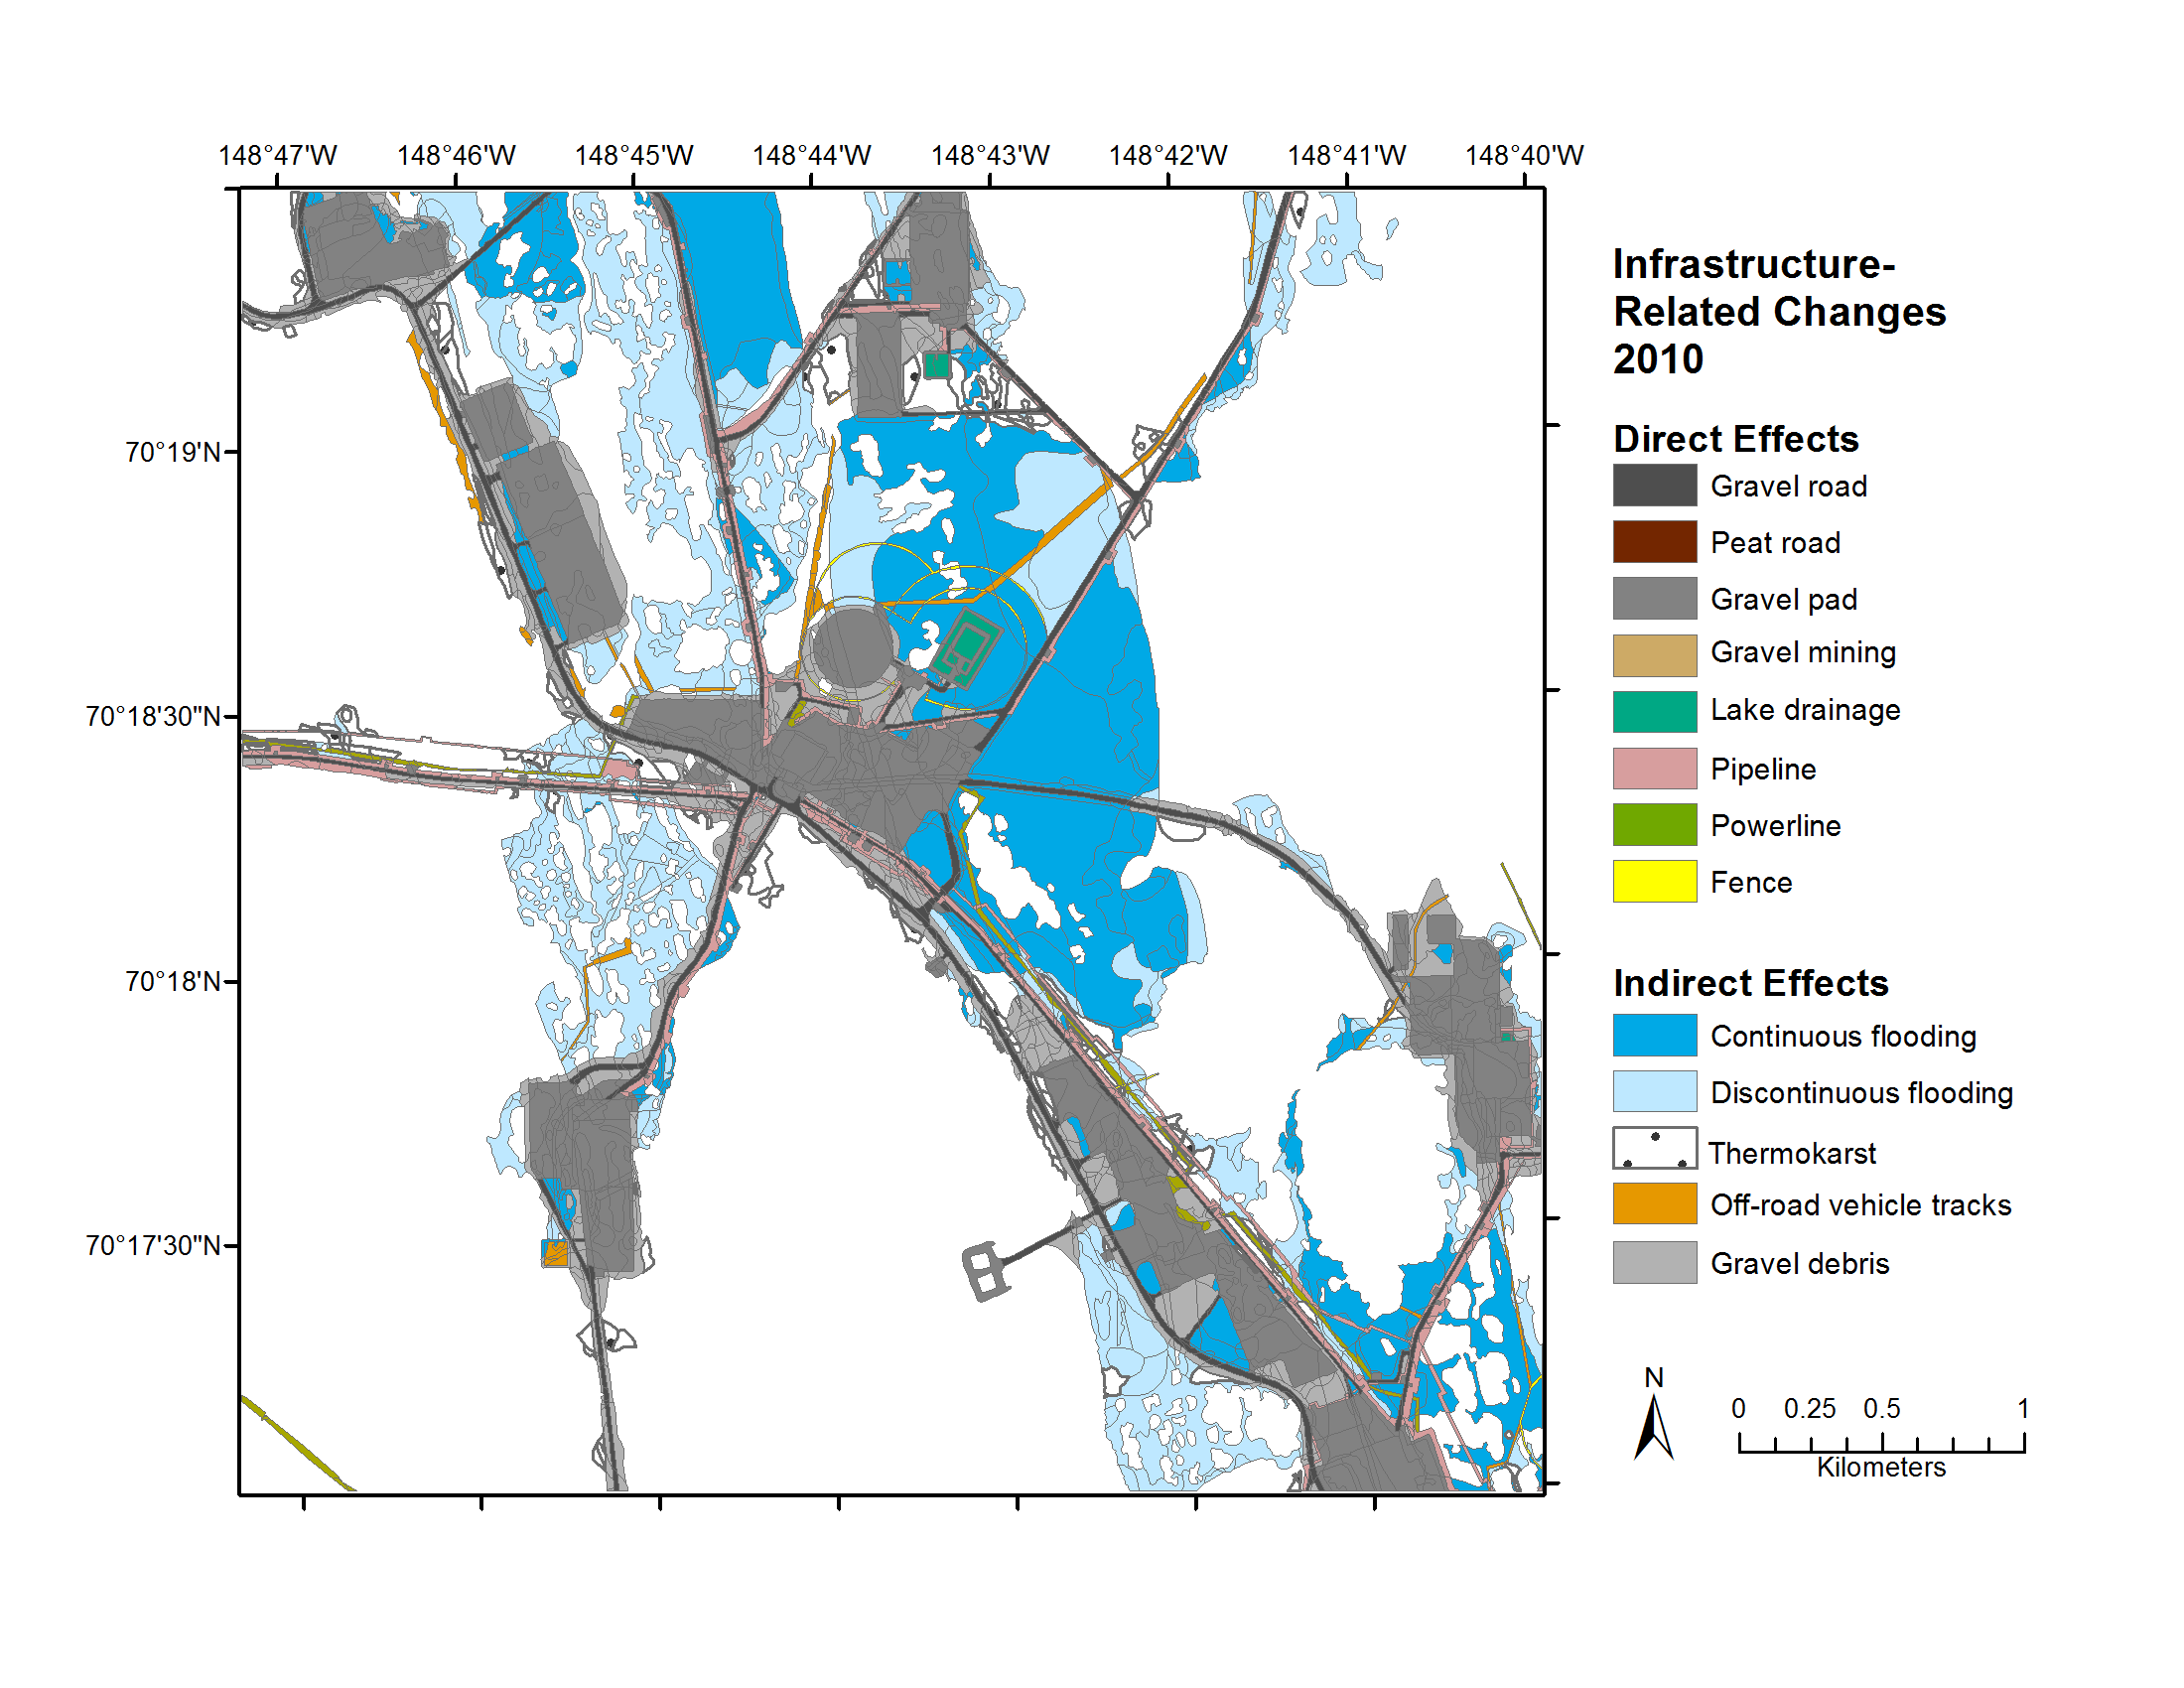
Figure 1: Cumulative impact map of infrastructure related disturbances from 2010 for Prudhoe Bay Oilfield site A.
Citation
Raynolds, M.K., and D.A. Walker. 2018. Geobotanical and Impact Map Collection for Prudhoe Bay Oilfield, Alaska, 1972-2010. ORNL DAAC, Oak Ridge, Tennessee, USA. https://doi.org/10.3334/ORNLDAAC/1387
Table of Contents
- Data Set Overview
- Data Characteristics
- Application and Derivation
- Quality Assessment
- Data Acquisition, Materials, and Methods
- Data Access
- References
Data Set Overview
This data set provides a collection of maps of geoecological characteristics of areas within the Beechey Point quadrangle near Prudhoe Bay on the North Slope of Alaska: a geobotanical atlas of the Prudhoe Bay region, a land cover map of the Beechey Point quadrangle, and cumulative impact maps in the Prudhoe Bay Oilfield for ten dates from 1968 to 2010. The geobotanical atlas is based on aerial photographs and covers 145 square kilometers of the Prudhoe Bay Oilfield. The land cover map of the Beechey Point quadrangle was derived from the Landsat multispectral scanner, aerial photography, and other field and cartographic methods. The cumulative impact maps of the Prudhoe Bay Oilfield show historical infrastructure and natural changes digitized from aerial photos taken in each successive analysis year (1968, 1970, 1972, 1973, 1977, 1979, 1983, 1990, 2001, and 2010). Nine geoecological attributes are included: dominant vegetation, secondary vegetation, tertiary vegetation, percentage open water, landform, dominant surface form, secondary surface form, dominant soil, and secondary soil. These data document environmental changes in an Arctic region that is affected by both climate change and rapid industrial development.
Project: Arctic-Boreal Vulnerability Experiment
The Arctic-Boreal Vulnerability Experiment (ABoVE) is a NASA Terrestrial Ecology Program field campaign taking place in Alaska and western Canada between 2016 and 2021. Climate change in the Arctic and Boreal region is unfolding faster than anywhere else on Earth. ABoVE seeks a better understanding of the vulnerability and resilience of ecosystems and society to this changing environment.
Related Data Sets:
Liu, L., K. Schaefer, A. Chen, A. Gusmeroli, E. Jafarov, S. Panda, A. Parsekian, T. Schaefer, H. A. Zebker, T. Zhang. 2015. Pre-ABoVE: Remotely Sensed Active Layer Thickness, Prudhoe Bay, Alaska, 1992-2000. ORNL DAAC, Oak Ridge National Laboratory Distributed Active Archive Center, Oak Ridge, Tennessee, USA. https://dx.doi.org/10.3334/ORNLDAAC/1267
Walker, D.A. 2016. Pre-ABoVE: Arctic Vegetation Plots at Prudhoe Bay, Alaska, 1973-1980. ORNL DAAC, Oak Ridge, Tennessee, USA. https://dx.doi.org/10.3334/ORNLDAAC/1360
Raynolds, M.K., A.L. Breen, and D.A. Walker. 2017. Pre-ABoVE: Land Cover and Ecosystem Map Collection for Northern Alaska. ORNL DAAC, Oak Ridge, Tennessee, USA. https://dx.doi.org/10.3334/ORNLDAAC/1359
Acknowledgements:
These data were obtained from the Alaska Arctic Geoecological Atlas (http://agc.portal.gina.alaska.edu), which provides access to existing Arctic vegetation plot and map data in support of the ABoVE campaign.
Data Characteristics
Spatial Coverage: Area surrounding the Prudhoe Bay Oilfield, North Slope, Alaska
ABoVE Site Designation:
Domain: ABoVE region
State/territory: Alaska
Grid cell: Ahh1Avv0
Spatial Resolution: ~50-m for the Beechey Point land cover
Temporal Coverage: 19490101 - 20100731
Temporal Resolution: Roughly decadal
Study Area: (all latitudes and longitudes given in decimal degrees)
| Site | Westernmost Longitude | Easternmost Longitude | Northernmost Latitude | Southernmost Latitude |
| Prudhoe Bay Oilfield, North Slope, Alaska | -150.1675 | -146.9737 | 71.0271 | 69.9702 |
Data File Information
There are four compressed shapefiles (*.zip), one geotiff (.tif), and a PDF in this data set. The shapefile data are also provided as companion files in .kmz format for viewing in Google Earth.
Table 1. File names and descriptions
| File Name | Description |
| prudhoe_a_geobotanical.zip | Cumulative impact maps for Prudhoe Bay Oilfield location A |
| prudhoe_b_geobotanical.zip | Cumulative impact maps for Prudhoe Bay Oilfield location B |
| prudhoe_c_geobotanical.zip | Cumulative impact maps for Prudhoe Bay Oilfield location C |
| beecheypoint_landcover.tif | Beechey Point land cover classification map |
| geobotanical_atlas_boundary.zip | Boundary of the Geobotanical Atlas of Prudhoe Bay |
| Companion Files | |
| prudhoe_a_geobotanical.kmz | Google Earth KMZ companion for prudhoe_a_geobotanical.kmz |
| prudhoe_b_geobotanical.kmz | Google Earth KMZ companion for prudhoe_b_geobotanical.kmz |
| prudhoe_c_geobotanical.kmz | Google Earth KMZ companion for prudhoe_c_geobotanical.kmz |
| geobotanical_atlas_boundary.kmz | Google Earth KMZ companion for the Geobotanical Atlas of Prudhoe Bay boundary |
| geobotanical_atlas.pdf | Geobotanical Atlas of Prudhoe Bay (Walker et al. 1980) |
| prudhoe_geobotanical_images.zip | Maps in PNG format depicting data from the spatial data files |
Prudhoe Bay Oilfield Cumulative Impact Maps
The cumulative impact maps for Prudhoe Bay are provided as shapefiles (prudhoe_[a,b,c]_geobotanical). Attribute definitions for the shapefiles are listed in Table 2, attribute code descriptions are listed in Tables 3-9, and spatial metadata for the shapefile are listed below:
NAD_1983_StatePlane_Alaska_4_FIPS_5004_Feet
WKID: 102634 Authority: ESRI
Projection: Transverse_Mercator
False_Easting: 1640416.666666667
False_Northing: 0.0
Central_Meridian: -150.0
Scale_Factor: 0.9999
Latitude_Of_Origin: 54.0
Linear Unit: Foot_US (0.3048006096012192)
Table 2. Shapefile attributes
NOTE: Cumulative impact disturbance and surface feature codes are described in Tables 3-9 below. Each shapefile is zipped with 6-7 thematic layers that provide symbologies for the shapefile data content.
| Attribute | Description |
| FID | Shapefile feature ID |
| MAP*_ID | Cumulative impact map codes |
| SQNUM | Internal map code |
| VEG1_49 | 1949 primary vegetation cover |
| VEG2_49 | 1949 secondary vegetation cover |
| VEG3_49 | 1949 tertiary vegetation cover |
| H2O_49 | 1949 percent water cover |
| LANDFORM_4 | 1949 landform |
| SURFORM1_4 | 1949 primary surface form |
| SURFORM2_4 | 1949 secondary surface form (if >30% cover) |
| SOIL1_49 | 1949 primary soils |
| SOIL2_49 | 1949 secondary soils |
| NATDIS_68 | 1968 natural disturbance |
| NATDIS_77 | 1977 natural disturbance |
| NATDIS_83 | 1983 natural disturbance |
| HUMANDIS1_ | 1970 primary human disturbance |
| HUMANDIS2_ | 1970 secondary human disturbance |
| HUMANDIS3_ | 1970 tertiary human disturbance |
| HUMANDIS11 | 1972 primary human disturbance |
| HUMANDIS21 | 1972 secondary human disturbance |
| HUMANDIS31 | 1972 tertiary human disturbance |
| HUMANDIS_1 | 1973 primary human disturbance |
| HUMANDIS_2 | 1973 secondary human disturbance |
| HUMANDIS_3 | 1973 tertiary human disturbance |
| HUMANDIS_4 | 1977 primary human disturbance |
| HUMANDIS_5 | 1977 secondary human disturbance |
| HUMANDIS_6 | 1977 tertiary human disturbance |
| HUMANDIS_7 | 1979 primary human disturbance |
| HUMANDIS_8 | 1979 secondary human disturbance |
| HUMANDIS_9 | 1979 tertiary human disturbance |
| HUMANDI_10 | 1983 primary human disturbance |
| HUMANDI_11 | 1983 secondary human disturbance |
| HUMANDI_12 | 1983 tertiary human disturbance |
| ND678 | Natural disturbance codes for 1968, 1977, and 1983 merged to one shapefile |
| HD123_70 | 1970 primary, secondary, and tertiary human disturbance |
| HD123_72 | 1972 primary, secondary, and tertiary human disturbance |
| HD123_73 | 1973 primary, secondary, and tertiary human disturbance |
| HD123_77 | 1977 primary, secondary, and tertiary human disturbance |
| HD123_79 | 1979 primary, secondary, and tertiary human disturbance |
| HD123_83 | 1983 primary, secondary, and tertiary human disturbance |
| ALL | All cumulative impact codes merged to one shapefile attribute |
| NATDIS_90 | 1990 natural disturbance |
| NATDIS_01 | 2001 natural disturbance |
| NATDIS_10 | 2010 natural disturbance |
| HUMANDI_13 | 1990 primary human disturbance |
| HUMANDI_14 | 1990 secondary human disturbance |
| HUMANDI_15 | 1990 tertiary human disturbance |
| HUMANDI_16 | 2001 primary human disturbance |
| HUMANDI_17 | 2001 secondary human disturbance |
| HUMANDI_18 | 2001 tertiary human disturbance |
| HUMANDI_19 | 2010 primary human disturbance |
| HUMANDI_20 | 2010 secondary human disturbance |
| HUMANDI_21 | 2010 tertiary human disturbance |
| Shape_Area | Polygon area |
Table 3. Landforms map codes
| Name | Code(s) | Color | Description |
| Drained thaw-lake basin | 1, 25 | Olive green | Distinct drained thaw-lake basin, includes islands within lakes and partially drained lake basins (code 25) |
| Primary surface | 4 | Sandy yellow | Residual surfaces unaffected by thaw-lake or river processes; may include some very old indistinct thaw-lake basins. |
| Pingo | 11 | Red | Small hills usually in drained thaw-lake basins. All the pingos in the mapped areas are closed system pingos, which are formed by hydrostatic forces that occur as the unfrozen sediments beneath the previous lake are refrozen after lake drainage. Within the map area, pingo dimensions are usually several tens of meters in diameter and up to 15 m high. |
| Active floodplain | 12 | Light sandy rose | Very active areas of floodplains with little vegetation |
| Stabilized floodplain | 13, 15, 20 | Dark sandy rose | Areas adjacent to the very active floodplain that are vegetated but regularly flooded by spring and/or summer flood events. Also includes ancient floodplains with well-defined terraces, oxbow lakes and cut off stream channels, and drainages of smaller streams (code 15). The map unit also includes small areas of bluffs (code 20) along the Putuligayuk River on Map B. |
| Sand dunes | 16 | Dark yellow | Sand dunes (both active and stabilized dunes) |
| Lake or pond | 51 | Bright blue | Lake or pond |
| River or stream | 52 | Dark blue | River or stream |
Table 4. Dominant surface forms map codes
| Name | Code(s) | Color | Description |
| High-center polygons, center-trough relief > 0.5 m | 1 | Orange | High-centered ice-wedge polygons have an elevated central portion to the polygon and troughs that are relatively low and a few meters wide. Formed by thawing of the ice wedges and subsidence of the trough surface. High-centered polygons with > 0.5 m of relief occur in areas with relatively steep hydrological gradients such as along lake margins and stream terraces and some pingos. The unit usually forms a narrow band a few meters wide along the margin of streams and shoreline of former thaw lakes. |
| High-center polygons, center-trough relief < 0.5 m | 2, 11 | Yellow orange | High-centered polygons with < 0.5 m relief occur in flatter, usually well-drained terrain, where there has been some subsidence of the ice-wedge polygon troughs. The centers may be nearly flat, and in some situations, particularly well-drained situations near streams and drained thaw-lake margins, a secondary pattern of small nonsorted polygons is common (code 11). |
| Mixed high- and low-centered polygons | 5 | Dark brown | Complex patterns consisting of both high- and low-centered polygons. Usually this unit occupies relatively small areas and represents incomplete topographic adjustment to a recently decreased base level, for example the drainage of a thaw lake or the relatively recent headward extension of a tributary drainage. |
| Low-centered polygons, center-rim relief > 0.5 m |
3 | Blue green | Low-centered ice-wedge polygons have a low central basin, an elevated rim around the basin, and low troughs that overlie the ice wedges and separate a polygon from adjacent polygons. Low-centered polygons with greater than 0.5 m of relief between polygon centers and rims are common in sandier portions of the oilfield and in the river deltas. Most of the polygon centers have standing water with aquatic vegetation. |
| Low-centered polygons, center-rim relief < 0.5 m |
4 | Light blue green | Low-centered polygons with less than 0.5 m of relief between polygon centers and rims with polygon diameters of approximately 10-15 m. |
| Irregular pattern | 7 | Light blue | Irregular or weakly developed patterned-ground features occur mostly in wet drained lake basins. The raised features may consist of weakly developed strangmoor, aligned hummocks, and/or disjunct polygon rims that are visible on aerial photographs at 1:6,000-scale. |
| Featureless | 10 | Medium yellow | Featureless or with patterned-ground occupying less than 20% of surface. |
| Non-sorted circles | 6 | Light gray | patterned-ground form that is usually circular or elliptical in form, characteristically barren or partially vegetated in the central portion of the circle and surrounded by vegetation in the margins. Most nonsorted circles in the Prudhoe Bay region are 1-2 m in diameter, flat to slightly domed in the center, with center-center spacing of 2.5 to 4 meters. Other terms include frost scars, frost boils, mud boils, mud circles, and spotted tundra. |
| Thermokarst pits | 14 | Blue dots over other pattern | Small ponds, generally circular in form, a few meters in diameter and often over 70 cm deep. Thermokarst pits form at the junction of ice-wedges, where there has been thawing and subsidence of the ice wedge. With further thawing of the ice-wedge, the ponds can deepen and enlarge and extend along the length of the ice wedge. These features were mapped on the 1973 1:6000 black and white aerial photographs wherever the density of pits was greater than 4 pits per 1-cm circle. Most of the pits were also visible on the 1949 1:24,000-scale BAR photographs. The features were most often mapped as secondary surface forms in conjunction with other patterned-ground features. |
| Pingo | 9 | Red | Small ice-cored mound |
| Floodplain surface forms | 13, 8, 16 | Dark gray | Active floodplain features including channels, river bar and river bank deposits and erosion features. The map unit also includes small areas of hummock terrain (code 8), and actively eroding banks (code 16) along the Putuligayuk River on Map B. |
| Water | 21 | Dark blue | Water |
Table 5. Dominant vegetation map codes
| Name | Code(s) | Color | Description (See Walker et al., 2014: Table 4.2 for species listings) |
| Dry tundra | 62, 63, 64 | Pink | Vegetation occurring on drier (xeric and xeromesic) tundra habitats |
| Moist tundra | 41, 42, 48 | Light yellow | Vegetation occurring in moist (mesic to hygromesic) tundra habitats |
| Wet tundra | 21 | Light blue | Vegetation occurring in wet (hygric) tundra habitats generally without standing water or with shallow (<10 cm) water |
| Aquatic marsh | 2, 3, 5 | Light bluish green | Emergent vegetation occurring in aquatic habitats with standing water |
| Barren | 64, 81, 83, 99 | Gray | Vegetation on predominantly barren habitats with sparse vascular-plant cover |
| Water | 1 | Dark blue | Unvegetated water |
Table 6. Soil map codes
| Name | Code(s) | Color | Description (See Walker et al., 2014: Table 4.2 for more detailed soil descriptions) |
| Soils of dry tundra | 1 | Red | Cold, well-drained, base-rich mineral soil with a dark, humus-rich surface horizon (mollic epipedon); calcium carbonate deposits occur on the underside of gravel fragments and free carbonate precipitates throughout the mollic epipedon; little evidence of cryoturbation; a deep active layer exceeding 1 m; mainly on pingos, but also some well-drained sites on terraces along streams and rivers. |
| Soils of moist tundra | 2 | Orange | Cold, moderately-drained soil complex, with a dark, base-rich, humus-rich mineral surface horizon (mollic epipedon) or a thick well-decomposed organic surface horizon (histic epipedon); the mineral horizon usually shows some mottling; underlain by permafrost within 1 m of the surface; usually associated with moderately well-drained areas between thaw lakes, river terraces, and stabilized dune features. Considerable cryoturbation may be present due to the presence of either non-sorted circles and/or small non-sorted polygons. |
| Soils of wet tundra | 3, 8 | Brown | Cold, wet soil complex. Most soils have thick organic surface horizons of varying degrees of decomposition that overlie wet, silty to loamy, base-rich, gleyed mineral horizons; the depth of summer thaw is generally < 50 cm; occurs in drained lake basins with either featureless or irregular patterned ground. |
| Wet patterned-ground soil association | 4 | Tan | Cold, wet association of soils occurring in areas of wet patterned-ground, mainly low-centered polygon complexes. |
| Non-sorted circle soil association | 5 | Light gray | Cold, wet association of soils occurring in areas of non-sorted circles. |
| Soils along stream and river channels | 10, 6 | Dark gray | Well-drained, gravelly or sandy alluvial soil with little horizon development. The unit includes the gravel channels with no soils in the active floodplains of the rivers and streams and more stable river bars that may have some soil development. |
| Sand dune soils or other soil covered by layer of aeolian sand | 7, 9 | Yellow | Well-drained sand-dune soil, underlain by permafrost at considerable depth. Includes soils covered by a thin layer of wind-blown sand. |
| Water | 21 | Blue | Water |
Table 7. Percent water cover map codes
| Code | Color | Percent cover |
| 1 | Gray-blue | 0 - 5% |
| 2 | Light blue | 5 - 30% |
| 3 | Turquoise | 30 - 60% |
| 4 | Medium blue | 60 - 90% |
| 5 | Blue | 90 - 100% |
Table 8. Infrastructure-related change/impact map codes
| Code | Description |
| 1 | Gravel road or pipeline construction road |
| 2 | Peat road |
| 3 | Gravel pad |
| 4 | Continuous flooding, > 75% open water |
| 5 | Discontinuous flooding, < 75% open water |
| 6 | Infrastructure-related thermokarst |
| 7 | Vehicle tracks - deeply rutted and/or with thermokarst |
| 8 | Vehicle tracks - not deeply rutted |
| 9 | Winter road |
| 10 | Gravel and construction debris, > 75% cover |
| 11 | Gravel and construction debris, < 75% cover |
| 12 | Heavy dust or dust-killed tundra |
| 13 | Excavations of river gravel or other gravel sources, or construction-related excavations |
| 14 | Barren tundra caused by oil spills, burns, blading, etc. |
| 15 | Barren tundra caused by previous flooding or draining of lakes |
| 16 | Construction-induced eolian deposits |
| 17 | Pipeline |
| 18 | Powerline and associated trails |
| 19 | Fence and associated trails |
| 20 | Canal |
Table 9. Non-infrastructure-related change/impact map codes
| Code(s) | Description |
| 2 | New vegetation in lake |
| 4 | Partial revegetation of gravel |
| 6, 64 | Increase in thermokarst pits (and thermokarst of pingos) |
| 61 | Widening of thermokarst troughs |
| 99 | Deposition of river gravel |
| 51 | Erosion of lake shore |
| 28, 52 | Erosion of river shore (to gravel or water) |
| 63 | Erosion from surface flow, gullying |
| 21 | Decrease in vegetation in lake |
Geobotanical Atlas of Prudhoe Bay
The boundary corresponding to the coverage area for the Geobotanical Atlas of Prudhoe Bay is provided as a shapefile (geobotanical_atlas_boundary.zip). The atlas is provided as a companion file in .pdf file format. Spatial metadata for the shapefile are listed below:
NAD_1927_UTM_Zone_6N
WKID: 26706 Authority: EPSG
Projection: Transverse_Mercator
False_Easting: 500000.0
False_Northing: 0.0
Central_Meridian: -147.0
Scale_Factor: 0.9996
Latitude_Of_Origin: 0.0
Linear Unit: Meter (1.0)
Beechey Point Quadrangle Land Cover Classification
The land cover map for the Beechey Point quadrangle is provided in GeoTIFF file format (beecheypoint_landcover.tif). Spatial metadata for the geotiff are provided below and land cover classification codes are listed in Table 10:
GCS_WGS_1984
WKID: 4326 Authority: EPSG
Angular Unit: Degree (0.0174532925199433)
Prime Meridian: Greenwich (0.0)
Datum: D_WGS_1984
Spheroid: WGS_1984
Semimajor Axis: 6378137.0
Semiminor Axis: 6356752.314245179
Inverse Flattening: 298.257223563
Table 10. Beechey Point land cover map (beecheypoint_landcover.tif) classification codes
| Land cover category | Classification code(s) |
| Water | 1,2,3,4,6,7,8,11,27,42,44,45,46 |
| Wet herbaceous tundra | 5,10,47,50 |
| Moist or dry herbaceous shrub tundra | 14,49,51 |
| Moist herbaceous, mixed shrub tundra | 17 |
| Shrubland | 16,18,19,20,21,22 |
| Sparse vegetation | 23,24,55,56 |
| Barren | 9,12,25,26,43,52,53,57 |
| Ice | 28-40 |
| Background | 41 |
Application and Derivation
These data document environmental changes in an Arctic region that is affected by both climate change and rapid industrial development. These data could be useful as a historical baseline for climate change studies in the local region or as model validation data. The cumulative impact maps may be used to examine changes in flora and fauna of the Prudhoe Bay region attributable to various types of human and natural disturbance.
Quality Assessment
No quality assessment or uncertainty estimates were included with this data set. Much of the data is derived from visual observation of historical aerial photography.
Data Acquisition, Materials, and Methods
Prudhoe Bay Oilfield
The Prudhoe Bay Oilfield (PBO) in northern Alaska was the first developed oilfield in the Arctic. It is an extremely important asset to the U.S. and the state of Alaska, containing 16% of U.S. proven reserves of oil and gas. In 2012, taxes on the oil from the Northern Alaska oilfields accounted for over 90% of the Alaska state budget. The PBO is located on the coast of the Beaufort Sea, halfway between the Canadian border and Point Barrow, a region that was remote and roadless prior to the discovery of oil in March 1968, and is still linked to the rest of the U.S. by a single 417-km road, the Dalton Highway. An extensive infrastructure network quickly followed the oil discovery, resulting in development within an approximately 2,600 km2 area along a 150-km portion of coastal tundra, located mostly between the Sagavanirktok River on the east and the Colville River on the west.
Prudhoe Bay Cumulative Impact Maps (Raynolds et al. 2014)
The data contained in the cumulative impact maps (prudhoe_[a,b,c]_geobotanical) for the Prudhoe Bay Oilfield were produced primarily from observation of aerial photography:
- Primary, secondary, and tertiary human disturbances for each observation interval (HUMANDIS*) were recorded based on interpretation of aerial photographs.
- Natural disturbances for each observation interval (NATDIS_*) were recorded based on interpretation of aerial photographs.
- Primary (SOIL1_49) and secondary (SOIL2_49) soils are based on interpretation of 1949 black-and-white aerial photographs.
- Landform (LANDFORM_49) is based on interpretation of 1949 black-and-white aerial photographs.
- Percent water cover (H2O_49) is based on interpretation of 1949 black-and-white aerial photographs.
Geobotanical Atlas of the Prudhoe Bay Region (Walker et al. 1980)
The geobotanical atlas of the Prudhoe Bay Region (Walker et al., 1980) covers most of the Prudhoe Bay Oilfield on the North Slope of Alaska that was under development in 1980, covering 145 km2. The map synthesizes work done for the US Army Corps of Engineers CRREL, the International Biome Program, and the UNESCO MAB Project 6. The mapping was based on aerial photographs taken in 1973 at a scale of 1:6000. The maps are thus a static representation of a type of arctic tundra at a time when only relatively minor terrain disturbance had occurred. It can be used as a baseline against which further natural and human-induced changes to the landscape can be measured. A geoecological approach was used in the mapping of landforms (12 units as well as linear mapping of steep embankments, undercut river banks, excavated areas and streams), soils (7 units) and land cover (29 natural vegetation units and 8 disturbed units).
Beechey Point Land Cover Classification (Walker & Acevedo 1987)
The land cover map (beecheypoint_landcover.tif) is a Landsat-derived land cover classification of the Beechey Point quadrangle (1:250,000 scale) with descriptions of the major vegetation units. Eight Landsat-level units derived from the multispectral scanner data, eleven photo-interpreted units, and eight common vegetation complexes were described and illustrated. The region was divided into four landscape units: flat thaw-lake plains, gently rolling thaw-lake plains, hills, and flood plains. Area analysis of the quadrangle was done according to townships and nine small study areas. The mapping used a hierarchical tundra mapping classification approach. Area measurement data from geobotanical maps at eight study sites were compared with similar data from Landsat maps of the same sites. The results indicated that Landsat maps yielded area measurements corresponding to broad geobotanical categories. Please see Walker & Acevedo (1987) for additional information on the methods used to produce this land cover map.
Data Access
These data are available through the Oak Ridge National Laboratory (ORNL) Distributed Active Archive Center (DAAC).
Geobotanical and Impact Map Collection for Prudhoe Bay Oilfield, Alaska, 1972-2010
Contact for Data Center Access Information:
- E-mail: uso@daac.ornl.gov
- Telephone: +1 (865) 241-3952
References
Raynolds M.K., Walker D.A., Ambrosius K.J., Brown J., Everett K.R., Kanevskiy M., Kofinas G.P., Romanovsky V.E., Shur Y. & Webber P.J. 2014. Cumulative geoecological effects of 62 years of infrastructure and climate change in ice-rich permafrost landscapes, Prudhoe Bay Oilfield, Alaska. Global Change Biology 20: 1211-1224.
Walker, D. A. and W. Acevedo. 1987. Vegetation and a Landsat-derived land cover map of the Beechey Point Quadrangle, Arctic Coastal Plain, Alaska. CRREL Report 87-5.