Documentation Revision Date: 2021-04-03
Dataset Version: 1
Summary
This dataset consists of 21 files in geoTIFF (*.tif) format.
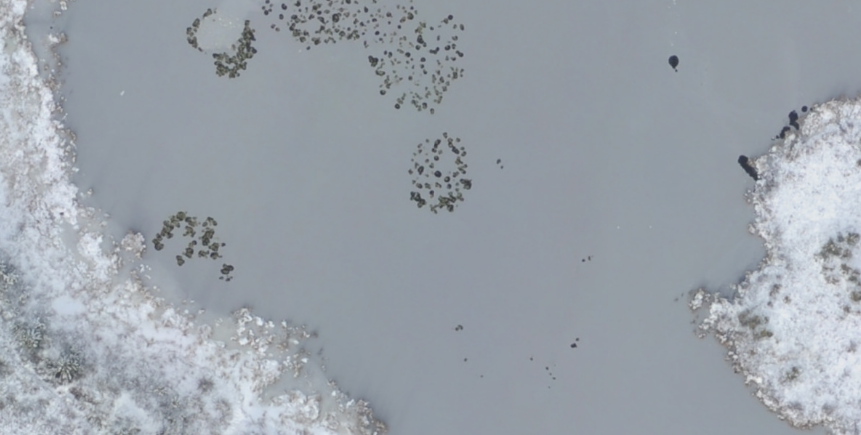
Figure 1. Image of a portion of Doughnut Lake. In aerial photos, dark, round methane hotspot holes in the ice (usually < 1 m diameter) have a strong contrast against white, snow-covered lake ice. Source: AerialPhoto_Doughnut.tif
Citation
Anthony, K.W., P. Lindgren, P. Hanke, J. Cherry, and M.J. Engram. 2021. ABoVE: Aerial Photographs of Frozen Lakes near Fairbanks, Alaska, October 2014. ORNL DAAC, Oak Ridge, Tennessee, USA. https://doi.org/10.3334/ORNLDAAC/1845
Table of Contents
- Dataset Overview
- Data Characteristics
- Application and Derivation
- Quality Assessment
- Data Acquisition, Materials, and Methods
- Data Access
- References
Dataset Overview
This dataset includes high resolution orthophotographs of 21 lakes in the region of Fairbanks, Alaska, USA. Aerial photographs were taken on October 8, 2014, three days after lake-ice formation. These photographs were used to identify open holes in lake ice that indicate the location of hotspot seeps associated with the releases of methane from thawing permafrost. Aerial photography can be used to measure changes in lake areas and to observe patterns in the formation of lake ice and other early winter lake conditions.
Project: Arctic-Boreal Vulnerability Experiment
The Arctic-Boreal Vulnerability Experiment (ABoVE) is a NASA Terrestrial Ecology Program field campaign being conducted in Alaska and western Canada, for 8 to 10 years, starting in 2015. Research for ABoVE links field-based, process-level studies with geospatial data products derived from airborne and satellite sensors, providing a foundation for improving the analysis, and modeling capabilities needed to understand and predict ecosystem responses to, and societal implications of, climate change in the Arctic and Boreal regions.
Related Publication
Walter Anthony, K.M., P. Lindgren, P. Hanke, M. Engram, P. Anthony, R. Daanen, A.C. Bondurant, A.K. Liljedahl, J. Lenz, G. Grosse, B.M. Jones, L. Brosius, S.R. James, B.J. Minsley, N.J. Pastick, J. Munk, J. Chanton, C.E. Miller, and F.J. Meyer. 2020. Decadal-scale hotspot methane ebullition within lakes following abrupt permafrost thaw. Environmental Research Letters 16 035010. http://doi.org/10.1088/1748-9326/abc848
Related Datasets
Anthony, K.W., and P. Lindgren. 2021. ABoVE: Historical Lake Shorelines and Areas near Fairbanks, Alaska from 1949-2009. ORNL DAAC, Oak Ridge, Tennessee, USA. https://doi.org/10.3334/ORNLDAAC/1859
Anthony, K.W., P. Hanke, and P. Lindgren. 2021. ABoVE: Methane Ebullition Hotspots in Frozen Lakes near Fairbanks, Alaska, 2014. ORNL DAAC, Oak Ridge, Tennessee, USA. https://doi.org/10.3334/ORNLDAAC/1861
Brown, D.R.N., T.J. Brinkman, and D. Verbyla. 2019. ABoVE: River Ice Breakup and Freeze-up Stages, Yukon River Basin, Alaska, 1972-2016. ORNL DAAC, Oak Ridge, Tennessee, USA. https://doi.org/10.3334/ORNLDAAC/1697
Du, J., J.S. Kimball, and J.D. Watts. 2016. ABoVE: Fractional Open Water Cover for Pan-Arctic and ABoVE-Domain Regions, 2002-2015. ORNL DAAC, Oak Ridge, Tennessee, USA. https://doi.org/10.3334/ORNLDAAC/1362
Yi, Y., and J.S. Kimball. 2020. ABoVE: Active Layer Thickness from Remote Sensing Permafrost Model, Alaska, 2001-2015. ORNL DAAC, Oak Ridge, Tennessee, USA. https://doi.org/10.3334/ORNLDAAC/1760
User Note: Users can overlay the locations of 21 orthophotograph lakes (dataset 1845) on the shapefiles in the current dataset (1859) to create a cross-reference map. The relationships among three Anthony et al. related datasets are as follows:
- Anthony et al. (2020) (current dataset - 1845) - high-resolution orthophotographs of 21 lakes in the Goldstream Valley
- Anthony et al. (2021) (dataset 1859) - historical and recent lake locations, shorelines, and areas of lakes and ponds across Goldstream Valley
- Anthony et al. (2021) (dataset 1861) - digitized methane hotspot locations in 15 lakes in the Goldstream Valley derived from 15 of the 21 photographed lakes provided in dataset 1845
Acknowledgments
This work was supported by NASA's ABoVE Program (grants NNX15AU49A and NNN12AA01C).
Data Characteristics
Spatial Coverage: Goldstream Valley northwest of Fairbanks, AK, USA
ABoVE Reference Locations
Domain: Core
State/Territory: Alaska
Grid cells (3): Ah001v000, Bh006v005, Ch040v032
Spatial Resolution: 9–11 cm
Temporal Coverage: 2014-10-08
Temporal Resolution: One-time estimate
Site Boundaries: Latitude and longitude are given in decimal degrees.
| Site | Westernmost Longitude | Easternmost Longitude | Northernmost Latitude | Southernmost Latitude |
|---|---|---|---|---|
| Goldstream Valley, AK | -147.949 | -147.758 | 65.94 | 65.858 |
Data File Information
There are 21 data files in geoTiFF (*.tif) format included in this dataset. Each file is an orthorectified aerial photograph of a lake taken on 2014-10-08 across the study area. Files are named AerialPhoto_<lake_name>.tif, and lake names are provided in Table 1.
Table 1. File names and descriptions. Latitude and longitude coordinates are given in decimal degrees and root mean squared error (RMSE) is in meters.
| File Name | Lake Name | Latitude | Longitude | RMSE |
|---|---|---|---|---|
| AerialPhoto_BigTrail.tif | BigTrail Lake | 64.919 | -147.821 | 3.02 |
| AerialPhoto_Caribou.tif | Caribou Lake | 64.879 | -147.765 | 1.23 |
| AerialPhoto_Cranberry.tif | Cranberry Lake | 64.937 | -147.820 | 1.95 |
| AerialPhoto_Deuce.tif | Deuce Lake | 64.864 | -147.940 | 2.16 |
| AerialPhoto_Doughnut.tif | Doughnut Lake | 64.898 | -147.909 | 1.95 |
| AerialPhoto_Eagle.tif | Eagle Lake | 64.923 | -147.816 | 2.17 |
| AerialPhoto_Flag.tif | Flag Lake | 64.912 | -147.857 | 2.13 |
| AerialPhoto_Goose.tif | Goose Lake | 64.913 | -147.847 | 1.89 |
| AerialPhoto_GENL1.tif | Goldstream East New Lake 1 Lake | 64.920 | -147.813 | 1.78 |
| AerialPhoto_GENL2.tif | Goldstream East New Lake 2 Lake | 64.925 | -147.811 | 2.85 |
| AerialPhoto_GENL3.tif * | Goldstream East New Lake 3 Lake | 64.925 | -147.796 | 1.65 |
| AerialPhoto_GWNL1.tif | Goldstream West New Lake 1 Lake | 64.910 | -147.849 | 2.30 |
| AerialPhoto_GWNL2.tif | Goldstream West New Lake 2 Lake | 64.899 | -147.914 | 2.81 |
| AerialPhoto_GWNL4.tif ** | Goldstream West New Lake 4 Lake | 64.900 | -147.919 | 3.01 |
| AerialPhoto_Octopus.tif | Octopus Lake | 64.908 | -147.860 | 1.78 |
| AerialPhoto_Reindeer.tif | Reindeer Lake | 64.884 | -147.771 | 1.22 |
| AerialPhoto_Roxie.tif | Roxie Lake | 64.868 | -147.920 | 0.78 |
| AerialPhoto_Smith.tif | Smith Lake | 64.865 | -147.864 | 2.14 |
| AerialPhoto_Snoopy.tif | Snoopy Lake | 64.925 | -147.812 | 1.60 |
| AerialPhoto_Star.tif | Star Lake | 64.882 | -147.768 | 2.14 |
| AerialPhoto_Stephens.tif | Stephens Lake | 64.863 | -147.871 | 2.14 |
* Goldstream_East_New_Lake_3_20141008.tif uses the CRS "UTM 16N – NAD83" (EPSG 26906).
** There is no aerial photo for GWNL3.
Data File Details
- The photographs consist of three visible bands: red, green, and blue (RGB).
- The spatial resolution of the images is 9.65–11.0 cm per pixel.
- All files use the CRS "NAD83" (EPSG: 4269) with one exception; AerialPhoto_GENL3.tif uses "UTM 16N – NAD83" (EPSG 26906).
- The spatial accuracy of orthorectification is provided as root mean squared error (RMSE) in meters.
Application and Derivation
These aerial photographs were used in a project that investigated the role of theromkarst lakes in thawing of permafrost and mobilization of organic carbon in frozen soils. Aerial photography was used to measure changes in lake areas and patterns in the formation of lake ice. Holes in lake ice can indicate the location of hotspot seeps associated with the releases of methane from thawing permafrost (Walter Anthony et al., 2020). These data can be used to assess other early winter lake conditions.
Quality Assessment
The aerial photographs were georeferenced and rectified using ground control points. LiDAR elevation data from the 2017 Alaska Division of Geological & Geophysical Surveys (https://inport.nmfs.noaa.gov/inport/item/55358) were used to validate ground control point placement and for elevation input to the Agisoft orthorectification software. Lake locations and the RMSE of orthorectification are provided in Table 1.
Data Acquisition, Materials, and Methods
Study Area
The study area encompasses 214 km2 with thermokarst lakes in the discontinuous permafrost region northwest of Fairbanks, AK, especially the southern region of the Goldstream Valley (Fig. 2). This landscape is characterized by yedoma permafrost and ice wedges covering the valley bottom and north-facing slopes, thermokarst lakes at toe-slopes, and the valley floor, large differences in microclimates between high- and low-elevation areas, and an abundance of wetlands despite relatively low precipitation.
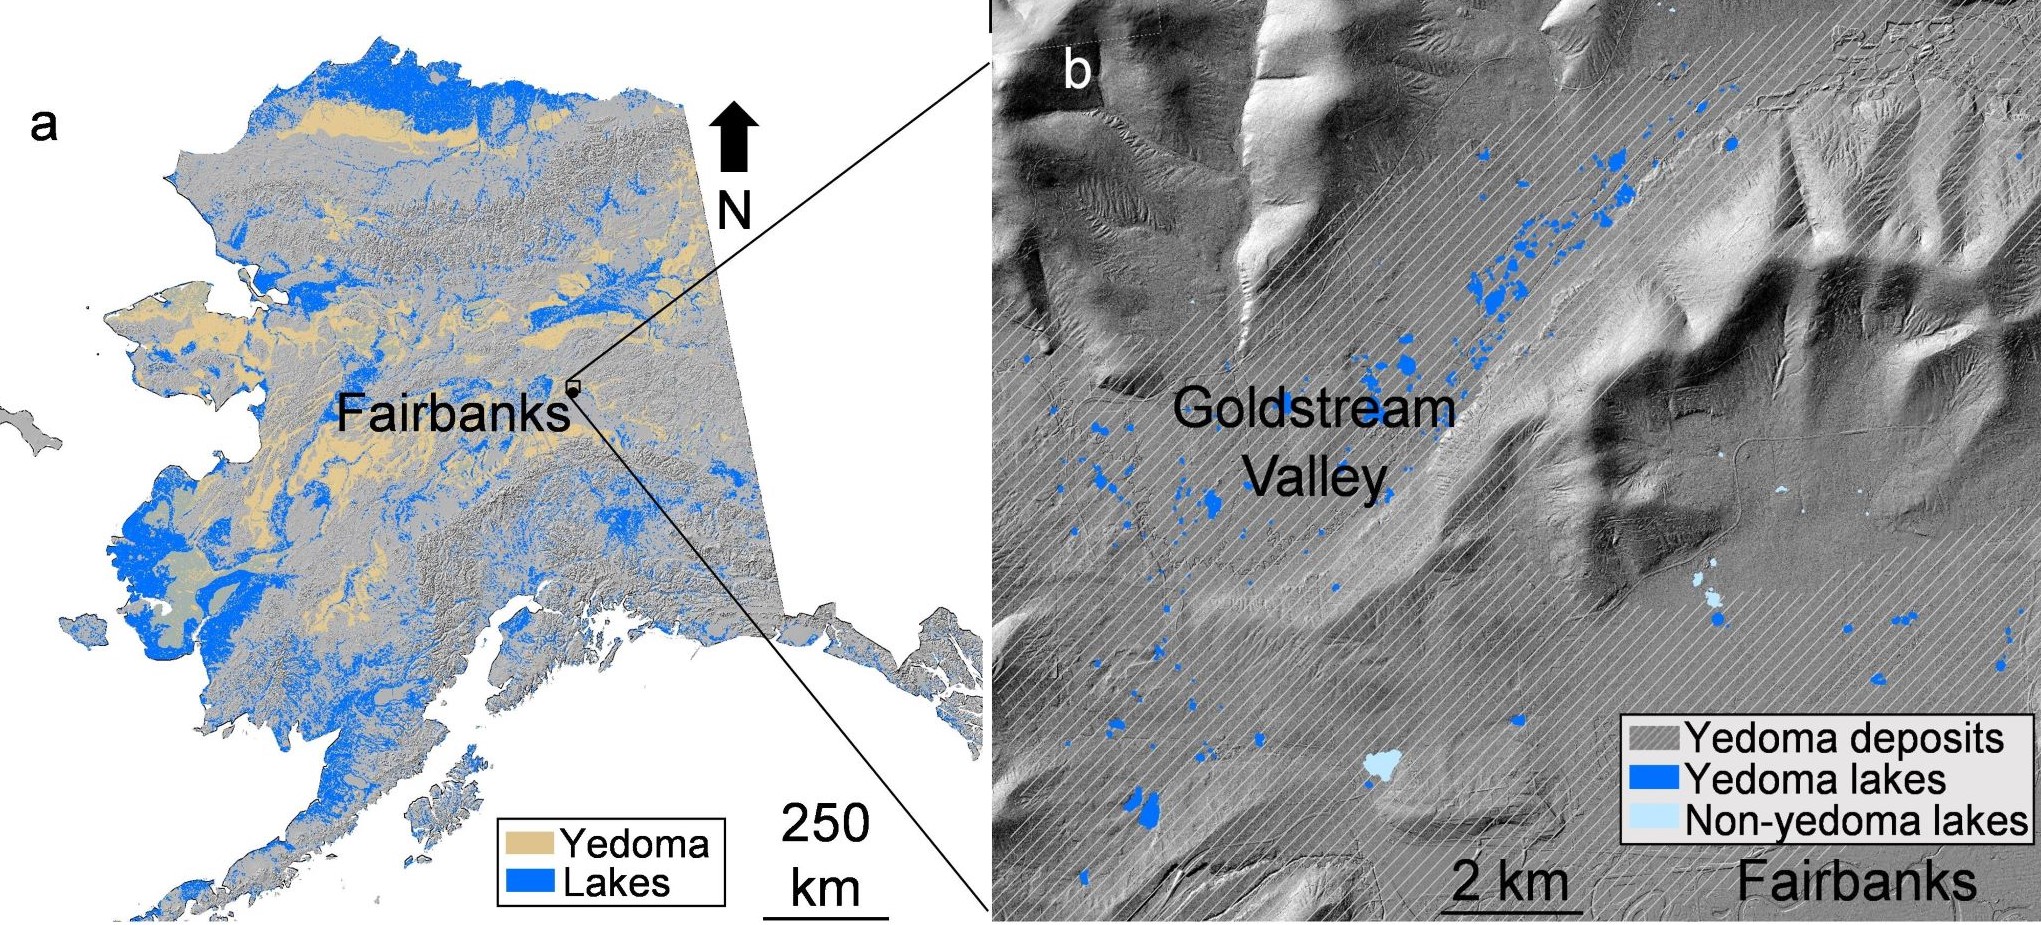
Figure 2. Location of the study area northwest of Fairbanks, Alaska, USA. The map shows (a) yedoma permafrost distribution and (b) yedoma lakes and terrain of the Goldstream Valley. Data sources include Strauss et al. (2016), Alaska LiDAR Dataset (USGS, 2018), Elevation Datasets of Alaska (DGGS Staff, 2013), and Walter Anthony et al. (2020).
Data Sources
High-resolution oblique aerial photographs of 21 individual lakes in the Fairbanks region were acquired on October 8, 2014, three days after lake-ice formation. The photographs, taken at 541–641 m altitude with a resolution of 9–11 cm, consisted of three visible bands: red, green, and blue (RGB). These images were orthorectified with Agisoft Photoscan Professional (version 1.3.4.5067) using 2007 Digital Orthophoto Quarter Quads (EROS Center, 2017) provided by the U.S. Geologic Survey as reference data for the selection of ground control points.
Data Access
These data are available through the Oak Ridge National Laboratory (ORNL) Distributed Active Archive Center (DAAC).
ABoVE: Aerial Photographs of Frozen Lakes near Fairbanks, Alaska, October 2014
Contact for Data Center Access Information:
- E-mail: uso@daac.ornl.gov
- Telephone: +1 (865) 241-3952
References
DGGS Staff. 2013. Elevation Datasets of Alaska. Alaska Division of Geological & Geophysical Surveys Digital Data Series 4. https://doi.org/10.14509/25239
EROS (Earth Resources Observation And Science) Center. 2017. Digital Orthophoto Quadrangle (DOQ). U.S. Geological Survey. https://doi.org/10.5066/F7125QVD
Strauss, J., S. Laboor, A.N. Fedorov, D. Fortier, D. Froese, M. Fuchs, G. Grosse, F. Günther, J.W. Harden, G. Hugelius, M.Z. Kanevskiy, A.L. Kholodov, V.V. Kunitsky, G. Kraev, L. Lapointe-Elmrabti, A.V. Lozhkin, E. Rivkina, J. Robinson, L. Schirrmeister, D. Shmelev, Y. Shur, C. Siegert, V. Spektor, M. Ulrich, S.L. Vartanyan, A. Veremeeva, K.M. Walter Anthony, and S.A. Zimov. 2016. Database of Ice-Rich Yedoma Permafrost (IRYP). PANGAEA. https://doi.org/10.1594/PANGAEA.861733
USGS (U.S. Geological Survey.) 2018. USGS Lidar Point Cloud AK FairbanksNSB QL1 2017 FB17 4205 LAS 2018: U.S. Geological Survey. https://www.sciencebase.gov/catalog/item/5be30ff4e4b0b3fc5cf70b38
Walter Anthony, K.M., P. Lindgren, P. Hanke, M. Engram, P. Anthony, R. Daanen, A.C. Bondurant, A.K. Liljedahl, J. Lenz, G. Grosse, B.M. Jones, L. Brosius, S.R. James, B.J. Minsley, N.J. Pastick, J. Munk, J. Chanton, C.E. Miller, and F.J. Meyer. 2020. Decadal-scale hotspot methane ebullition within lakes following abrupt permafrost thaw. Environmental Research Letters 16 035010. http://doi.org/10.1088/1748-9326/abc848