Documentation Revision Date: 2018-12-31
Data Set Version: 1
Summary
The well construction activities caused a great deal of damage to the tundra, and many barrels and other debris were left after the well was abandoned. Eighty-four recovery plots were established in July of 1979 by removing debris and three additional plots were established after the cleanup.
There are three data files in comma-separated (.csv) format with this data set.
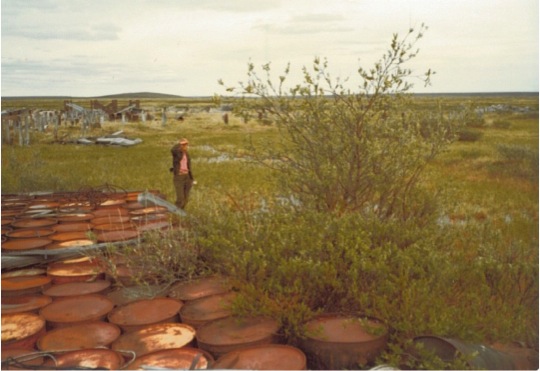
Figure 1. Photo from the Oumalik study area showing vegetation and some of the barrels left from the oil well test site when it was abandoned in 1950 (from Ebersole, 1985).
Citation
Ebersole, J.J. 2018. Arctic Vegetation Plots at Oumalik, AK, 1983-1985. ORNL DAAC, Oak Ridge, Tennessee, USA. https://doi.org/10.3334/ORNLDAAC/1506
Table of Contents
- Data Set Overview
- Data Characteristics
- Application and Derivation
- Quality Assessment
- Data Acquisition, Materials, and Methods
- Data Access
- References
Data Set Overview
This study addressed the environment, ecosystems, and disturbances to the vegetation around a test oil well at Oumalik, Alaska, erected during 1949-1950 and abandoned in 1950. The data includes environmental, soil, and vegetation data collected between 1983 and 1985 from 87 study plots near the abandoned oil well. Specific attributes include dominant vegetation, species, and cover, soil chemistry, physical characteristics, moisture, and organic matter, as well as site disturbance from various sources.
Eighty-four recovery plots were established in July of 1979 by removing debris leftover from the test well's abandonment in 1950. Three additional plots were established after the cleanup. A classification of the vegetation was done to provide communities for comparison to the natural vegetation, including disturbances, and an ordination of the disturbed vegetation showed the environmental factors that correlated most highly with the variation in vegetation (Ebersole, 1985).
The Pre-ABoVE vegetation plot datasets were curated to create the Alaska Arctic Vegetation Archive (AVA-AK; Walker et al. 2016b, Walker 2013). The AVA-AK is a regional database that is part of the larger Arctic Vegetation Archive (Walker 2016a, Walker et al. 2013, Walker and Raynolds 2011). The database contains vegetation plots from homogeneous plant communities with tables of cover or cover-abundance scores for all species and accompanying environmental site data. Field data were collected using Braun-Blanquet, US National Vegetation Classification protocols, or comparable methods.
Project: Arctic-Boreal Vulnerability Experiment (ABoVE)
The Arctic-Boreal Vulnerability Experiment (ABoVE) iis a NASA Terrestrial Ecology Program field campaign that will take place in Alaska and western Canada between 2016 and 2021. Climate change in the Arctic and Boreal region is unfolding faster than anywhere else on Earth. ABoVE seeks a better understanding of the vulnerability and resilience of ecosystems and society to this changing environment.
Acknowledgements:
These data files were edited by Donald A. Walker, Amy L. Breen and Lisa A. Druckenmiller at the University of Alaska Fairbanks' Alaska Geobotany Center and obtained via the Arctic Geoecological Atlas (http://arcticatlas.geobotany.org/), which provides access to existing Arctic vegetation plot and map data in support of the ABoVE campaign.
Data Characteristics
Spatial Coverage: Oumalik, Alaska
ABoVE Grid Location: Ahh1Avv0
Spatial Resolution: Point resolution
Temporal Coverage: 1983-06-21 to 1985-08-05
Temporal Resolution: Each plot was sampled once
Study Area (All latitude and longitude given in decimal degrees)
| Site | Westernmost Longitude | Easternmost Longitude | Northernmost Latitude | Southernmost Latitude |
|---|---|---|---|---|
| Oumalik, Alaska | -156.02 | -155.899 | 69.86229 | 69.83724 |
Data File Information
There are three data files with this data set in comma-separated (.csv) format. The files provide the vegetation species found at 87 plots as well as the percent ground cover occupied by the species, soil characterization, plot environmental data, and estimated disturbance by various sources. These data may also be found in the TURBOVEG database. There are also three companion files which provide plot photos and research information.
Table 1. Data files
| Data File Name | Description |
|---|---|
| oumalik_environmental_data.csv | Environmental characterization data for Oumalik research plots |
| oumalik_soils_data.csv | Soil analysis data |
| oumalik_species_data.csv | The estimated percent land cover by species per plot |
| Companion files | Description |
| Oumalik_Plot_Photos.pdf | Photos of the plots at Oumalik in .pdf format |
| Oumalik_Veg_Plots_Report.pdf | Report which provides details of the research (Ebersole, 1985) |
| Ordinal_Scales_Oumalik_Env_data.pdf | A pdf with ordinal scale tables from the Ebersole 1985 document. The ordinal scales are used in the data file oumalik_environmental_data.csv |
| Oumalik_Veg_Plots.pdf | A pdf of this guide document |
Table 2. Variables in the file oumalik_environmental_data.csv
Refer to the companion file Ordinal_Scales_Oumalik_Env_data.pdf for the ordinal scale descriptions and associated codes. Data not provided are represented as -9999.
| Column number | Variable | Units/format | Description |
|---|---|---|---|
| 1 | plot_number | numeric | Plot number as provided by the author |
| 2 | date | yyyymmdd | Date plot was investigated |
| 3 | latitude | decimal degrees | Plot latitude |
| 4 | longitude | decimal degrees | Plot longitude |
| 5 | community | code | Plant community |
| 6 | plant_community_name | text | Plant community name |
| 7 | microrelief_type | code | Microrelief type: 1=featureless, flat 2=tussocks 3=reticulate-patterned ground 4=low-centered polygon center 5= low-centered polygon rim 6= low-centered polygon trough 7=high-centered polygon center 8= high-centered polygon trough 9=palsa 10=irregular 11=mounds of bladed material 12=ruts of multi-pass trail 13=thermokarst 14=irregularly rough, caused by moderate surface disturbance leaving surface changed but not removed 15=bladed and smothed 16=area bladed below original surface 17=graveled area |
| 8 | microrelief_ht | cm | Microrelief height |
| 9 | releve_area | m2 | Releve area |
| 10 | releve_shape | text | Releve shape |
| 11 | cover_tree_layer | % | Percent of trees in the plant community |
| 12 | cover_shrub_layer | % | Percent of shrubs in the plant community |
| 13 | cover_tall_shrubs | % | Percent of tall shrubs in the plant community |
| 14 | cover_low_shrubs | % | Percent of low shrubs in the plant community |
| 15 | cover_erect_dwarf_shrubs | % | Percent of erect dwarf shrubs in the plant community |
| 16 | cover_prostrate_dwarf_shrubs | % | Percent of prostrate dwarf shrubs in the plant community |
| 17 | cover_graminoids | % | Percent of graminoids in the plant community |
| 18 | cover_tussock_graminoids | % | Percent of tussock graminoids in the plant community |
| 19 | cover_forbs | % | Percent of forbs in the plant community |
| 20 | cover_seedless_vascular_plants | % | Percent of seedless vascular plants in the plant community |
| 21 | cover_mosses_liverworts | % | Percent of mosses and liverworts in the plant community |
| 22 | cover_lichen_layer | % | Percent of plot that was lichen |
| 23 | cover_crust | % | Percent of plot that was crust |
| 24 | cover_algae_layer | % | Percent of plot that was algae |
| 25 | cover_bare_soil | % | Percent of plot that was bare soil |
| 26 | cover_bare_rock | % | Percent of plot that was bare rock |
| 27 | cover_water | % | Percent of plot that was open water |
| 28 | cover_litter_layer | % | Percent of plot that was litter |
| 29 | cover_total | % | Percent of plot that had cover |
| 30 | canopy_ht | cm | Mean canopy height |
| 31 | tree_layer_ht | m | Mean tree height |
| 32 | shrub_layer_ht | cm | Mean shrub height |
| 33 | herb_layer_ht | cm | Mean herb height |
| 34 | moss_layer_ht | cm | Mean moss height |
| 35 | aspect | degrees | Aspect |
| 36 | slope | degrees | Plot slope |
| 37 | thaw_depth | cm | Thaw depth |
| 38 | water_depth | cm | Water depth |
| 39 | site_moisture | ordinal scale | Site moisture observations noted using an ordinal scale of 1-10 |
| 40 | summer_air_temp | ordinal scale | Site air temperature observations noted using an ordinal scale of 1-10 |
| 41 | duration_snow | ordinal scale | Snow cover and duration recorded using an ordinal scale of 1-10 |
| 42 | wind_regime | ordinal scale | Wind conditions noted using an ordinal scale of 1-10 |
| 43 | age_surface | ordinal scale | Age of surface and time since the surface was disturbed noted using an ordinal scale of 1-10 |
| 44 | surface_stability | ordinal scale | Surface stability with regard to avalanches, surface movements due to floods, etc. noted using an ordinal scale of 1-10 |
| 45 | cryoturbation | ordinal scale | Cryoturbation (0-100%) noted using an ordinal scale of 1-10 |
| 46 | disturbance_type | code | Disturbance of site: 1=undisturbed, 2=naturally disturbed, and 3=anthropogenically disturbed |
| 47 | disturbance_intensity | ordinal scale | Physical disturbance intensity of the site surface by animals, people, or equipment, noted using an ordinal scale of 1-7 |
| 48 | disturbance_score | ordinal scale | Disturbance score at site noted using an ordinal scale of 1-10 |
| 49 | disturbance_caribou | ordinal scale | Site disturbance by Caribou noted using an ordinal scale of 1-10 |
| 50 | disturbance_microtine | ordinal scale | Signs of site disturbance by microtine noted using an ordinal scale of 1-10 |
| 51 | disturbance_squirrel | ordinal scale | Signs of site disturbance (ground disturbance) by squirrels noted using an ordinal scale of 1-10 |
| 52 | disturbance_ptarmigan | ordinal scale | Signs of site disturbance by ptarmigan noted using an ordinal scale of 1-10 |
| 53 | disturbance_birds | ordinal scale | Signs of site disturbance by birds noted using an ordinal scale of 1-10 |
| 54 | disturbance_insects | ordinal scale | Signs of site disturbance by insects noted using an ordinal scale of 1-10 |
| 55 | disturbance_other_animals | ordinal scale | Signs of site disturbance from other animals noted using an ordinal scale of 1-10 |
| 56 | disturbance_total_animals | ordinal scale | Site disturbance from all animal categories, noted using an ordinal scale of 1-10 |
| 57 | comments | text | Comments |
Table 3. Variables in the file oumalik_soil_data.csv
Soil samples were collected at 10-cm depth. Data not provided are represented as -9999.
| Column number | Variable | Units/format | Description |
|---|---|---|---|
| 1 | plot_number | Plot number as provided by the author | |
| 2 | date | yyyymmdd | Date sampled |
| 3 | latitude | decimal degrees | Plot latitude |
| 4 | longitude | decimal degrees | Plot longitude |
| 5 | community | code | Plant community |
| 6 | plant_community_name | text | Plant community name |
| 7 | sand | % | Percentage of sand in the soil |
| 8 | silt | % | Percentage of silt in the soil |
| 9 | clay | % | Percentage of clay in the soil |
| 10 | soil_moisture | ordinal scale | Estimated soil moisture |
| 11 | hygroscopic_moisture | % | Hygroscopic moisture in soil provided as a percent. The weight loss of soil from air to dry weight (105 degrees C) relative to oven dry weight |
| 12 | organic_matter | % | Organic matter in soil provided as percent |
| 13 | water_absorption | % | Water absorption provided as percent. Defined as the weight of water absorbed upward into soil relative to oven dry weight |
| 14 | field_capacity | % | Field capacity provided as percent. Defined as the weight of water retained by soil in pressure membrane apparatus with pressure differential of 1/3 bar, relative to oven dry weight |
| 15 | wilting_point | % | Wilting point provided as percent. Determined using a pressure membrane apparatus, 15 bars |
| 16 | available_water | % | Available water in soil provided as percent. Defined as the difference between field capacity and the wilting point |
| 17 | carbonates | % | Carbonates in soil provided as percent |
| 18 | pH | Soil PH | |
| 19 | NH4 | PPM | Total available soil ammonium content provided in parts per million (PPM) |
| 20 | NO3 | PPM | Total available soil nitrate content provided in parts per million (PPM) |
| 21 | N | PPM | Total available soil nitrogen content provided in parts per million (PPM), defined as the sum of N-NO3 and N-NH4 |
| 22 | P | PPM | Total available soil phosphorus content provided in parts per million (PPM) |
| 23 | K | PPM | Total available soil potassium content provided in parts per million (PPM) |
| 24 | Ca | PPM | Total available soil calcium provided in parts per million (PPM) |
| 25 | Mg | PPM | Total available soil magnesium provided in parts per million (PPM) |
| 26 | cation_ex_capacity | MEQ/100 G | Cation exchange capacity |
Table 4. Variables in the file oumalik_species_data.csv
| Column number | Column header | Description |
|---|---|---|
| 1 | PASL_taxon_scientific_name | Current nomenclature according to the Panarctic Species List (PASL) |
| 2 | PASL_taxon_scientific_name_author | Current nomenclature according to the Panarctic Species List (PASL) with the data authors name |
| 3 | dataset_taxon | Data set taxonomy |
| 4-90 | TURBOVEG_plot_accession_number and dataset_plot_number_author | Two rows of 87 column headers which are plot numbers/accession numbers. The first row is TURBOVEG accession numbers. Column headers= 10545-10631. The 2nd row is dataset_plot_number_author, the plot numbers as named in the original data set; column headers= numbers 24 – 269 (nonsequential #s). The data values are the estimated percent land cover by species per plot according to the the Ordinal cover-abundance scale 1-9 (modified from Westhoff and Maarel 1978) where: 0= (none present) 1 (covers less than 1%) 2 (covers 1 %) 3 (covers 2 to 3%) 4 (covers 4-5%) 5 (covers 6 to 12%) 6 (covers 13 to 24%) 7 (covers 25 to 49%) 8 (covers 50 to 74%) 9 (covers 75 to 100%) |
Taxa are listed in alphabetical order according to the accepted PASL name. In three instances, taxa were lumped into a single taxon in the PASL:
1) Campylium hispidulum (Campylium hispidulum and Campylium sommerfeltii)
2) Dicranum spadiceum (Dicranum angustum and Dicranum spadiceum)
3) Peltigera canina (Peltigera canina and Peltigera canina f. sorediata).
Refer also to the companion file Oumalik_Veg_Plots_Report.pdf (Ebersole, 1985), Appendix: Tables B1 and B3.
Table 5. Example data from the file oumalik_species_data.csv
| TURBOVEG_plot_accession_number | 10545 | 10546 | 10547 | 10548 | ||
| dataset_plot_number_author | 24 | 44 | 70 | 71 | ||
| PASL_taxon_scientific_name | PASL_taxon_scientific_name_author | dataset_taxon | ||||
| Alectoria ochroleuca | Alectoria ochroleuca (Hoffm.) Massal. | Alectoria ochroleuca | 0 | 0 | 0 | 0 |
| Amblystegium serpens | Amblystegium serpens (Hedw.) B. S. G. | Amblystegium serpens | 0 | 0 | 0 | 0 |
| Andromeda polifolia | Andromeda polifolia L. | Andromeda polifolia | 0 | 0 | 0 | 0 |
Application and Derivation
These data are useful to policies regarding energy development in the northern Alaska region and the resulting environmental impacts. They could also be useful to climate change studies.
Quality Assessment
Refer to the companion file Oumalik_Veg_Plots_Report.pdf
Data Acquisition, Materials, and Methods
Site Description
This study was conducted to address the environment, ecosystems, and disturbances to the vegetation around a test oil well at Oumalik, Alaska, erected during 1949 and abandoned in 1950. The well construction activities caused a great deal of damage to the tundra from construction of an airport, heavy vehicles, equipment hauling, bulldozing, and operations. Many barrels and other debris were left after the well was abandoned.
Oumalik is in the continuous zone of permafrost with frost boils and frost scars. Vegetation cover on the frost scars ranges from none to nearly complete. Soils are generally poorly developed with little variation. Vegetation classification defined 23 natural and 13 disturbed vegetation communities (Ebersole,1985). Permafrost on the Arctic Coastal Plain frequently has a lot of ground ice. Ice lenses are horizontal layers of ice 1 mm to tens of meters thick and several mm to hundreds of mm in extent, and ice wedges are important component of the ground ice at Oumalik (Ebersole, 1985).
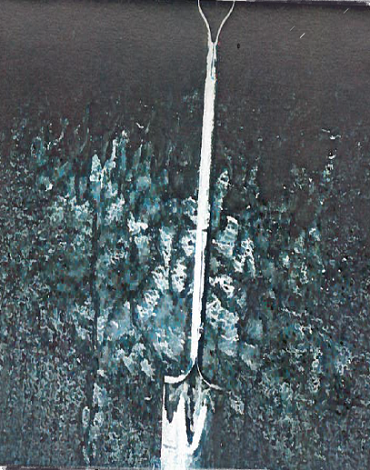
Figure 2. Ice lenses at the Oumalik study site. The ice lenses are several cm long (Ebersole, 1985).
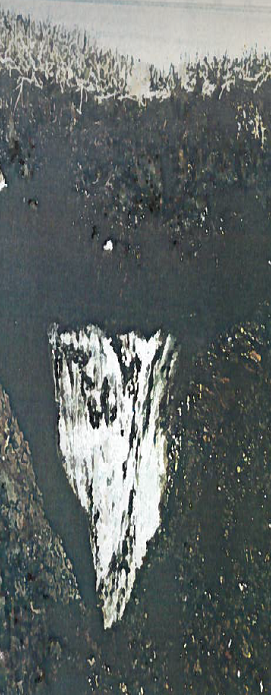
Figure 3. Ice wedge at the Oumalik study site. The ice wedge is about 80 cm wide (Ebersole, 1985).
Methods
Vegetation Data
Eighty-four recovery plots were established in July of 1979 by removing debris from the places where they had been since 1950. Three larger plots were established in late July 1980, after the cleanup. Of the 87 plots, 54 were located in natural habitats and 33 in anthropogenically disturbed habitats. A classification of the vegetation was done to provide communities for comparison to the natural vegetation, including disturbances, and an ordination of the disturbed vegetation showed the environmental factors that correlated most highly with the variation in vegetation (Ebersole, 1985)..
The vegetation within about three km of the test well was sampled using the releve method (Westoff and Maarel 1978, Mueller-Dombois and Ellenberg 1974). Sample sites were chosen to represent the full range of vegetation in the area with replication. Sites were chosen for uniformity in floristic composition and environmental conditions. Plot sizes were about 25 m2. Plot locations were marked with a stake and on aerial photographs.
At each plot, plants that were identifiable were listed, and those uncertain were (mosses and lichens ) were collected for identification in a laboratory or verified by experts. Estimated ground cover data (percent) are provided in the environmental data file. Species data are provided in the species data file (refer to Section 2, Table 2 of this document).
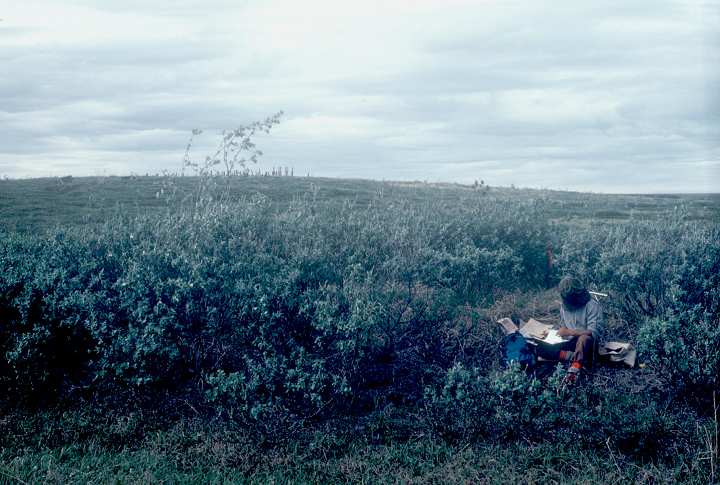
Figure 4. Figure 4. Vegetation plot photo at Oumalik, Alaska (Ebersole, 1985).
Site Environmental Data
At each site, environmental factors and disturbances at each plot (refer to Section 2, Table 2 of this document) were measured or estimated:
- Percent ground cover was noted using a slight modification of the method of Westhoff and Maarel (1978) as the ground cover was taken in percent rather than the Braun-Blanquet cover-abundance values. The Braun-Blanquet table method was used to determine the vegetation communities (Ebersole, 1985).
- Ordinal scales were used to note temperature, site moisture, wind, surface stability, and disturbances. These scales were taken from Walker et al., (1979), modified from Komarkova (1979).
- Aerial photographs and Google Earth were used to obtain latitude and longitude data in 2014.
Soil samples were collected at 10-cm depth for physical and chemical analysis performed at the INSTAAR Sedimentology Laboratory and the University of Alaska, respectively. Soil analysis data are provided in a separate data file (refer to Section 2, Table 2 of this document).
Refer to the companion file Oumalik_Veg_Plots_Report.pdf for detailed information regarding this study.
Data Access
These data are available through the Oak Ridge National Laboratory (ORNL) Distributed Active Archive Center (DAAC).
Arctic Vegetation Plots at Oumalik, AK, 1983-1985
Contact for Data Center Access Information:
- E-mail: uso@daac.ornl.gov
- Telephone: +1 (865) 241-3952
References
Ebersole, J.J. 1985. Vegetation Disturbance and Recovery at the Oumalik Oil Well, Arctic Coastal Plain, Alaska. PhD thesis, University of Colorado, Boulder, Colorado, USA.
Komarkova, V. 1979. Alpine Vegetation of the Indian Peaks area, Front Range, Colorado Rocky Mountains. Vegetatio 42:149-163.
Mueller-Dombois, D. and H. Ellenberg. 1974. Aims and Methods of Vegetation Ecology. Wiley, New York. 547 p.
Walker, D.A., P.J. Weber, and V. Komarkova. 1979. A large-scale (1:6000) Vegetation Mapping Method for North Alaska. Plant Ecology Laboratory, Institute of Arctic and Alpine research, University of Colorado, Boulder. 48 p.
Westhoff, V., and E. van der Maarel. 1978. The Braun-Blanquet approach. Pages 287-399 in R. H. Whittaker, editor. Classification of plant communities. Dr. W. Junk, Den Haag.