Documentation Revision Date: 2018-05-15
Data Set Version: 1
Summary
There are 184 tabular data files (46 each of NDVI and NBR, 46 of trend analysis results, and 46 of site metadata) in comma-delimited format (*.csv) and 46 files in GeoTIFF format (*.tif) with the locations of the 500-m MODIS pixels for each site included in this dataset.
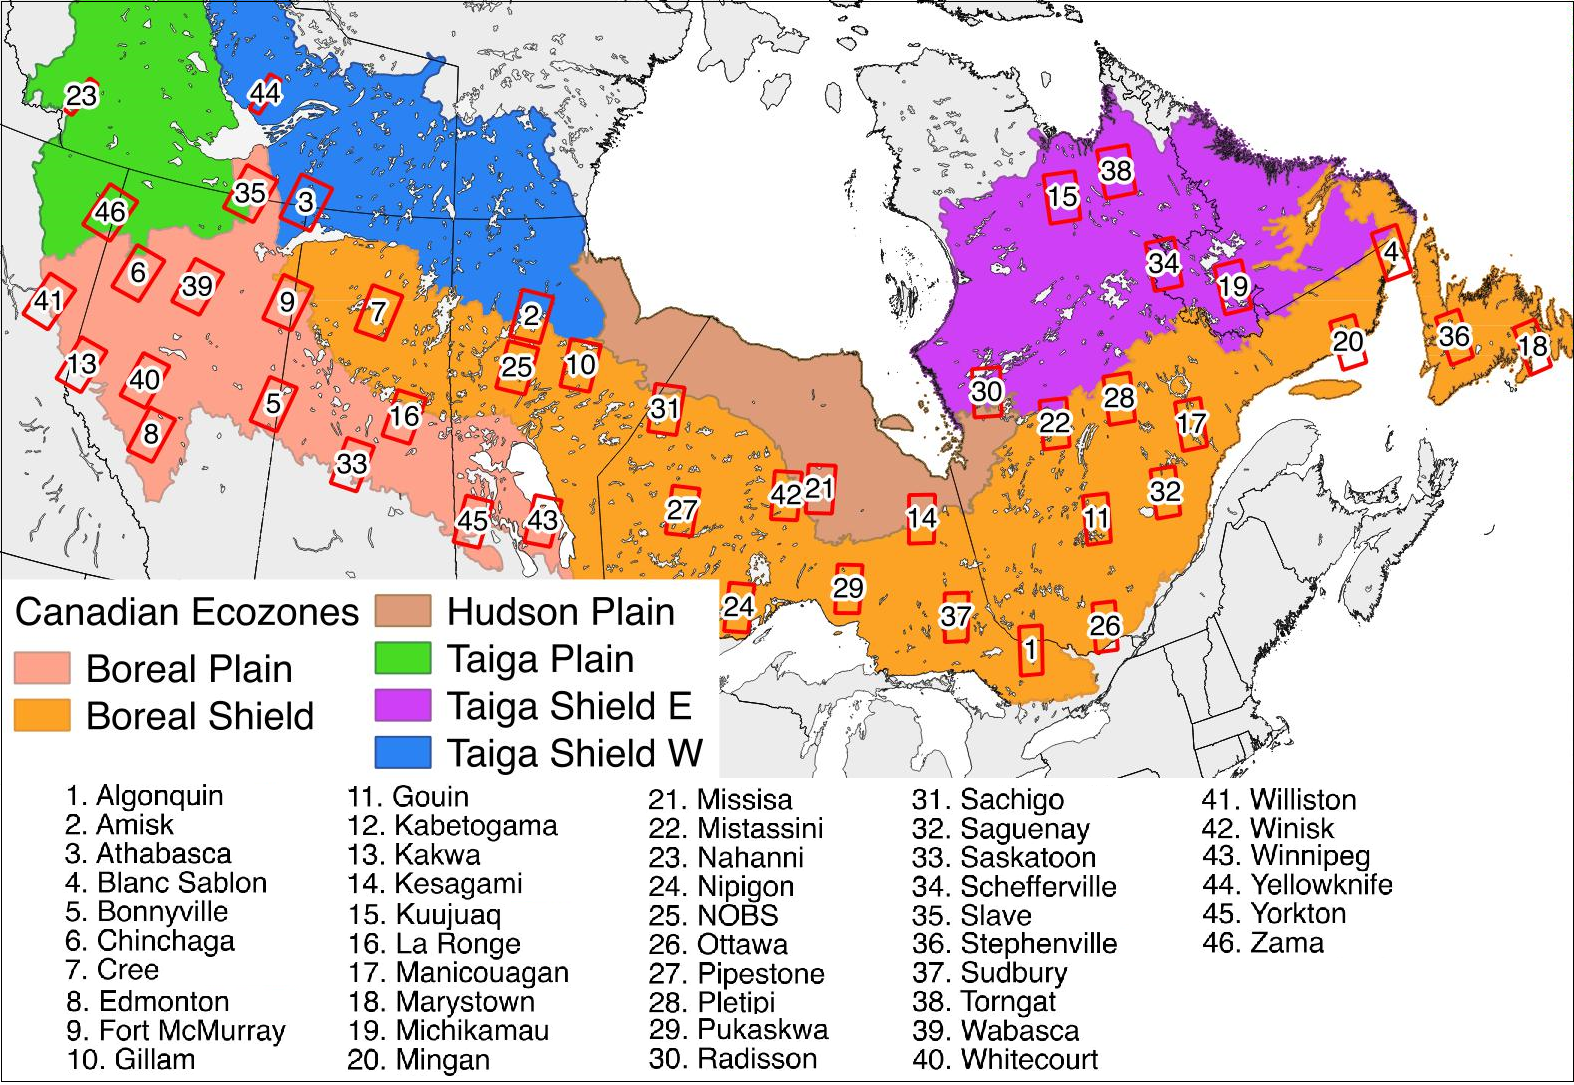
Figure 1. The Canadian boreal forest study area and the 46 sites used in the analyses (identified by red boxes) mapped on top of ecozones. Figure from Sulla-Menashe et al. (2018)
Citation
Sulla-Menashe, D., M.A. Friedl, C. Woodcock, and E.K. Melaas. 2018. ABoVE: Peak Greenness for Canadian Boreal Forest from Landsat 5 TM Imagery, 1984-2011. ORNL DAAC, Oak Ridge, Tennessee, USA. https://doi.org/10.3334/ORNLDAAC/1587
Table of Contents
- Data Set Overview
- Data Characteristics
- Application and Derivation
- Quality Assessment
- Data Acquisition, Materials, and Methods
- Data Access
- References
Data Set Overview
This dataset provides a 28-year time series of peak greenness (NDVI) data derived from Landsat 5 TM imagery over the boreal forest region of Canada. Landsat 5 TM scenes were collected for 46 selected sidelap sites along gradients in climate, tree cover, and disturbance history from 1984 to 2011. Peak-greenness reflectance was computed for 30-m Landsat pixels using the maximum normalized difference vegetation index (NDVI) along with the normalized burn ratio (NBR) during the period between days of the year (DOY) 180 and 204. To facilitate trend analysis at each site, the NDVI and NBR data of the 30-m Landsat pixels were regridded to the coarser MODIS 500-m (463.3-m) spatial scale to reduce the effects of missing data and to enhance the significance of the trend. The regridded NDVI and NBR 28-year time series data at 500-m resolution are provided for each of the 46 sites. Two trend analyses were run on the 500-m resolution data and are reported for each site. Supplemental site metadata are also provided, including the number of valid Landsat pixels, land cover composition, and disturbance history, for each 500-m pixel.
Project: Arctic-Boreal Vulnerability Experiment
The Arctic-Boreal Vulnerability Experiment (ABoVE) is a NASA Terrestrial Ecology Program field campaign based in Alaska and western Canada between 2016 and 2021. Research for ABoVE links field-based, process-level studies with geospatial data products derived from airborne and satellite sensors, providing a foundation for improving the analysis and modeling capabilities needed to understand and predict ecosystem responses and societal implications.
Related Publication:
Sulla-Menashe, D, Woodcock. C. E., and Friedl, M. A. (2018). Canadian boreal forest greening and browning trends: an analysis of biogeographic patterns and the relative roles of disturbance versus climate drivers. Environmental Research Letters, 13(1): 1-8 https://dx.doi.org/10.1088/1748-9326/aa9b88.
Related Dataset:
Melaas, E.K., M.A. Friedl, and D. Sulla-Menashe. 2018. Landsat-derived Spring and Autumn Phenology, Eastern US - Canadian Forests, 1984-2013. ORNL DAAC, Oak Ridge, Tennessee, USA. https://doi.org/10.3334/ORNLDAAC/1570
Acknowledgments:
This study was funded by the NASA Terrestrial Ecology Program (NASA grant NNX14AD57G) and also supported later work for the Arctic-Boreal Vulnerability Experiment (NASA grant NNX15AU63A). A special thanks is given to Chris Holden for developing software used to pre-process Landsat data.
Data Characteristics
Spatial Coverage: Boreal forest of Canada
Spatial Resolution: 500-m (463.3-m)
Temporal Coverage: 1970-01-01 to 2014-12-31
Temporal Resolution: Annual
Study Area: (all latitudes and longitudes given in decimal degrees)
| Site | Northernmost Latitude | Westernmost Longitude | Easternmost Longitude | Southernmost Latitude |
|---|---|---|---|---|
| Boreal forest of Canada | 63.441 | -124.474 | -53.915 | 45.321 |
Data File Information
There are 184 tabular data files (46 each of NDVI and NBR, 46 of trend analysis results, and 46 of site metadata) in comma-delimited format (*.csv) and 46 files in GeoTIFF format (*.tif) with the locations of the 500-m MODIS pixels for each site included in this dataset.
The CSV files for each site include:
- two time series tables ({site}-ndvi.csv and {site}-nbr.csv),
- a trends analysis results table ({site}-trends.csv), and
- a metadata table ({site}-meta.csv), for a total of four files per site.
The two time series csv files ({site}-ndvi.csv and {site}-ndvi.csv) for each site contain the full 28 year (1984-2011) Landsat 5 time series for each 500-m pixel for two vegetation indices: NDVI and NBR. For each year in the time series, the maximum NDVI values were averaged for the Landsat pixels within each panel. The time series csvs each have 29 columns, one for each year between 1984-2011 and have the same row order as the metadata table.
The trends csv file ({site}-trends.csv) has 11 columns. The columns of this table are described in Table 2 and include the trends and significance of two trend tests for each 500-m pixel.
The metadata tables ({site}-meta.csv), contain 110 columns including the land cover composition, and disturbance history for each 500-m pixel. The second column is the most important and identifies the row id of the MODIS-based pixel. Since the rows of the other tables have the exact same order for each site, this id serves as a unique id across all the other sites. Table 3 describes the other columns in this table.
Note that the first row in all the csv files represents the aggregation of all MODIS pixels with ids of 0. ids of 0 represent the empty space between landscape patches that were removed during pre-processing. That row should be removed before any analysis.
GeoTIFF (*.tif) format files:
The GeoTIFF files ({site}-ids.tif; 46) contain the spatial locations of the row ids in the respective site CSV files.
The GeoTIFF contains the row ids for each site mapped out into their native UTM projection. Each file is a single band raster with unsigned long (uint32) data type and 0 as fill values.
Table 1. Column descriptions for the time series tables ({site}-ndvi.csv and {site}-nbr.csv),
| Column number | Column name | Description |
|---|---|---|
| 1 | (blank) |
Index/row id for MODIS pixel id (panel_id). Data rows 3 - “N” are all the MODIS pixels in the {site}. Cross reference to {site}-trends.csv to get MODIS pixel. The first row represents the aggregation of all MODIS pixels (Panels) with ids of 0. All values are -9999. Panels with 0 are patch edges in the scene and should be ignored. This is true for the first row in all *.csv files. The first row of {site}-meta.csv has summary counts. |
|
2 - 29 |
YYYY |
Columns are the yearly averages of maximum NDVI or NBR for the 28-year time series (1984-2011) of Landsat TM 5 pixels within each MODIS panel. |
Table 2. Column descriptions for the {site}-trends.csv tables.
| Column number | Column name | Description |
|---|---|---|
| 1 | (blank) | Index/row id for MODIS pixel (panel id). |
| 2 | id |
Same as the panel id in the {site}-meta.csv table and the rows are in the same order. The first row represents the aggregation of all MODIS pixels (Panels) with ids of 0. All trend values are -9999. Panels with 0 are patch edges in the scene and should be ignored. This is true for the first row in all *.csv files. |
| 3 | num | Count of the valid Landsat pixels inside the MODIS pixel (panel id). |
| 4 | plm_s_ndvi | Significance of the panel linear model (plm) for NDVI based on the plm package in R |
| 5 | plm_t_ndvi | Trend of the panel linear model for NDVI |
| 6 | zyp_s_ndvi | Significance of the linear model for NDVI based on the Mann-Kendall trend test run in R using the zyp.zhang package in R |
| 7 | zyp_t_ndvi | Trend of the linear model for NDVI based on the Theil-Sen estimator run in R using the zyp.zhang package. |
| 8 | plm_s_nbr | Significance of the panel linear model for NBR |
| 8 | plm_t_nbr | Trend of the panel linear model for NBR |
| 10 | zyp_s_nbr | Significance of the linear model for NBR |
| 11 | zyp_t_nbr | Trend of the linear model for NBR |
* Trends, NDVI, and NBR calculated from AVHRR are not included in this dataset.
Table 3. Column descriptions for the {site}-meta.csv tables.
| Column number | Column name | Description |
|---|---|---|
| 1 | (blank) | Index/row id for MODIS pixel (panel id). |
| 2 | panel_id |
Derived from MODIS pixel location (y*19200+x). The first row represents the aggregation of all MODIS pixels (Panels) with ids of 0. All trend values are -9999. Panels with 0 are patch edges in the scene and should be ignored. This is true for the first row in all *.csv files. |
| 3 | npix | Count of the valid Landsat pixels inside the panel |
| 4 | avhrr_id | Derived from the AVHRR pixel location (y*4320+x). Can be used to link data with the AVHRR GIMMS 3g dataset. * |
| 5 | npix_avhrr | Number of AVHRR pixels that intersect the current panel * |
| 6 | npatches | Number of landscape patches that intersect the current panel |
| 7 | sum_water | Count of water pixels from the 30-m spatial resolution EOSD land cover map |
| 8 | sum_nveg | Count of non-vegetated land pixels |
| 9 | sum_nfor | Count of non-forested vegetation pixels |
| 10 | sum_for | Count of forested vegetation pixels |
| 11 | sum_nl | Count of needleleaf forest pixels. Note that this and other forested category nest within the forested vegetation count. |
| 12 | sum_bl | Count of broadleaf forest pixels |
| 13 | sum_mix | Count of mixed forest pixels. In previous analyses we combined the mixed forests with the broadleaf forest category. |
| 14 | sum_wet | Count of forested wetland pixels. In previous analyses we combined the forested wetland with the needleleaf forest category. |
| 15 | sum_dist | Count of total disturbed pixels across all years as a sum of there-disturbance and the in-house CCDC disturbance detection. Note that the CCDC disturbance detection only covers the period 1984-2014 and the Canadian Large Fire Database goes back until the early 1900s in some regions. |
| 16 | num_dist | Count of total disturbance events by treating disturbances from different years as different events |
| 17 | dist_early | Count of total disturbances prior to 1970 |
| 18-62 | 1970-2014 | Total disturbances for each year between 1970 to 2014 |
| 63 | sum_fire | Count of total fire disturbed pixels across all years according to the Canadian Large Fire Database (Stocks et al., 2002) |
| 64 | num_fire | Count of total |
| re-disturbance events by treating | ||
| res from different years as different events | ||
| 65 | fire_early | Count of total fire disturbances prior to 1970 |
| 66-110 | 1970-2014 | Total fire disturbances for each year between 1970 to 2014 |
Application and Derivation
The vegetation trends and disturbance data included in this dataset are useful for characterizing the nature and magnitude of greening and browning directly associated with climate change.
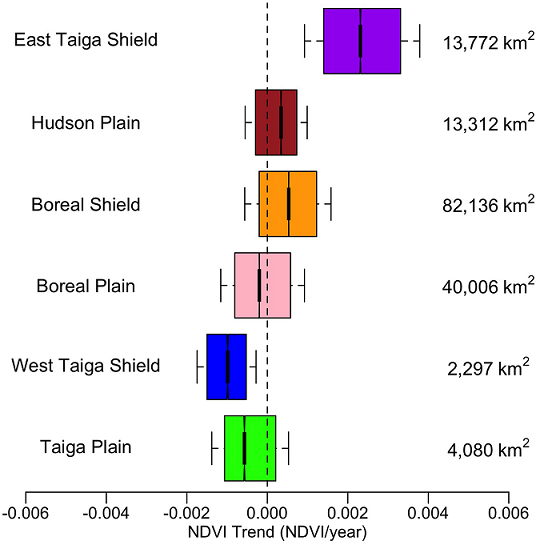
Figure 2. Boxplots of significant NDVI trends for undisturbed forest areas grouped by ecozone (Ecological Stratification Working Group 1996; see Figure 1), with eastern ecozones plotted on the top and western ecozones on the bottom. The numbers to the right of the plot show the total area covered by Landsat pixels in each category. (from Sulla-Menashe et al. 2018)
Quality Assessment
Sources of bias and uncertainty within the time series were carefully considered. These considerations are described in Sulla-Menashe et al. (2018).
Data Acquisition, Materials, and Methods
This dataset combines satellite time series data from the Landsat sensors from 46 sites spread across the Canadian boreal forest (Figure 1). The shape of each site represents the overlap (slidelap) between two adjacent Landsat paths in the WRS2 path/row system. For each site, 28 years of Landsat 5 Thematic Mapper (TM) data were collected and the maximum greenness observations for each Landsat pixel for that year were identified. Before performing our analyses, we preprocessed the image time series at each site to remove ephemeral contamination from clouds and other atmospheric effects that were not screened by the USGS (Zhu and Woodcock 2012).
Two indices were calculated from the peak-summer greenness observations for vegetated pixels, the Normalized Difference Vegetation Index (NDVI) and the Normalized Burn Ratio (NBR). We then extracted maximum NDVI values at each pixel for each growing season, which we define here as occurring between day of year 180 and 240 (June 29–August 28 in nonleap years) (Sulla-Menashe et al 2016).
At each Landsat pixel land cover information was identified based on a single date Landsat-scale land cover map for Canada for the year 2000 (Wulder et al. 2008). Disturbance history for each pixel was derived from two sources, the Canadian Large Fire Database (Stocks et al. 2002; Figure 3) and a disturbance map based on the Continuous Change Detection and Classification algorithm (Zhu et al. 2012) run on all available Landsat data at each pixel.
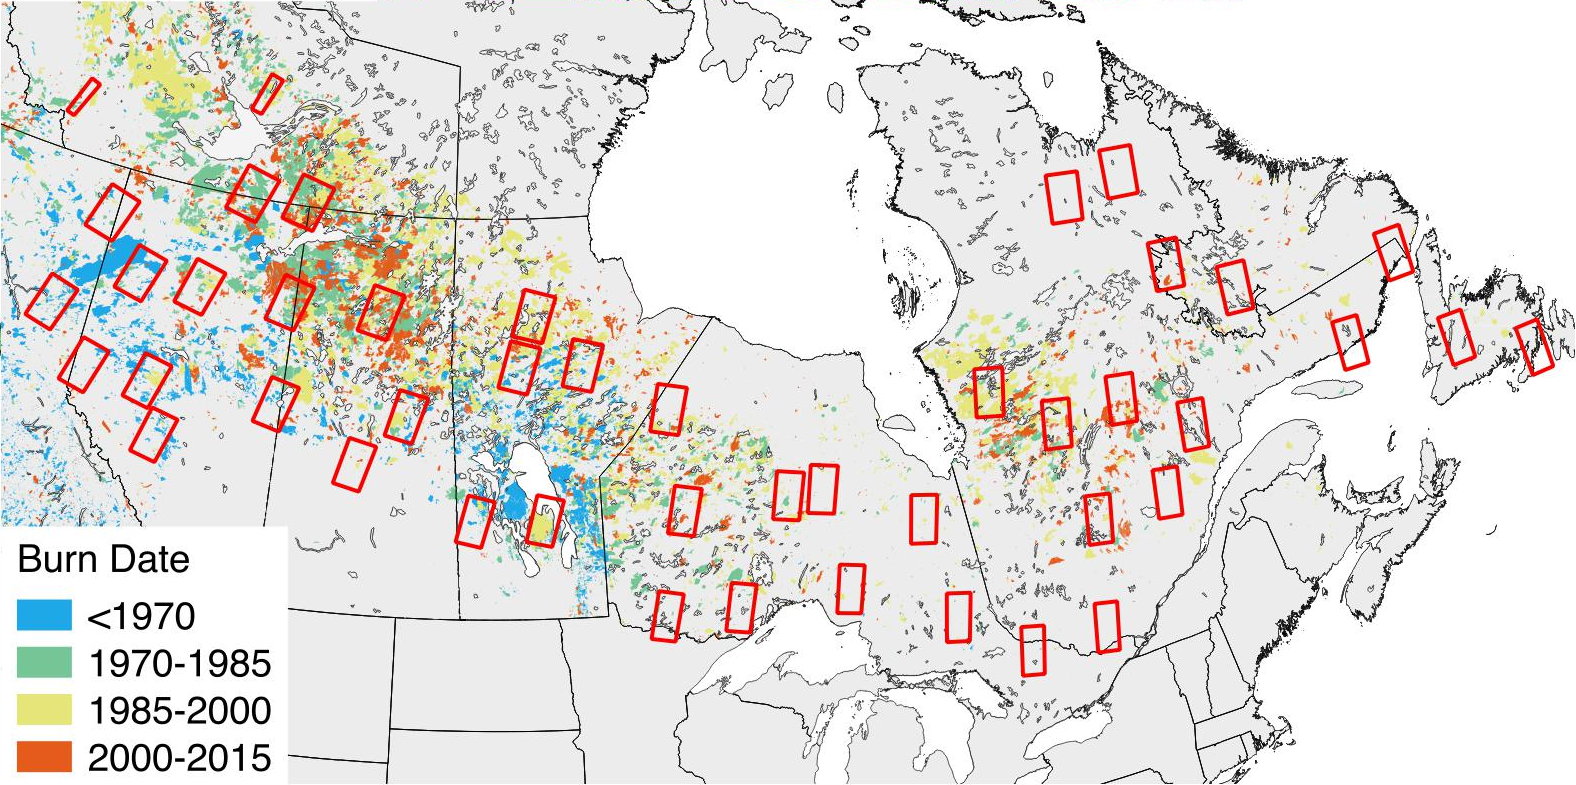
Figure 3. The Canadian boreal forest study area and the 46 sites used in the analysis mapped on top of fire disturbance data from the Canadian Large Fire Database (Stocks et al. 2002). Figure from Sulla-Menashe et al. (2018)
Prior to trends analysis, the Landsat pixels were aggregated to MODIS 500-m (463.3-m) pixel scale to reduce the impact of noisy and missing Landsat observations. In addition, the land cover information was used to derive patches of homogeneous land cover types and the edges (Landsat pixels) between patches of different land cover types were removed from further analysis. The the resulting MODIS pixels for each site were treated as panels and each is associated with a unique panel id that is the same as the row ids in the CSVs.
Trend analyses
Trends were detected according to two methods on the MODIS 500-m (463.3-m) pixel scale 28-year time series data. For the first method, linear trends were estimated on the panel means of NDVI and NBR using the zyp.zhang package in R. In the second method, panel linear models were run through time using the plm package in R. The land cover and disturbance information are provided as counts of each category for each panel. The average of the peak NDVI and NBR observations are provided for each panel for each year in the time series. As are the slope and significance of linear trends detected according to the zyp and plm methods. See Sulla-Menashe et al. (2018) for more details.
Spatial data connection to CSV files
GeoTIFFs that link the panel_id in the CSV files to their spatial information are also provided. Rows within the NDVI and NBR files ({site}-ndvi.csv and {site}-nbr.csv) represent the average across all Landsat pixels within each panel. Each row corresponds to one panel. The row number, counted sequentially from top to bottom, can be linked with the row number in each site's metdata file ({site}-meta.csv). The panel_id column in a site's metadata file can be used in conjunction with a site's GeoTIFF to determine the spatial extent of each panel. GeoTIFF pixel values correspond to the panel_id in the metadata file.
MODIS Pixels
The MODIS panel id or row id is derived from a Sinusoidal grid that covers most of North America. The x and y coordinates from that grid were used to compute the 0-indexed panel id from the equation y*19200 + x. The upper left corner of this grid is the upper left corner of MODIS tile h08v02 and it extends 8 columns eastward (to h15v02) and 5 tiles south (to h15v06) for a total of 12000 rows by 19200 columns. The spatial characteristics of this grid are shown below:
Upper Left corner (x, y) = (-11119505.197, 7783653.638)
Lower Right corner = (-2223901.039, 2223901.039)
Pixel Size (m) = 463.312716525
Columns, Rows = 19200, 12000
PROJ4: +proj=sinu +a=6371007.181 +b=6371007.181 +units=m
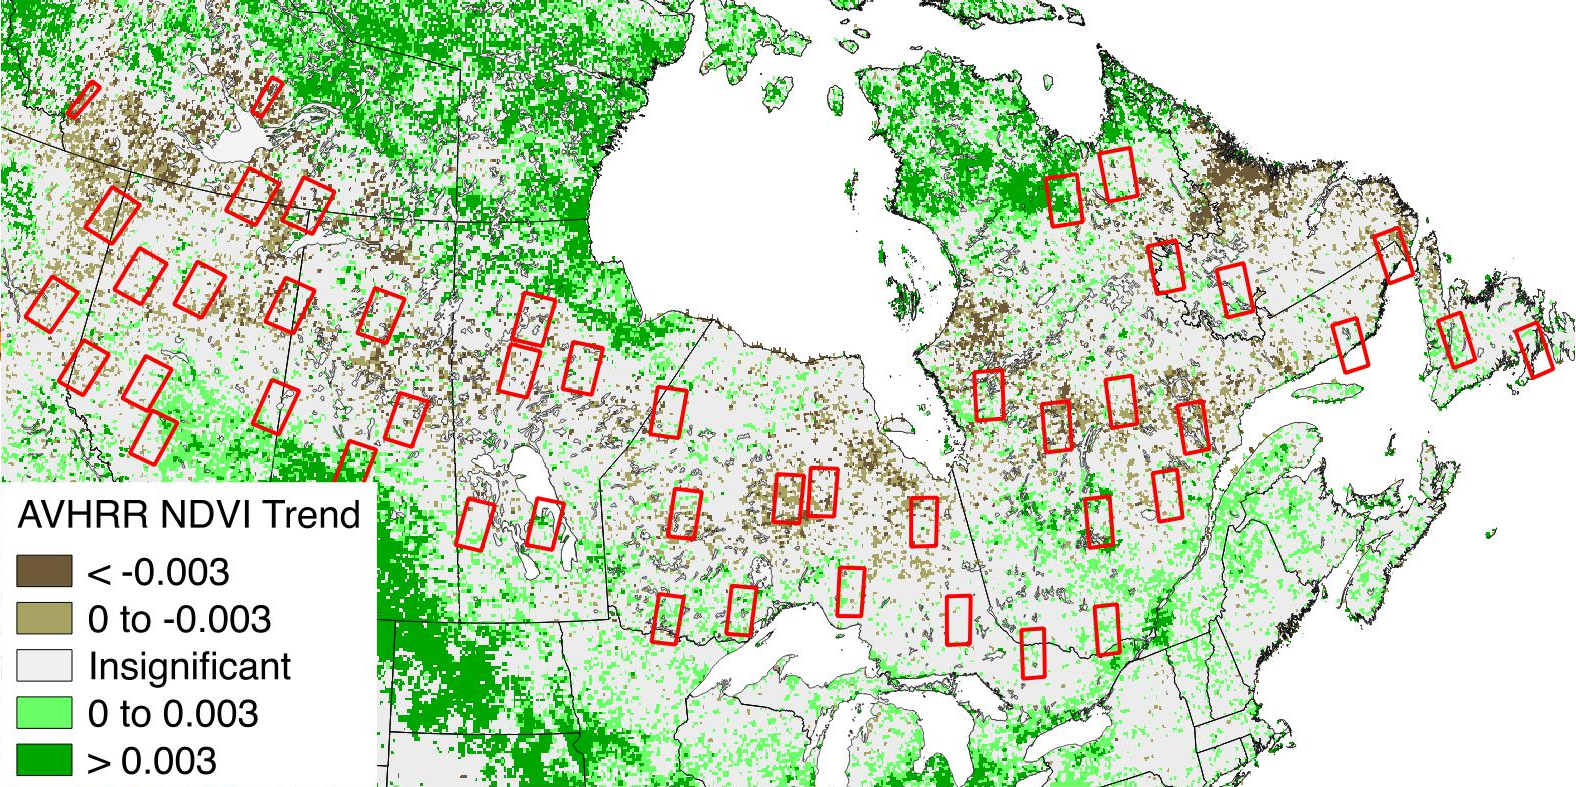
Figure 4. The Canadian boreal forest study area and the 46 sites used in the analysis mapped on top of AVHRR NDVI trends from Beck and Goetz (2011). Figure from Sulla-Menashe et al. (2018)
AVHRR connection
Two columns (avhrr_id and npix_avhrrr) in the metadata table ({site}-meta.csv) can be used to related the MODIS pixels to AVHRR GIMMS 3g pixels with comparable NDVI trend analysis results. See Sulla-Menashe et al., 2018.
A grid representing the AVHRR GIMMS 3g data set was used to link the trend data to the coarser 0.08333 degree global data. The AVHRR pixel id for each panel was derived from the equation y*4320 + x. A map of NDVI trend from AVHRR (Beck and Goetz 2011) is depicted in Figure 4. The spatial characteristics of this grid are shown below:
Upper Left corner (x, y) = (-180, 90)
Lower Right corner = (180, -90)
Pixel Size (degrees) = 0.08333
Columns, Rows = 4320, 2160
EPSG:4326
Data Access
These data are available through the Oak Ridge National Laboratory (ORNL) Distributed Active Archive Center (DAAC).
ABoVE: Peak Greenness for Canadian Boreal Forest from Landsat 5 TM Imagery, 1984-2011
Contact for Data Center Access Information:
- E-mail: uso@daac.ornl.gov
- Telephone: +1 (865) 241-3952
References
Beck, P.S.A. and S.J. Goetz. 2011. Satellite observations of high northern latitude vegetation productivity changes between 1982 and 2008: ecological variability and regional di erences. Environmental Research Letters, 6(4). https://dx.doi.org/10.1088/1748-9326/6/4/045501
Hansen, M.C., R.S. Defries, J. Townshend, M. Carroll, C. Dimiceli, and R.A. Sohlberg. 2003. Global percent tree cover at a spatial resolution of 500 meters: First results of the MODIS vegetation continuous elds algorithm. Earth Interactions, 7(10):1-15. https://dx.doi.org/10.1175/1087-3562(2003)007%3C0001:GPTCAA%3E2.0.CO;2
Stocks, B.J., J.A. Mason, J.B. Todd, E.M. Bosch, B.M. Wotton, B.D. Amiro, M.D. Flannigan, K.G. Hirsch, K.A. Logan, D.L. Martell, and W.R. Skinner. 2002. Large forest fires in Canada, 1959-1997. Journal of Geophysical Research, 108(D1):8149. https://dx.doi.org/10.1029/2001JD000484
Sulla-Menashe, D., C.E. Woodcock, and M.A. Friedl. 2018. Canadian boreal forest greening and browning trends: an analysis of biogeographic patterns and the relative roles of disturbance versus climate drivers. Environmental Research Letters, 13(1): 014007. https://dx.doi.org/10.1088/1748-9326/aa9b88
Wulder, M.A., J.C. White, M. Cranny, R.J. Hall, J.E. Luther, A. Beaudoin, D.G. Goodenough, and J.A. Dechka. 2008. Monitoring Canada's forests. Part 1: Completion of the EOSD land cover project. Canadian Journal of Remote Sensing, 34(6):549-562. https://dx.doi.org/10.5589/m08-066
Zhu, Z., C.E. Woodcock, and P. Olofsson. 2012. Continuous monitoring of forest disturbance using all available Landsat imagery. Remote Sensing of Environment, 122(C):75-91. https://dx.doi.org/10.1016/j.rse.2011.10.030