Documentation Revision Date: 2022-04-30
Dataset Version: 1
Summary
There are 21 data files included in this dataset: 20 files in GeoTIFF (*.tif) format and one file in comma-separated values (*.csv) format.
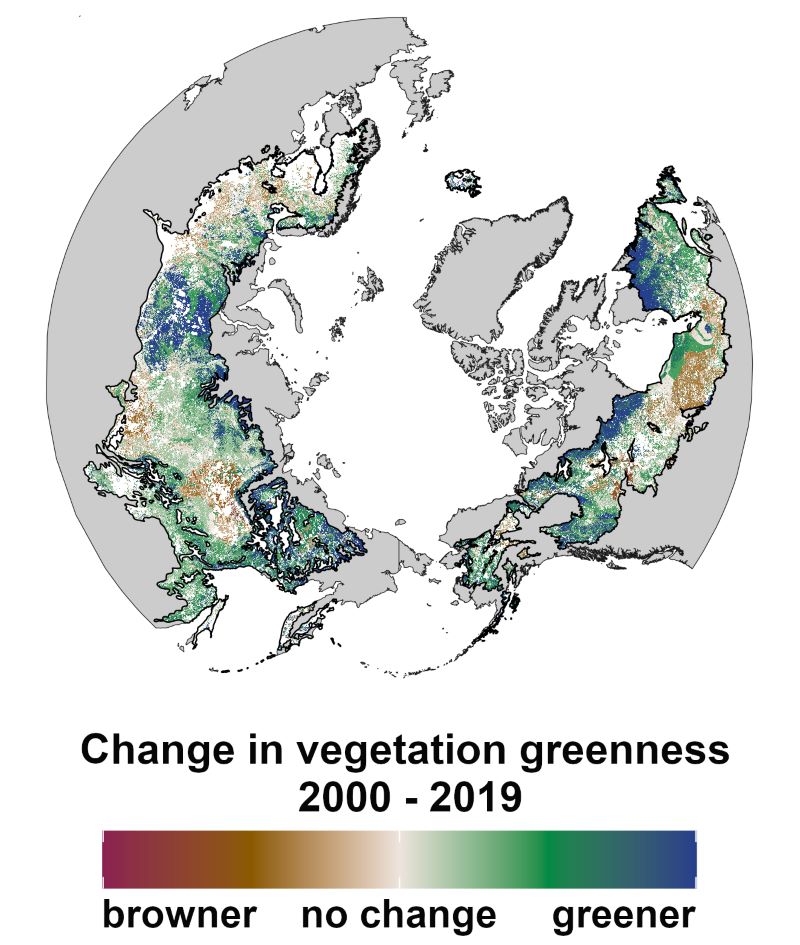
Figure 1. Change in greenness of boreal forest across the northern hemisphere between 2000 to 2019, estimated from an ensemble of vegetation indices derived from Landsat imagery. Source: boreal_greenness_median_percent_change_2000to2019_p500.tif
Citation
Berner, L.T., and S.J. Goetz. 2022. ABoVE: Landsat Vegetation Greenness Trends, Boreal Forest Biome, 1985-2019. ORNL DAAC, Oak Ridge, Tennessee, USA. https://doi.org/10.3334/ORNLDAAC/2023
Table of Contents
- Dataset Overview
- Data Characteristics
- Application and Derivation
- Quality Assessment
- Data Acquisition, Materials, and Methods
- Data Access
- References
Dataset Overview
This dataset provides information on interannual trends in annual maximum vegetation greenness from 1985 to 2019 for recently undisturbed areas in the boreal forest biome. Multi-decadal changes in remotely sensed vegetation greenness provide evidence of an emerging boreal biome shift driven by climate warming. Annual maximum vegetation greenness was assessed at about 100,000 random sample locations using an ensemble of spectral vegetation indices (NDVI, EVI2, kNDVI, and NIRv) derived from Landsat products. The dataset provides raster data summarizing vegetation greenness trends for sample locations stratified by Ecological Land Unit in GeoTIFF format. These raster data span the circum-hemispheric boreal forest biome between 45 to 70 degrees north at 300 m resolution. Estimates of uncertainty were generated using Monte Carlo simulations. Interannual trends in annual maximum vegetation greenness from 1985 to 2019 and 2000 to 2019 are provided for sample locations with adequate data for time series analysis; these data are in comma-separated values (CSV) format.
Project: Arctic-Boreal Vulnerability Experiment
The Arctic-Boreal Vulnerability Experiment (ABoVE) is a NASA Terrestrial Ecology Program field campaign being conducted in Alaska and western Canada, for 8 to 10 years, starting in 2015. Research for ABoVE links field-based, process-level studies with geospatial data products derived from airborne and satellite sensors, providing a foundation for improving the analysis, and modeling capabilities needed to understand and predict ecosystem responses to, and societal implications of, climate change in the Arctic and Boreal regions.
Related Publication
Berner, L.T. and S.J. Goetz. 2022. Satellite observations document trends consistent with a boreal forest biome shift. Global Change Biology, 28(10), 3275-3292. https://doi.org/10.1111/gcb.16121
Related Dataset
Berner, L.T., R. Massey, and S.J. Goetz. 2021. ABoVE: Landsat Tundra Greenness and Summer Air Temperatures, Arctic Tundra, 1985-2016. ORNL DAAC, Oak Ridge, Tennessee, USA. https://doi.org/10.3334/ORNLDAAC/1893
- The current dataset is based on similar Landsat data processing and analyses but focuses on the boreal biome instead of the Arctic tundra biome.
Acknowledgments
This project was supported by NASA's ABoVE program (grants NNX17AE44G, 80NSSC19M0112) and Carbon Cycle Science Program (grant NNX17AE13G).
Data Characteristics
Spatial Coverage: Distribution of boreal forest in northern hemisphere between 45 to 70 degrees north.
Spatial Resolution: 300 m
Temporal Coverage: 1985-06-01 to 2019-08-31
Temporal Resolution: annual
Study Area: Latitude and longitude are given in decimal degrees.
| Site | Westernmost longitude | Easternmost longitude | Northernmost latitude | Southernmost latitude |
|---|---|---|---|---|
| Boreal forest biome of northern hemisphere | -180 | 180 | 70 | 45 |
Data File Information
There are 21 data files included in this dataset: 20 files in GeoTIFF (*.tif) format and one file in comma-separated values (*.csv) format. The GeoTIFF files with annual greenness trends are named boreal_greennness_AAAA_BBBB_CCCC.tif, where
- AAAA is “median_percent_change”, “percent_browning” or “percent_greening” indicating the mapped variable.
- BBBB is “1985to 2019” or “2000to2019” indicating the time period.
- CCCC is “p025”, “p500”, or “p975”; indicating 2.5th, 50th (median), or 97.5th percentile, respectively, of the mapped variable. These percentiles represent a 95% confidence interval for the mapped variable and were derived using Monte Carlo simulations.
Table 1. File names and descriptions.
| File Name | Units | Description |
|---|---|---|
| boreal_greenness_median_percent_change_BBBB_CCCC.tif | percent | Median percent change in annual maximum vegetation greenness for time period across all sample locations within each ecological land unit. Percent change was computed as the change in vegetation greenness during the time period divided by initial vegetation greenness and then multiplied by 100. |
| boreal_greenness_percent_browning_BBBB_CCCC.tif | percent | Percent of sample locations in each ecological land unit that had a significant (α=0.10) negative trend in annual maximum vegetation greenness for the time period. |
| boreal_greenness_percent_greening_BBBB_CCCC.tif | percent | Percent of sample locations in each ecological land unit that had a significant (α=0.10) positive trend in annual maximum vegetation greenness for the time period. |
| boreal_sample_frame.tif | 1 | Binary raster identifying grid cells that were part of the boreal forest sampling frame. |
| boreal_ecounits.tif | 1 | Numerical identifier for each ecological land unit in the boreal sampling frame. |
| boreal_greenness_trend_summary.csv | - | Tabular data including trends in annual maximum vegetation greenness for sample locations during two time periods derived using an ensemble of spectral vegetation indices. See Table 2 for variables and descriptions. |
Data File Details
Each GeoTIFF has a spatial domain covering the circum-hemispheric distribution of the boreal forest biome between 45 to 70 degrees north at 300 m spatial resolution in the North Pole Lambert Azimuthal Equal Area (LAEA) spatial projection (EPSG:3571).
Table 2. Variables in the file boreal_greenness_trend_summary.csv. Each trend metric includes a best-estimate (50th percentile) as well as a lower bound (2.5th percentile) and upper bound (97.5th percentile) of a 95% confidence interval derived from Monte Carlo simulations.
| Variable | Units | Description |
|---|---|---|
| site | - | Unique alphanumeric identifier for each sample location. |
| latitude | degree_north | Latitude in decimal degrees of site; WGS84 datum. |
| longitude | degree_east | Longitude in decimal degrees of site; WGS84 datum. |
| ecounit | 1 | Numerical identifier for the Ecological Land Unit in which each site is located. |
| trend.period | - | Time period over which the trend in vegetation greenness was assessed (“1985 to 2019” or “2000 to 2019"). |
| tau.p025 | 1 | Mann-Kendall’s tau statistic (2.5th percentile). |
| tau.p500 | 1 | Mann-Kendall’s tau statistic (50th percentile). |
| tau.p975 | 1 | Mann-Kendall’s tau statistic (97.5th percentile). |
| percent.change.p025 | percent | Percent change in vegetation greenness (2.5th percentile). |
| percent.change.p500 | percent | Percent change in vegetation greenness (50th percentile). |
| percent.change.p975 | percent | Percent change in vegetation greenness (97.5th percentile). |
Application and Derivation
The boreal forest biome is a major component of Earth’s terrestrial biosphere and climate system (Bonan, 2008), yet vulnerable to a geographic shift as the climate continues to change (Baltzer et al., 2021; Beck et al., 2011). Remotely sensed metrics of vegetation greenness (e.g., Normalized Difference Vegetation Index [NDVI]) are indicators of vegetation productivity and mortality (Berner et al., 2020; Boyd et al., 2021; Camps-Valls et al., 2021) and thus long-term changes in vegetation greenness could provide evidence of an emerging boreal biome shift (Beck et al., 2011). To shed light on the extent that which a boreal biome shift is underway, multi-decadal changes in vegetation greenness were assessed at sample locations across the boreal biome using Landsat satellite observations (Berner and Goetz, 2022).
Quality Assessment
Multiple sources of uncertainty can impact estimates on annual maximum vegetation greenness and its changes over time when using Landsat satellite observations. Therefore, uncertainty associated with measurement error, cross-sensor calibration, data availability, and phenological modeling were propagated through the analysis using Monte Carlo simulations (n=1,000). Each trend metric in this dataset includes a best-estimate (50th percentile), as well as the lower (2.5th percentile) and upper (97.5th percentile) limits of a 95% confidence interval.
Data Acquisition, Materials, and Methods
This dataset provides information on vegetation greenness trends for recently undisturbed areas with natural vegetation and little to no human pressure in the boreal forest biome. The spatial extent of the boreal forest biome (~15.1 million km2) was delineated using the World Wildlife Fund’s Terrestrial Ecoregions of the World dataset (Olson et al., 2001) gridded at 300 m resolution. Grid cells without natural vegetation (e.g., barren, developed, crops) were masked using a satellite land cover dataset (ESA, 2017), as were grid cells with evidence of more than minimal human pressure (Venter et al., 2016). Grid cells were additionally masked if there was evidence of disturbance since the mid-1980s, as determined using regional to global forest disturbance datasets (Giglio et al., 2018; Guindon et al., 2017; Hansen et al., 2013; Kasischke et al., 2002; Loboda and Chen, 2016).
Sample locations (n=100,000) were then randomly selected from this sampling frame, which comprised 56% (8.43 million km2) of the boreal forest biome. Annual maximum vegetation greenness was estimated at each sample location using 30 m resolution Landsat data. The sample locations were stratified by Ecological Land Unit (ELU; Sayre et al., 2014) at 300 m resolution and trends were summarized across sample locations within each ELU. The ELUs demarcate areas with distinct combinations of bioclimate, landform, lithography, and land cover, thus providing a way to summarize vegetation greenness trends in an ecologically meaningful manner. Overall, the raster data cover recently undisturbed natural vegetation in the boreal forest biome at 300 m resolution.
To measure greenness trends, estimates of annual maximum vegetation greenness for the periods 1985 to 2019 and 2000 to 2019 were derived from Landsat data. Two time periods were used to take advantage of the improved spatial coverage of Landsat data from 2000 to 2019 and to minimize the potential effects of greening due to succession after disturbances prior to the early 1980s.
Annual maximum vegetation greenness was estimated using clear-sky Landsat data sporadically acquired each year from June through August (day of year 152 to 243). Annual maximum vegetation greenness was characterized using phenological modeling and an ensemble of spectral vegetation indices (NDVI, EVI2, NIRv, and kNDVI) derived from surface reflectance measured by sensors on the Landsat satellites (5,7, and 9). Interannual trends were then assessed using non-parametric Mann-Kendall trend tests and Theil-Sen slope indicators after pre-whitening each time series. Each trend component of this dataset includes estimates of uncertainty that were generated using Monte Carlo simulations (n=1,000). The median estimate (50th percentile) along with 95% confidence limits (2.5th and 97.5th percentiles) are included.
The data file boreal_greenness_trend_summary.csv includes tabular data on interannual trends in annual maximum vegetation greenness from 1985 to 2019 and 2000 to 2019 for each sample location. The raster data (*.tif) summarize interannual trends in annual maximum vegetation greenness during each time period for sample locations stratified by Ecological Land Unit (ELU) within the boreal biome (Table 1).
See Berner and Goetz (2022) for details of this analysis. The code repository https://github.com/logan-berner/boreal_biome_shift includes scripts developed for this analysis.
Data Access
These data are available through the Oak Ridge National Laboratory (ORNL) Distributed Active Archive Center (DAAC).
ABoVE: Landsat Vegetation Greenness Trends, Boreal Forest Biome, 1985-2019
Contact for Data Center Access Information:
- E-mail: uso@daac.ornl.gov
- Telephone: +1 (865) 241-3952
References
Baltzer, J.L., N.J. Day, X.J. Walker, D. Greene, M.C. Mack, H.D. Alexander, D. Arseneault, J. Barnes, Y. Bergeron, Y. Boucher, L. Bourgeau-Chavez, C.D. Brown, S. Carrière, B.K. Howard, S. Gauthier, M.-A. Parisien, K.A. Reid, B.M. Rogers, C. Roland, L. Sirois, S. Stehn, D.K. Thompson, M.R. Turetsky, S. Veraverbeke, E. Whitman, J. Yang, and J.F. Johnstone. 2021. Increasing fire and the decline of fire adapted black spruce in the boreal forest. Proceedings of the National Academy of Sciences 118:e2024872118. https://doi.org/10.1073/pnas.2024872118
Beck, P.S. A., G.P. Juday, C. Alix, V.A. Barber, S.E. Winslow, E.E. Sousa, P. Heiser, J.D. Herriges, and S.J. Goetz. 2011. Changes in forest productivity across Alaska consistent with biome shift. Ecology Letters 14:373–379. http://doi.org/10.1111/j.1461-0248.2011.01598.x
Berner, L.T. and S.J. Goetz. 2022. Satellite observations document trends consistent with a boreal forest biome shift. Global Change Biology, 28(10), 3275-3292. https://doi.org/10.1111/gcb.16121
Berner, L.T., R. Massey, and S.J. Goetz. 2021. ABoVE: Landsat Tundra Greenness and Summer Air Temperatures, Arctic Tundra, 1985-2016. ORNL DAAC, Oak Ridge, Tennessee, USA. https://doi.org/10.3334/ORNLDAAC/1893
Berner, L.T., R. Massey, P. Jantz, B.C. Forbes, M. Macias-Fauria, I. Myers-Smith, T. Kumpula, G. Gauthier, L. Andreu-Hayles, B.V. Gaglioti, P. Burns, P. Zetterberg, R. D’Arrigo, and S.J. Goetz. 2020. Summer warming explains widespread but not uniform greening in the Arctic tundra biome. Nature Communications 11:4621. https://doi.org/10.1038/s41467-020-18479-5
Bonan, G.B. 2008. Forests and climate change: forcings, feedbacks, and the climate Benefits of forests. Science 320:1444–1449. http://doi.org/10.1126/science.1155121
Boyd, M.A., L.T. Berner, A.C. Foster, S.J. Goetz, B.M. Rogers, X.J. Walker, and M.C. Mack. 2021. Historic declines in growth portend trembling aspen death during a contemporary leaf miner outbreak in Alaska. Ecosphere 12:e03569. https://doi.org/10.1002/ecs2.3569
Camps-Valls, G., M. Campos-Taberner, Á. Moreno-Martínez, S. Walther, G. Duveiller, A. Cescatti, M.D. Mahecha, J. Muñoz-Marí, F.J. García-Haro, L. Guanter, M. Jung, J.A. Gamon, M. Reichstein, and S.W. Running. 2021. A unified vegetation index for quantifying the terrestrial biosphere. Science Advances 7:eabc7447. https://doi.org/10.1126/sciadv.abc7447
ESA. 2017. Land Cover CCI Product User Guide Version 2. Technical Report. http://maps.elie.ucl.ac.be/CCI/viewer/download/ESACCI-LC-Ph2-PUGv2_2.0.pdf
Giglio, L., L. Boschetti, D.P. Roy, M.L. Humber, and C.O. Justice. 2018. The Collection 6 MODIS burned area mapping algorithm and product. Remote Sensing of Environment 217:72–85. https://doi.org/10.1016/j.rse.2018.08.005
Guindon, L., P. Villemaire, R. St-Amant, P.Y. Bernier, A. Beaudoin, F. Caron, M. Bonucelli, and H. Dorion. 2017. Canada Landsat Disturbance (CanLaD): a Canada-wide Landsat-based 30-m resolution product of fire and harvest detection and attribution since 1984. Natural Resources Canada. https://doi.org/10.23687/add1346b-f632-4eb9-a83d-a662b38655ad
Hansen, M.C., P.V. Potapov, R. Moore, M. Hancher, S.A. Turubanova, A. Tyukavina, D. Thau, S.V. Stehman, S.J. Goetz, T.R. Loveland, A. Kommareddy, A. Egorov, L. Chini, C.O. Justice, and J.R. G. Townshend. 2013. High-Resolution Global Maps of 21st-Century Forest Cover Change. Science 342:850–853. https://doi.org/10.1126/science.1244693
Kasischke, E.S., D. Williams, and D. Barry. 2002. Analysis of the patterns of large fires in the boreal forest region of Alaska. International Journal of Wildland Fire 11:131-144. https://doi.org/10.1071/WF02023
Loboda, T.V., and D. Chen. 2016. Distribution of Young Forests and Estimated Stand Age across Russia, 2012. ORNL DAAC, Oak Ridge, Tennessee, USA. https://doi.org/10.3334/ORNLDAAC/1330
Olson, D.M. E. Dinerstein, E.D. Wikramanayake, N.D. Burgess, G.V.N. Powell, E.C. Underwood, J.A. D'amico, Il. Itoua, H.E. Strand, J.C. Morrison, C.J. Loucks, T.F. Allnutt, T.H. Ricketts, Y. Kura, J.F. Lamoreux, W.W. Wettengel, P. Hedao, and K.R. Kassem. 2001. Terrestrial Ecoregions of the World: A New Map of Life on Earth: A new global map of terrestrial ecoregions provides an innovative tool for conserving biodiversity. BioScience 51:933–938. https://doi.org/10.1641/0006-3568(2001)051[0933:TEOTWA]2.0.CO;2
Sayre, R., J. Dangermond, C. Frye, R. Vaughan, P. Aniello, S. Breyer, D. Cribbs, D. Hopkins, R. Nauman, W. Derrenbacher, D. Wright, C. Brown, C. Convis, J. Smith, L. Benson, D. Paco VanSistine, H. Warner, J. Cress, J. Danielson, S. Hamann, T. Cecere, A. Reddy, D. Burton, A. Grosse, D. True, M. Metzger, J. Hartmann, N. Moosdorf, H. Dürr, M. Paganini, P. DeFourny, O. Arino, S. Maynard, M. Anderson, and P. Comer. 2014. A New Map of Global Ecological Land Units — an ecophysiographic stratification approach. Washington, DC: Association of American Geographers. http://aag.org
Venter, O., E.W. Sanderson, A. Magrach, J.R. Allan, J. Beher, K.R. Jones, H.P. Possingham, W.F. Laurance, P. Wood, B.M. Fekete, M.A. Levy, and J.E. M. Watson. 2016. Global terrestrial Human Footprint maps for 1993 and 2009. Scientific Data 3:160067. https://doi.org/10.1038/sdata.2016.67