Documentation Revision Date: 2018-12-31
Data Set Version: 1
Summary
Each vegetation plot consists of a 1 x 10-m belt with a 1-m x 10-cm strip along the inside. Each site is divided into 10 sub-plots in which species percent cover is visually estimated in the 1m x 10-cm strip and species presence in the 1-m x 90-cm sub-plot. The vegetation plot data provided are summaries of the ten 1 x 1-m sub-plots.
There are ten data files in comma-separated format (.csv) with this data set. There is also a companion file with plot photos, often these photos document multiple sampling events.
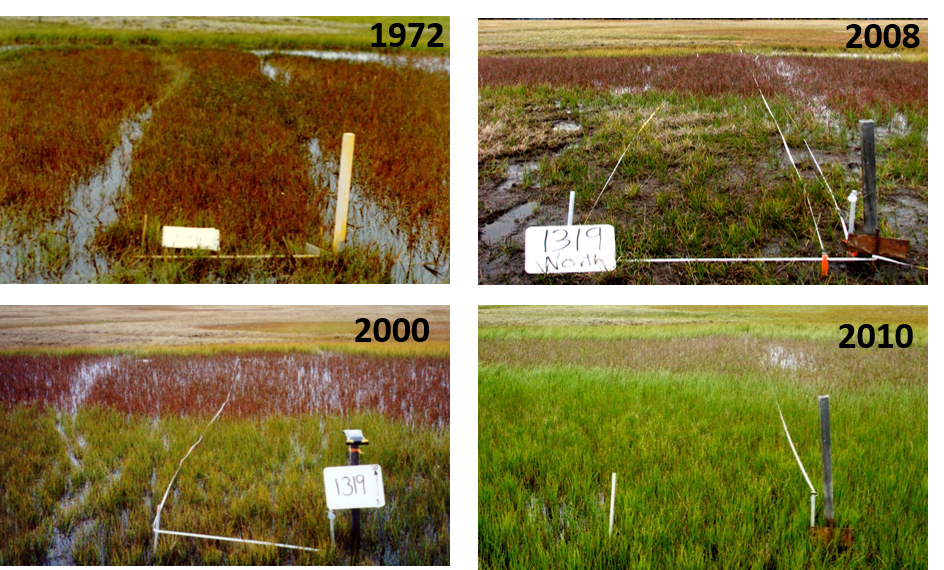
Figure 1. Photos of Plot 1319 during repeated measurements. The decrease in biomass in 2008 occurred during a lemming population peak.
Citation
Webber, P.J., S. Villarreal, and C.E. Tweedie. 2018. Arctic Vegetation Plots for IBP Tundra Biome, Barrow, Alaska, 1972-2010. ORNL DAAC, Oak Ridge, Tennessee, USA. https://doi.org/10.3334/ORNLDAAC/1535
Table of Contents
- Data Set Overview
- Data Characteristics
- Application and Derivation
- Quality Assessment
- Data Acquisition, Materials, and Methods
- Data Access
- References
Data Set Overview
This data set provides vegetation cover and environmental plot data collected as part of the International Biological Program (IBP), U. S. Tundra Biome Program, in Barrow, Alaska in 1972. Forty-three (43) plots were assessed for estimated percent land cover by species and plot data including moisture, topographic position, slope, aspect, shape, and soil data. In 1999, 2008, and 2010, 33 of the same plots were resampled for these same measures as part of the “IPY Back to the Future: Resampling old research sites to assess changes in high latitude terrestrial ecosystem structure and function project”. The tundra at Barrow is considered coastal tundra located in the most northern region of North Slope and is characterized by various microtopographic features such as polygons, as well as many ponds and lakes.
Each vegetation plot consists of a 1 x 10-m belt with a 1-m x 10-cm strip along the inside. Each site is divided into 10 sub-plots in which species percent cover is visually estimated in the 1m x 10-cm strip and species presence in the 1-m x 90-cm sub-plot. The vegetation plot data provided are summaries of the ten 1 x 1-m sub-plots.
The Pre-ABoVE vegetation plot datasets were curated to create the Alaska Arctic Vegetation Archive (AVA-AK; Walker et al. 2016b, Walker 2013). The AVA-AK is a regional database that is part of the larger Arctic Vegetation Archive (Walker 2016a, Walker et al. 2013, Walker and Raynolds 2011). The database contains vegetation plots from homogeneous plant communities with tables of cover or cover-abundance scores for all species and accompanying environmental site data. Field data were collected using Braun-Blanquet, US National Vegetation Classification protocols, or comparable methods.
Project: Arctic-Boreal Vulnerability Experiment (ABoVE)
The Arctic-Boreal Vulnerability Experiment (ABoVE) iis a NASA Terrestrial Ecology Program field campaign that will take place in Alaska and western Canada between 2016 and 2021. Climate change in the Arctic and Boreal region is unfolding faster than anywhere else on Earth. ABoVE seeks a better understanding of the vulnerability and resilience of ecosystems and society to this changing environment.
Acknowledgements:
These data files were edited by Donald A. Walker, Amy L. Breen and Lisa A. Druckenmiller at the University of Alaska Fairbanks' Alaska Geobotany Center and obtained via the Arctic Geoecological Atlas (http://arcticatlas.geobotany.org/), which provides access to existing Arctic vegetation plot and map data in support of the ABoVE campaign.
Data Characteristics
Spatial Coverage: Barrow, Alaska
Domain: Core ABoVE region
State/territory: Alaska (study sites around Barrow)
Grid cells: Ahh1Avv0Bh2Bv1
Spatial Resolution: Point resolution. Each plot was a minimum of 10 m2
Temporal Coverage: 1972-08-01 2010-08-01
Temporal Resolution: Each plot was sampled once in 1972, 1999, 2008, and 2010.
Study Area (All latitude and longitude given in decimal degrees)
|
Site |
Westernmost Longitude |
Easternmost Longitude |
Northernmost Latitude |
Southernmost Latitude |
|---|---|---|---|---|
|
IBP Vegetation Plots, Barrow, Alaska |
-156.71065 |
-156.66183 |
71.29966 |
71.28821 |
Data Files:
There are ten data files in comma-separated format (.csv) with this data set. There is also a companion file with plot photos documenting multiple sampling events.
Table 1. Included data files and companion file.
|
File names |
Descriptions |
|---|---|
|
Barrow_Tundra_IBP_Species_Data_Repeat_Plots_1972.csv Barrow_Tundra_IBP_Species_Data_Single_Plots_1972.csv Barrow_Tundra_IBP_Species_Data_Repeat_Plots_1999.csv Barrow_Tundra_IBP_Species_Data_Repeat_Plots_2008.csv Barrow_Tundra_IBP_Species_Data_Repeat_Plots_2010.csv |
These files contain species cover data for the vegetation plots. Taxa are listed in alphabetical order according to the accepted PASL name. *_Repeat_Plots_YYYY, report data for the 33 plots sampled on all 4 events on the respective year. Plot data reported in *_Single_Plots_1972.csv are for 10 plots not relocated in 1999 for repeated measurements. |
|
Barrow_Tundra_IBP_Environemntal_Data_Repeat_Plots_1972.csv Barrow_Tundra_IBP_Environemntal_Data_Single_Plots_1972.csv Barrow_Tundra_IBP_Environemntal_Data_Repeat_Plots_1999.csv Barrow_Tundra_IBP_Environmental_Data_Repeat_Plots_2008.csv Barrow_Tundra_IBP_Environmental_Data_Repeat_Plots_2010.csv |
Environmental characterization data for research plots. Data for functional type percent covers for 2010 only. *_Repeat_Plots_YYYY, report data for the 33 plots sampled on all 4 events on the respective year. Plot data reported in *_Single_Plots_1972.csv are for 10 plots not relocated in 1999 for repeated measurements. |
|
Companion File |
|
| Barrow_Tundra_Veg_Plots_Photographs.pdf | Companion file with plot photos, often for multiple sampling events. |
Data Dictionary
Species Data -- Presence and cover. Species cover data are from Tweedie (2013). Both the dataset author determinations and the current nomenclature according to the Panarctic Species List (PASL) are listed.
Table 2. Content of species data files for the vegetation plots. Taxa are listed in alphabetical order according to the accepted PASL name.
|
Column Numbers |
Column Name |
Units |
Description |
|---|---|---|---|
|
1 |
PASL_TAXON_SCIENTIFIC_NAME_NO_AUTHORS |
|
Current Taxonomy according to the Panarctic Species List (PASL) without authors names |
|
2 |
PASL_TAXON_SCIENTIFIC_NAME_WITH_AUTHOR(S) |
|
Current Taxonomy according to the Panarctic Species List (PASL) |
|
3 |
DATASET_TAXON |
|
Data set taxonomy |
|
4 to 36 ----------------- 4 to 13 |
1972-206 - 1972-1325 (33 repeated measurement plots for years 1972, 1999, 2008, and 2010) ---------------------------------------------------------------- 1972-315 - 1972-1326 (10 single measurement plots, measured in 1972 only) |
|
Column headings include the plot identifiers. Column name syntax is YYYY-plot number, where YYYY = 1972, 1999, 2008, or 2010. Plot numbers are the same each year. Note files with either repeated or single measurements. Species cover data are given as percentage. |
Plot Environmental Data -- Vegetation plot observation and measurement data. Includes land cover, topographic position, slope, aspect, shape, soil moisture, and soil data.
Note that functional type percent covers for 2010 were calculated from species cover data by Sandra Villarreal (2012). Percent cover were only calculated for 2010.
These data columns and descriptions are identical to the header data in the Turboveg database.
Turboveg data dictionary: http://geobotanical.portal.gina.alaska.edu/plot-archive/turboveg-table
Table 3. Contents of plot environmental data.
| Column Number | Column Name | Units/Format | Description |
|---|---|---|---|
| 1 | TV_NUMBER | Turboveg record number sequentially assigned during data entry. Prefixes: Alaska (1), Russia (2), Canada (3). | |
| 2 | FIELD_RELEVE_NUMBER | Author's plot number or code if it differs from the reference for the species table. | |
| 3 | DATE | YYYYMM | Date of collection. Year and month. |
| 4 | RELEVE_AREA | M^2 | Area of the relevé (m2). The field is left blank to indicate the plot had no boundaries or no estimate of the sampled area. |
| 5 | RELEVE_SHAPE | Shape of the relevé area. Necessary for judgements on ‘edge effects’. square (S), rectangle (R), linear/band-forming (L), circular (O), irregular (I), more subplots combined (C), unknown (not-recorded) (N). | |
| 6 | COVERSCALE | Cover abundance scale. Percentage (%) | |
| 7 | REPEAT_SAMPLED_ | Y/N | Has the relevé been sampled more than once? (Y or N). Will change over time. |
| 8 | COLLECTION | Method used to collect vegetation-plot data. relevé (R), other (O). | |
| 9 | COLLECTION_METHOD | If data were not collected using the relevé method, specify collection method and source. | |
| 10 | SYNTAXON_CODE | n/a | Syntaxon name according to the Braun-Blanquet School. |
| 11 | SYSTEM_FOR_PLANT_COMMUNITY_NAME | Field community name (FLD_NM) | |
| 12 | PLANT_COMMUNITY_NAME | Original plant community name used by the author. Will specify the source of the name in the previous field. | |
| 13 | AUTHOR_CODE | Relevé primary author(s). | |
| 14 | REFERENCE_FOR_SPECIES_DATA | Main publication or data report from which the species data were taken. | |
| 15 | TABLE_NUMBER_FOR_SPECIES_DATA | Table number(s) in which species data occur in the reference for species data. | |
| 16 | NUMBER_OF_PUBLISHED_RELEVE_IN_TABLE | Relevé number in the species table in the reference for species data. | |
| 17 | REFERENCE_FOR_ENVIRONMENTAL_DATA | Reference from which the environmental data were taken. This field is necessary as raw environmental data is often not included in the main publication. | |
| 18 | TABLE_NUMBER_FOR_ENVIRONMENTAL_DATA | If environmental data are from a table, indicate table number(s) from the reference for environmental data. | |
| 19 | BIOCLIMATIC_SUBZONE | Arctic tundra bioclimate zone. Subzone A (A), Subzone B (B), Subzone C (C), Subzone D (D), Subzone E (E), Treeless Oceanic Boreal (O), Forest-Tundra Transition (FT), Boreal (BO) | |
| 20 | COUNTRY_CODE | Country code generated by Turboveg. For United States, the code is US. | |
| 21 | DATASET | Specific project dataset code. | |
| 22 | REGION | Region as indicated by author. For example, could be land management unit, national park, or mountain range. | |
| 23 | LOCATION | Relevé location as indicated by the author. | |
| 24 | PHYSIOGRAPHIC_DIVISION | Physiographic divisions. | |
| 25 | PHYSIOGRAPHIC_REGION_SOURCE | Source used for physiographic division. | |
| 26 | GEOREFERENCE | Y/N | Are the relevés georeferenced? (Y or N). |
| 27 | GEOREFERENCE_SOURCE | Georeference source. GPS (GPS), Google Earth (GE), map (MAP), aerial photograph (PHOTO), None (NONE). | |
| 28 | GEOREFERENCE_ACCURACY | M | Accuracy of georeference as recorded by GPS (m). If source differs, approximate accuracy (m). |
| 29 | LATITUDE | decimal degrees | Latitude (decimal degrees). Positive latitudes are north of the equator, negative latitudes are south of the equator. Datum is WGS84. |
| 30 | LONGITUDE | decimal degrees | Longitude (decimal degrees). Positive longitudes are east of Prime Meridian, negative longitudes are west of the Prime Meridian. Datum is WGS84. |
| 31 | ALTITUDE | M | Elevation of relevé (m). |
| 32 | SLOPE | DEGREES | Slope of relevé (degrees). |
| 33 | ASPECT | DEGREES | Aspect of relevé (degrees). Aspect is measured counterclockwise in degrees from 0 (due north) to 360 (again due north, coming full circle). As a convention, use 360 degrees for north. |
| 34 | TOPOGRAPHIC_POSITION | flat elevated plain (includes plateaus and elevated river terraces) (EL_PLN); hill crest (CRST); shoulder (SHLD); backslope (BACK); footslope (includes toeslopes) (FOOT); flat low plain (LW_PLN); riparian zone (includes active floodplains, drainage channels, water tracks) (RIPZN); lake or pond (LAKE). | |
| 35 | SURFICIAL_GEOLOGY | Parent material. | |
| 36 | HABITAT_TYPE | Tentative Braun-Blanquet habitat as defined by classes. | |
| 37 | SITE_MOISTURE | Site moisture. dry (DRY), moist (MST), wet (WET), aquatic/emergent (AQU), unknown (not recorded) (N). | |
| 38 | DISTURBANCE | natural vegetation (NAT) or anthropologically disturbed (DIS). | |
| 39 | ORGANIC_LAYER_DEPTH | CM | Depth of organic layer (cm). |
| 40 | SOIL_TEXTURE__TOP_MINERAL_HORIZON | Field estimate of texture at the top of the mineral horizon. Broad categories: gravel (GRV), sand (SND), silt (SLT), clay (CLY), loam (LOM), organic (if no mineral soil within the active layer) (ORG). | |
| 41 | SOIL_PH | The pH reported by author. Methods for quantifying pH vary. Refer to reference to determine methods used. | |
| 42 | MOSSES_IDENTIFIED | Y/N | Mosses identified? (Y or N). |
| 43 | LIVERWORTS_IDENTIFIED | Y/N | Liverworts identified? (Y or N). |
| 44 | LICHENS_IDENTIFIED | Y/N | Lichens identified? (Y or N). |
| 45 | VASCULAR_PLANT_TAXONOMIC_QUALITY | Subjective assessment of floristic quality by the party that submitted the plot. highest (1), high (2), high but incomplete (3), moderate (4), moderate and incomplete (5), low (6). | |
| 46 | CRYPTOGAM_TAXONOMIC_QUALITY | Subjective assessment of taxonomic quality of the cryptogam data by the party that submitted the plot. highest (1), high (2), high but incomplete (3), moderate (4), moderate and incomplete (5), low (6). | |
| 47 | COVER_TREE_LAYER | % | Tree cover (%). |
| 48 | COVER_SHRUB_LAYER | % | Total shrub cover (%). |
| 49 | COVER_TALL_SHRUBS | % | Tall shrub cover (%). |
| 50 | COVER_LOW_SHRUBS | % | Low shrub cover (%). |
| 51 | COVER_ERECT_DWARF-SHRUBS | % | Erect dwarf-shrub cover (%). |
| 52 | COVER_PROSTRATE_DWARF-SHRUBS | % | Prostrate dwarf-shrub cover (%). |
| 53 | COVER_GRAMINOIDS | % | Total graminoid cover (%). |
| 54 | COVER_TUSSOCK_GRAMINOIDS | % | Tussock graminoid cover (%). |
| 55 | COVER_FORBS | % | Forb cover (%). |
| 56 | COVER_SEEDLESS_VASCULAR_PLANTS | % | Seedless vascular plant (ferns, horsetails, club mosses) cover (%). |
| 57 | COVER_MOSSES_&_LIVERWORTS | % | Bryophyte cover (%). |
| 58 | COVER_LICHEN_LAYER | % | Lichen cover (%). |
| 59 | COVER_CRUST | % | Biological soil crust cover (%). |
| 60 | COVER_ALGAE_LAYER | % | Algae cover (%). |
| 61 | COVER_BARE_SOIL | % | Bare soil, or unvegetated (%). |
| 62 | COVER_BARE_ROCK | % | Rock cover (%). |
| 63 | COVER_OPEN_WATER | % | Water cover (%). |
| 64 | COVER_LITTER_LAYER | % | Litter cover (%). |
| 65 | COVER_TOTAL | % | Relative cover of vegetation (%). |
| 66 | MEAN_CANOPY_HEIGHT | CM | Mean height of the canopy within the stand (cm). |
| 67 | MEAN_TREE_LAYER_HEIGHT | CM | Mean height of the tree layer (m). |
| 68 | MEAN_SHRUB_LAYER_HEIGHT | CM | Mean height of upper shrub layer including tall and low shrubs (cm). |
| 69 | MEAN_HERB_LAYER_HEIGHT | CM | Mean height of herb layer including graminoids, forbs and dwarf shrubs (cm). |
| 70 | MEAN_MOSS_LAYER_HEIGHT | CM | Mean thickness of the moss layer including live and dead moss (cm). |
| 71 | REMARKS | Comments, if needed. |
Application and Derivation
Original data from 1972 were classified and community descriptions were published as a report (Webber & Ebert 1973) and as a component of IBP books (Brown et al. 1980, Webber 1978, Webber et al. 1980).
These data and their corresponding resampling data from 1999, 2008, and 2010 for the 33 relocated sites (330 sub-plots) were assessed for change and published as part of a PhD dissertation (Villarreal 2013), site-specific papers (Lara et al. 2012, Villarreal et al. 2012) and as part of a synthesis of the larger IPY Back to the Future project (Callaghan et al. 2011).
Quality Assessment
In addition to the numerous data synthesis and analysis papers resulting from this repeating sampling activity, Webber also provided insight on the quality of these and other datasets collected using his plant community sampling method at the Alaska AVA Boulder Workshop (Webber 2014).
Data Acquisition, Materials, and Methods
IBP Vegetation Plot Measurement History
The Barrow vegetation plots were originally described and mapped by Dr. Patrick J. Webber in 1972 as part of the International Biological Program (IBP). The U. S. Tundra Biome Program focused on long-term studies to understand tundra adaptations as they relate to the distribution of vascular plants, bryophytes and lichens to environmental factors in the light of future oil development on the coastal plain. The tundra at Barrow is considered coastal tundra located in the most northern region of North Slope and is characterized by various microtopographic features such as polygons, as well as many ponds and lakes.
These sites were resampled by Webber, Craig Tweedie, Robert Hollister, Sandra Villarreal and others in 1999, 2008, and 2010, and assessed for community change by Villarreal as part of the 'IPY Back to the Future: Resampling old research sites to assess changes in high latitude terrestrial ecosystem structure and function project' (NSF Award No. 0732885).
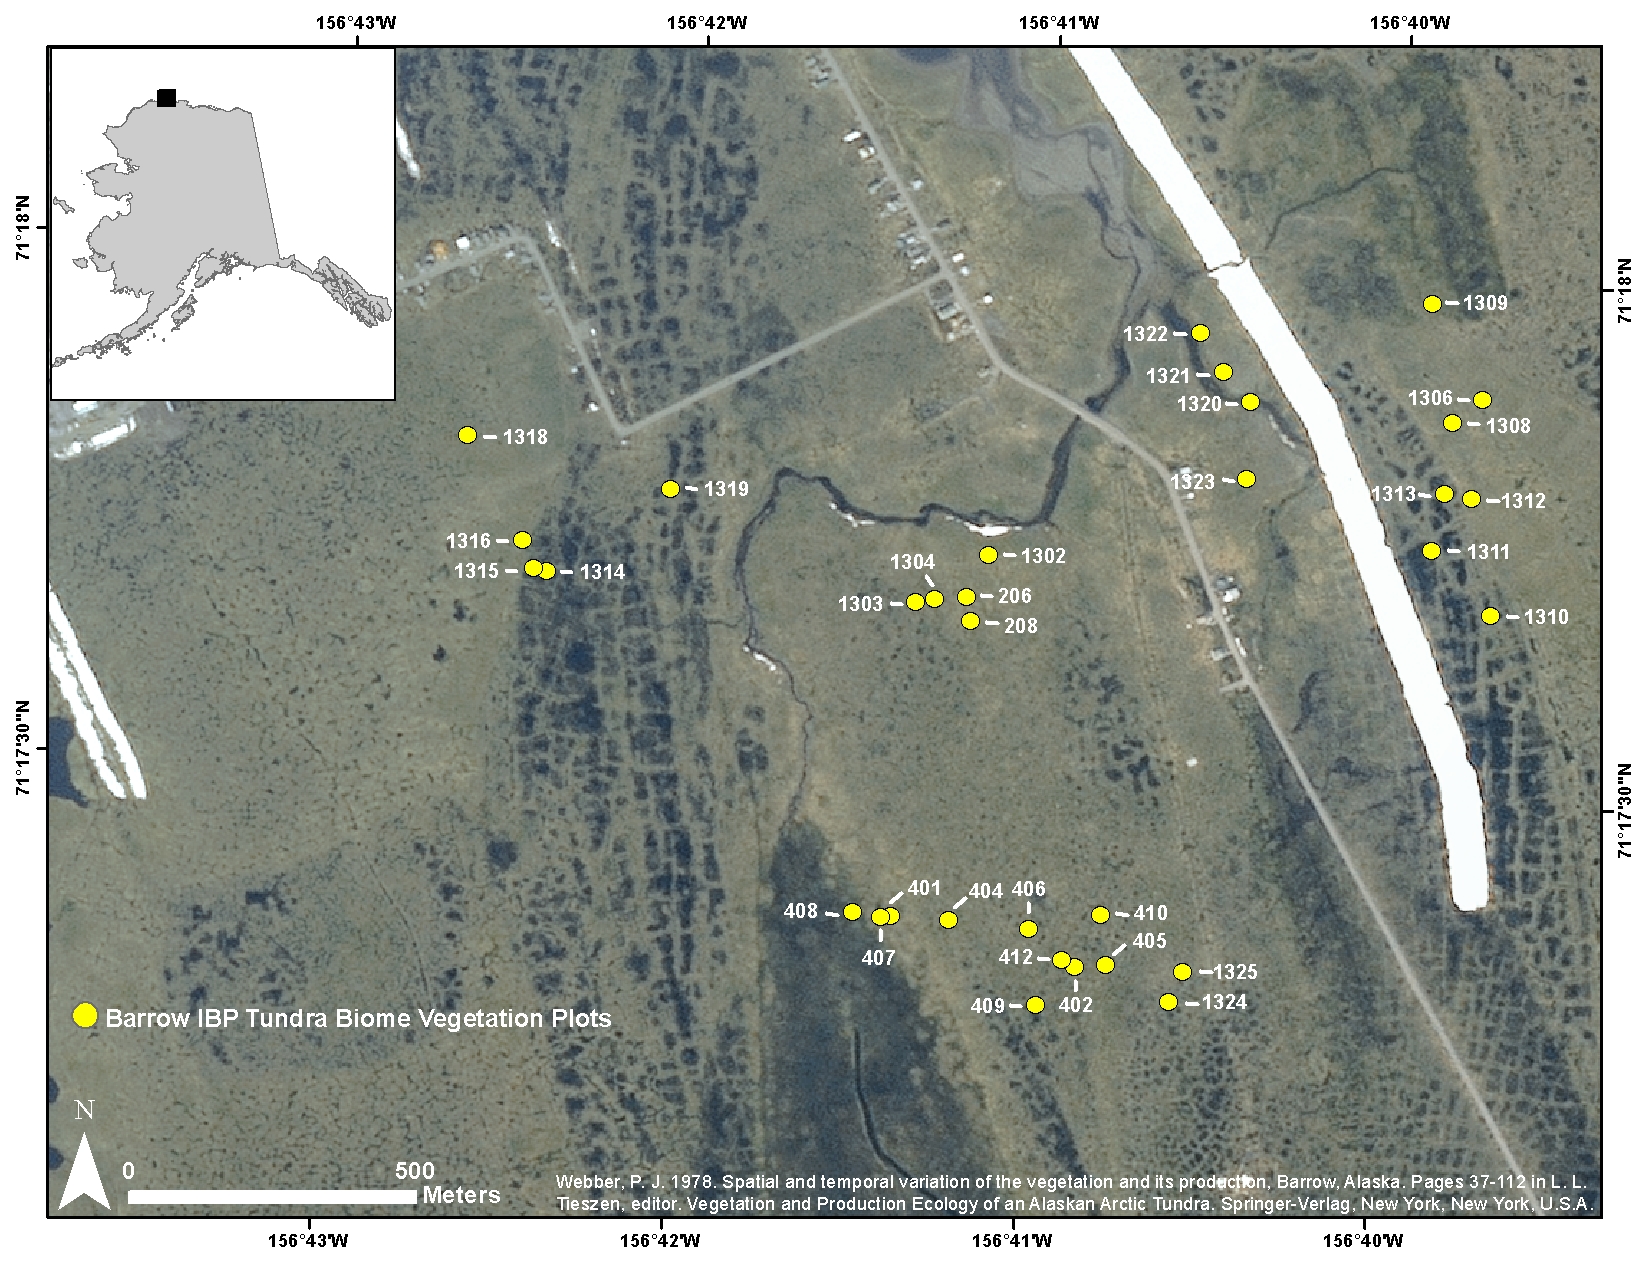
Figure 2. Locations of Barrow IBP vegetation plots.
Site Selection
Forty-three sites, or plots, were originally established in 1972 and were used to characterize 10 plant communities for the IBP project including:
1) Arctophila creek margin (1 plot),
2) Arctophila fulva pond margin (2 plots),
3) Arctophila pond margin (1 plot),
4) Cochlearia officinalis pioneer meadow and creek bed (2 plots)
5) Dry Luzula confusa heath (1 plot),
6) Dry Salix rotundifolia heath (6 plots),
7) Mesic Carex aquatilis-Poa arctica meadow (12 plots),
8) Moist Carex aquatilis-Oncophorus wahlenbergii meadow (4 plots),
9) Wet Carex aquatilis-Eriophorum russeolum meadow (8 plots),
10) Wet Dupontia fisheri-Eriophorum angustifolium meadow (6 plots).
Plot locations were obtained via GPS in the early 2000s and are reported for all years of data collection.
Vegetation Survey
Each vegetation plot consists of a 1 x 10-m belt with a 1-m x 10-cm strip along the inside. Each site is divided into 10 sub-plots in which species percent cover is visually estimated in the 1m x 10-cm strip and species presence in the 1-m x 90-cm sub-plot. The vegetation plot data provided are summaries of the ten 1 x 1-m sub-plots.
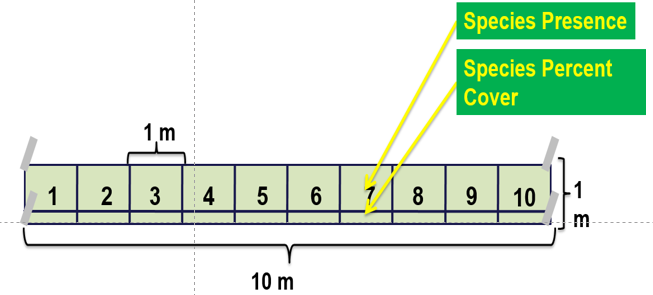
Figure 3. The method consists of recording the composition of vegetation in plots each of which is a linear, contiguous arrangement of ten 1 x 1m quadrats placed in a visually homogeneous patch. The 10-cm strip is used for cover assessment and the 90-cm sub-plot for species presence.
Plot Sampling
Sampling of the plots included:
1) Taking photographs of the general site. See companion file Barrow_Tundra_Veg_Plots_Photographs.pdf
2) Survey of vegetation species and quantification of species cover as described above.
3) Field observations of site factors including slope, aspect, and estimates of cover of bare soil, rocks, and the major plant growth forms.
4) Field observation of soil texture and horizon depth. Sampling of soils for laboratory analyses of pH.
Synthesis and Analysis Activities
The Barrow IBP vegetation plot data have been extensively analyzed, updated, and published. Examples include:
An updated classification and change analysis is provided in Villarreal et al. (2012) for individual sub-plots.
Original data from 1972 were classified and community descriptions were published as a report (Webber & Ebert 1973) and as a component of two IBP books (Brown et al. 1980, Webber 1978, Webber et al. 1980).
These data and their corresponding resampling data from 1999, 2008, and 2010 for the 33 relocated sites (330 sub-plots) were assessed for change and published as part of a PhD dissertation (Villarreal 2013), site-specific papers (Lara et al. 2012, Villarreal et al. 2012) and as part of a synthesis of the larger IPY Back to the Future project (Callaghan et al. 2011).
Webber also provided insight on the quality of these and other datasets collected using his plant community sampling method at the Alaska AVA Boulder Workshop (Webber 2014).
Direct link to the plot archive record in the Arctic Geoecological Atlas: http://agc.portal.gina.alaska.edu/catalogs/10178-alaska-arctic-vegetation-archive-barrow-vegeta
Data Access
These data are available through the Oak Ridge National Laboratory (ORNL) Distributed Active Archive Center (DAAC).
Arctic Vegetation Plots for IBP Tundra Biome, Barrow, Alaska, 1972-2010
Contact for Data Center Access Information:
- E-mail: uso@daac.ornl.gov
- Telephone: +1 (865) 241-3952
References
Brown, J., K.R. Everett, P.J. Webber, S.F. MacLean, Jr., and D.F. Murray. 1980. The coastal tundra at Barrow. Pages 1-29 in Brown, J. et al., editors. An Arctic ecosystem: the coastal tundra at Barrow, Alaska. Dowden, Hutchinson & Ross, Stroudsburg, Pennsylvania, U.S.A.
Callaghan. T. V., C. E. Tweedie, J. Ackerman, C. Andrews, J. Bergstedt, et al. 2012.Multi-Decadal Changes in Tundra Environments and Ecosystems: The International Polar Year-Back to the Future Project (IPY-BTF). Ambio 40:705-716.
Lara M. J, S. Villarreal, D. R. Johnson, R. D. Hollister, P. J. Webbe and C. E. Tweedie. 2012.Estimated change in tundra ecosystem function near Barrow, Alaska between 1972 and 2010.Environmental Research Letters 7:015507
Tweedie, C. E.2013. IPY Back to the Future (BTF): Re-sampling old research sites to assess change in high latitude terrestrial ecosystem structure and function. NSF Arctic Data Center. doi:10.5065/D6XS5SD1.
Villarreal, S., R. D. Hollister, D. R. Johnson, M. J. Lara, P. J. Webber, and C. E. Tweedie. 2012. Tundra vegetation change near Barrow, Alaska (1972-2010). Environmental Research Letters 7: 015508.
Villarreal, S. 2013. International Polar Year (IPY) Back to the Future (BTF): Changes in arctic ecosystem structure over decadal time scales. PhD thesis, The University of Texas at El Paso, El Paso, Texas, USA.
Webber, P. J. 2014. The nature and appropriateness, to the Arctic Vegetation Archive (AVA), of data sets gathered using the Webber plant community sampling method. In Walker, D.A. (Ed). Alaska Arctic Vegetation Archive Workshop, Boulder, Colorado, October 14-16, 2013. CAFF Proceedings Report #11. Akureyri, Iceland. ISBN: 978-9935-431-29-5.
Webber, P. J. and D. C. Ebert. 1973. Ordination and production of tundra vegetation from Niwot Ridge, Colorado, and Point Barrow, Alaska. U.S. International Biological Program, Washington DC Tundra Biome Data Report 73-22.
Webber, P. J. 1978. Spatial and temporal variation of the vegetation and its production, Barrow, Alaska. Pages 37-112 in L. L. Tieszen, editor. Vegetation and Production Ecology of an Alaskan Arctic Tundra. Springer-Verlag, New York, New York, U.S.A.
Webber, P. J., P. C. Miller, F. S. Chapin III, and B. H. McCown. 1980. The Vegetation Pattern and Succession. Pages 186-218 in Brown, J. et al., editors. An Arctic ecosystem: the coastal tundra at Barrow, Alaska. Dowden, Hutchinson & Ross, Stroudsburg, Pennsylvania, U.S.A.