Documentation Revision Date: 2018-12-31
Data Set Version: 1
Summary
These products were developed under the Circumpolar Arctic Vegetation Map (CAVM) project, an international effort to map the vegetation and associated characteristics of the circumpolar region using a common base map. The area of interest was defined by tundra vegetation, an Arctic climate and flora, with the tree line defining the southern limit. Mapping experts within nine Arctic regions prepared draft maps relying on literature sources and using geographic information technology for their portion of the Arctic, which were later synthesized to make the final geobotanical data products. It was the first vegetation map of an entire global biome at a comparable resolution (Walker et al., 2005). Additional circumpolar map products related to CAVM by area and attributes (e.g., landscapes and bioclimatic zones) that include more recent field and remote sensing data are also provided.
This data set is distributed in 11 data files. This includes four compressed directories (*.zip) containing shapefiles and seven files in GeoTIFF (*.tif) format.
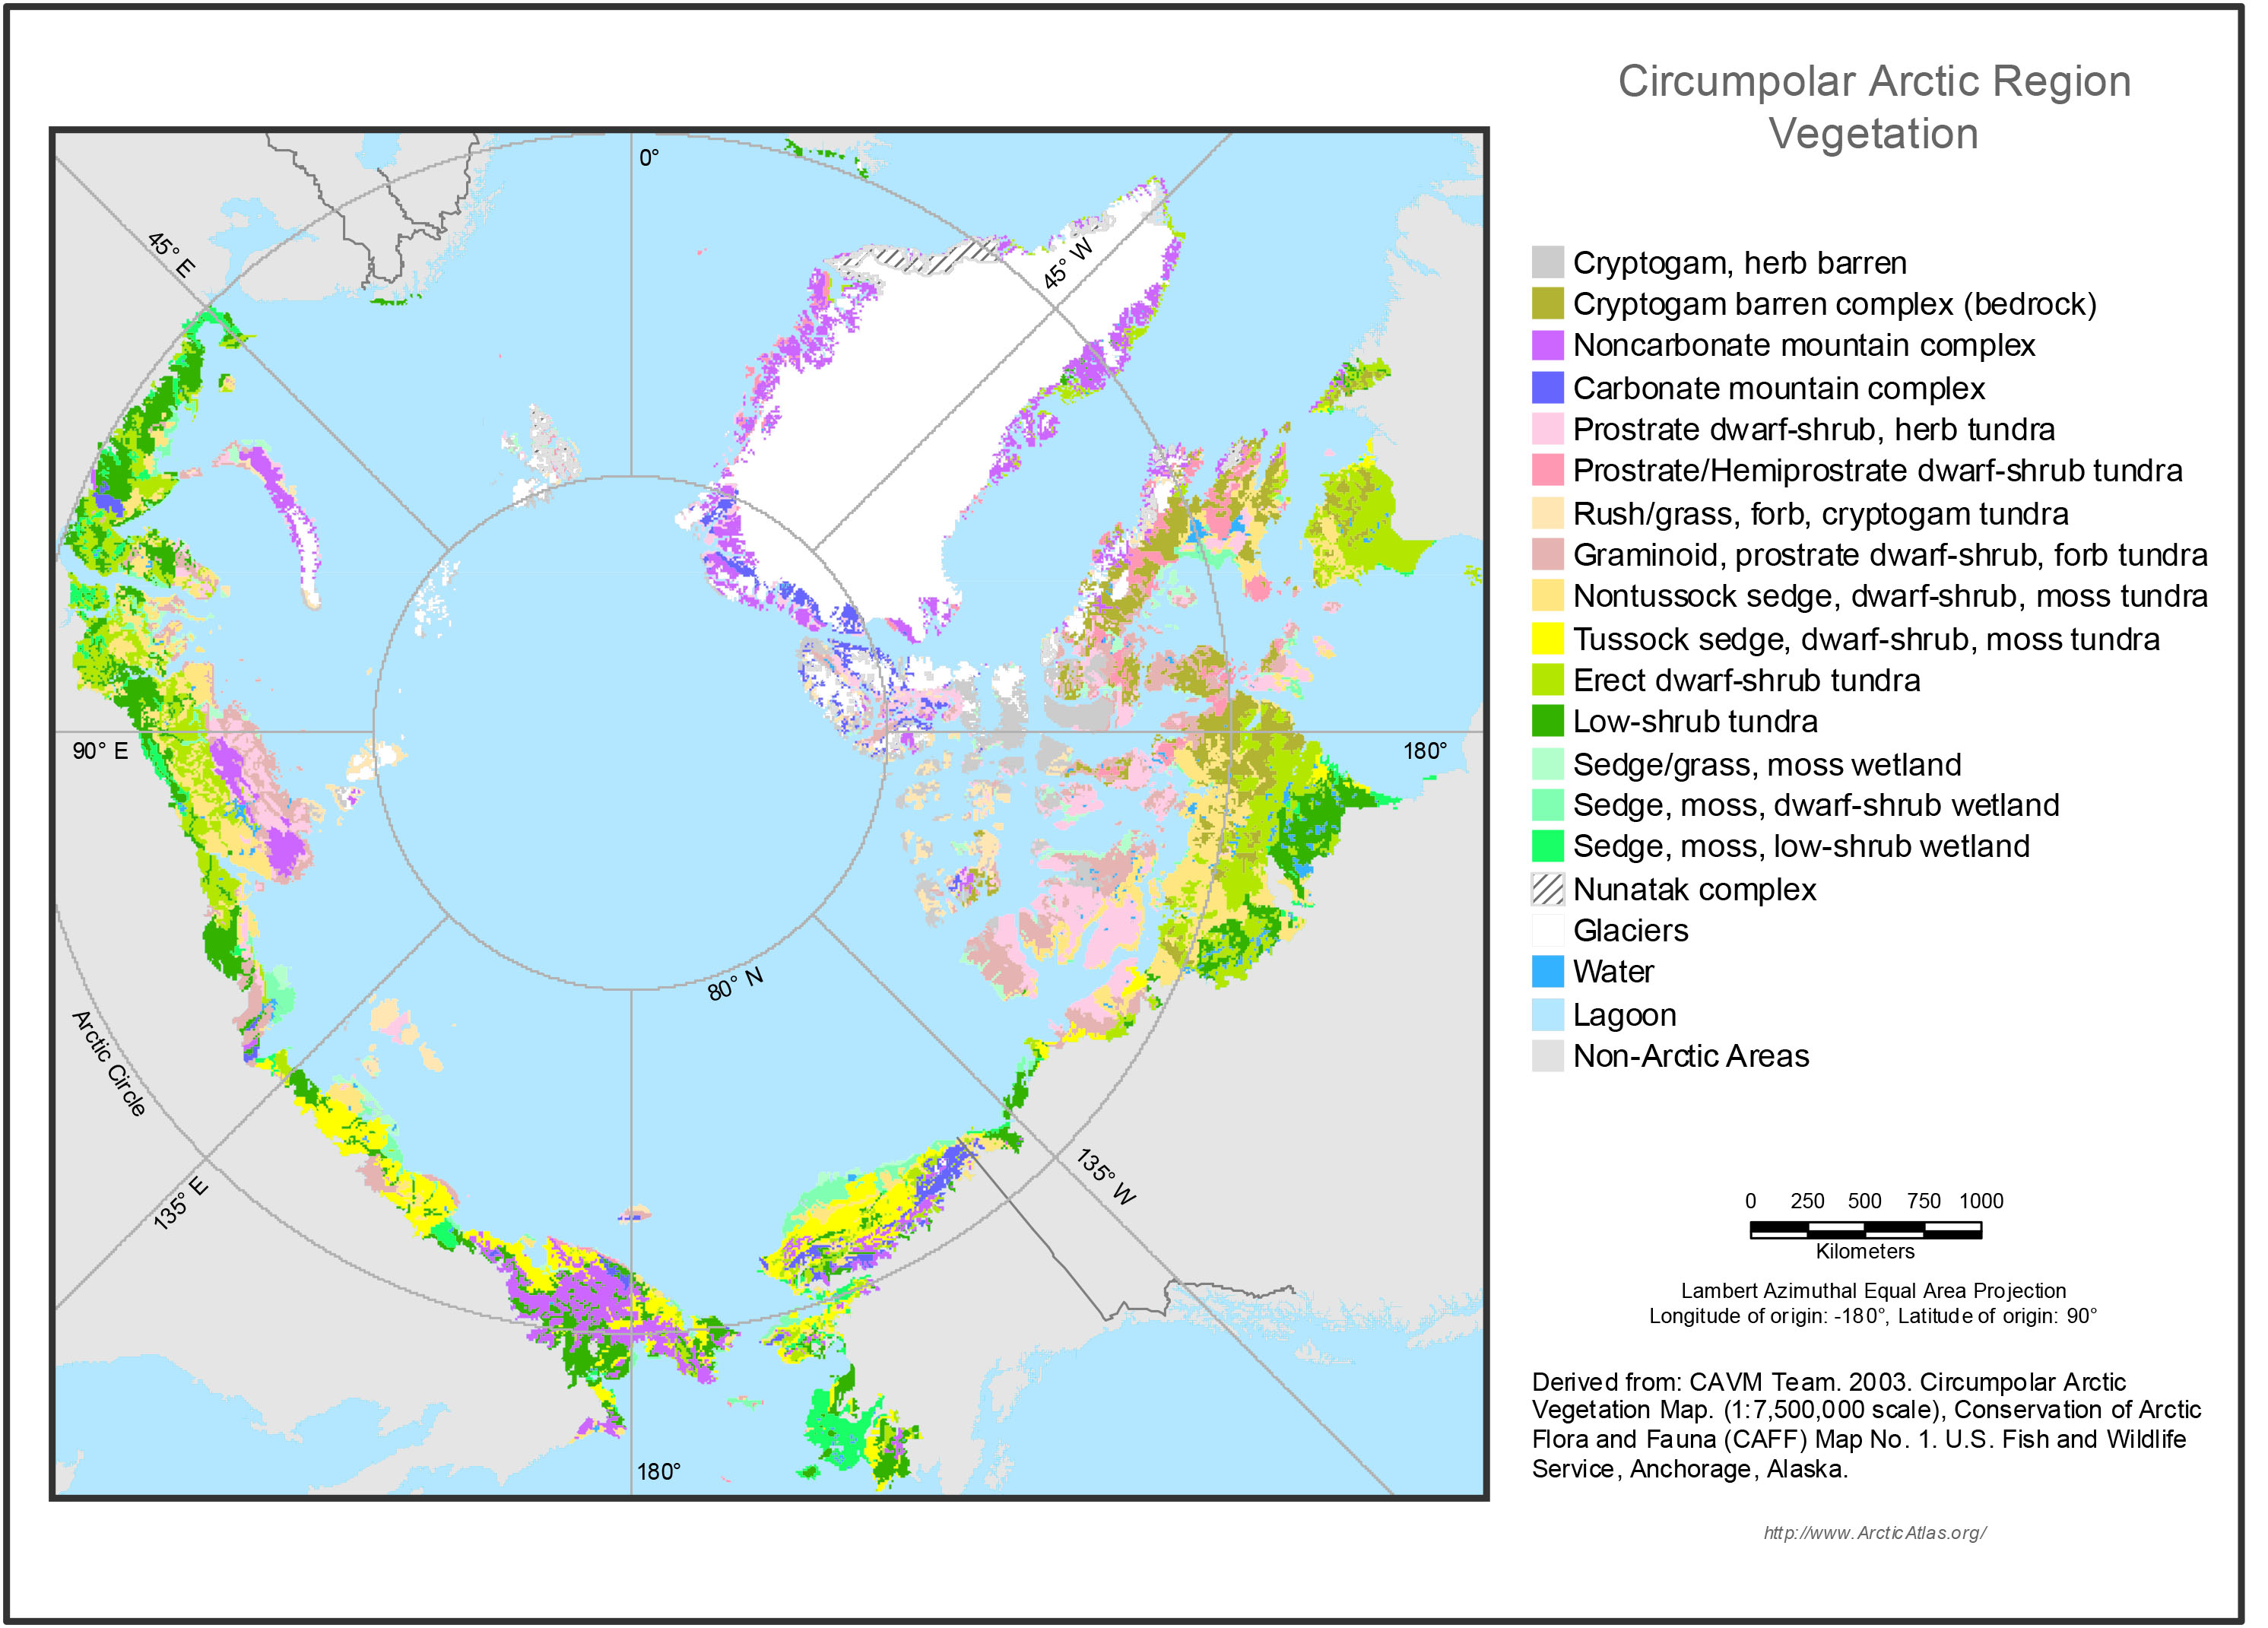
Figure 1. Circumpolar Arctic vegetation.
Citation
Walker, D.A., and M.K. Raynolds. 2018. Circumpolar Arctic Vegetation, Geobotanical, Physiographic Maps, 1982-2003. ORNL DAAC, Oak Ridge, Tennessee, USA. https://doi.org/10.3334/ORNLDAAC/1323
Table of Contents
- Data Set Overview
- Data Characteristics
- Application and Derivation
- Quality Assessment
- Data Acquisition, Materials, and Methods
- Data Access
- References
Data Set Overview
This data set provides the spatial distributions of vegetation types, geobotanical characteristics, and physiographic features for the circumpolar Arctic tundra biome for the period 1982-2003. Specific attributes include dominant vegetation, bioclimate subzones, floristic subprovinces, landscape types, lake coverage, Arctic treeline, elevation, and substrate chemistry data. Vegetation indices, trends, and biomass estimate products for the circumpolar Arctic through 2010 are also provided.
These products were developed under the Circumpolar Arctic Vegetation Map (CAVM) project, an international effort to map the vegetation and associated characteristics of the circumpolar region using a common base map. The area of interest was defined by tundra vegetation, an Arctic climate and flora, with the tree line defining the southern limit. Mapping experts within nine Arctic regions prepared draft maps relying on literature sources and using geographic information technology for their portion of the Arctic, which were later synthesized to make the final geobotanical data products. It was the first vegetation map of an entire global biome at a comparable resolution (Walker et al., 2005). Additional circumpolar map products related to CAVM by area and attributes (e.g., landscapes and bioclimatic zones) that include more recent field and remote sensing data are also provided.
Project: Arctic-Boreal Vulnerability Experiment (ABoVE)
The Arctic-Boreal Vulnerability Experiment (ABoVE) is a NASA Terrestrial Ecology Program field campaign that will take place in Alaska and western Canada between 2016 and 2021. Climate change in the Arctic and Boreal region is unfolding faster than anywhere else on Earth. ABoVE seeks a better understanding of the vulnerability and resilience of ecosystems and society to this changing environment.
Acknowledgements:
These data were obtained from the Alaska Arctic Geoecological Atlas (http://agc.portal.gina.alaska.edu), which provides access to existing Arctic vegetation plot and map data in support of the ABoVE campaign.
Related Publications:
Epstein, H.E., Raynolds, M.K., Walker, D.A., Bhatt, U.S., Tucker, C.J. and Pinzon, J.E., 2012. Dynamics of aboveground phytomass of the circumpolar Arctic tundra during the past three decades. Environmental Research Letters, 7(1), p.015506. http://dx.doi.org/10.1088/1748-9326/7/1/015506
Raynolds, M.K., Walker, D.A., Epstein, H.E., Pinzon, J.E. and Tucker, C.J., 2012. A new estimate of tundra-biome phytomass from trans-Arctic field data and AVHRR NDVI. Remote Sensing Letters, 3(5), pp.403-411. http://dx.doi.org/10.1080/01431161.2011.609188
Raynolds, M.K. and Walker, D.A., 2009. Effects of deglaciation on circumpolar distribution of arctic vegetation. Canadian Journal of Remote Sensing, 35(2), pp.118-129. http://dx.doi.org/10.5589/m09-006
Raynolds, M.K., Comiso, J.C., Walker, D.A. and Verbyla, D., 2008. Relationship between satellite-derived land surface temperatures, arctic vegetation types, and NDVI. Remote Sensing of Environment, 112(4), pp.1884-1894. http://dx.doi.org/10.1016/j.rse.2007.09.008
Walker, D.A., Raynolds, M.K., Daniëls, F.J., Einarsson, E., Elvebakk, A., Gould, W.A., Katenin, A.E., Kholod, S.S., Markon, C.J., Melnikov, E.S. and Moskalenko, N.G., 2005. The circumpolar Arctic vegetation map. Journal of Vegetation Science, 16(3), pp.267-282. http://dx.doi.org/10.1111/j.1654-1103.2005.tb02365.x
Walker, D.A., Gould, W.A., Maier, H.A. and Raynolds, M.K., 2002. The Circumpolar Arctic Vegetation Map: AVHRR-derived base maps, environmental controls, and integrated mapping procedures. International Journal of Remote Sensing, 23(21), pp.4551-4570. http://dx.doi.org/10.1080/01431160110113854
Data Characteristics
Spatial Coverage: Arctic Tundra Biome
Spatial Resolution: 1 km
Temporal Coverage: 1982-06-01 to 2010-09-03
Temporal Resolution: Annual
Study Area: (all latitudes and longitudes given in decimal degrees)
|
Site |
Westernmost Longitude |
Easternmost Longitude |
Northernmost Latitude |
Southernmost Latitude |
|
Circumpolar Arctic |
-180 |
180 |
90 |
55.8 |
Data File Information:
This data set is distributed in 11 data files: four compressed directories (*.zip) containing shapefiles (*.shp) and seven files in GeoTIFF (*.tif) format. The directory 'geobotanical_2003_layers.zip' contains six shapefiles.
Shapefiles
The shapefiles and their descriptions are listed in the Table 1. These files provide the distributions of various features in the circumpolar arctic region in *.shp format. The *.zip files contain the .shp, .shx, .dbf, .prj files, that support the shapefile and a .lyr file. Some of the files also contain additional files such as .sbn or .sbx (spatial index files). All shapefiles are stored in the GCS_WGS_1984 geographic coordinate system and Lambert_Azimuthal_Equal_Area projection.
Table 1: Shapefiles and their descriptions
|
File Name |
Description |
|
aga_CAVM.zip |
This is the circumpolar Arctic vegetation product (CAVM), which may be used to produce a geobotanical map of the entire Arctic. |
|
aga_circumpolar_coastline_treeline_2003.zip |
The circumpolar arctic region tree line. The extent is the Arctic, defined as the Arctic Bioclimate Zone, and the tree line defines the southern limit of this zone. This excludes tundra regions that lack an Arctic flora, such as the boreal oceanic areas of Iceland, the Aleutian Island, and the alpine tundra regions south of latitudinal tree line. In some regions of the Arctic, especially Canada and Chukotka, the forest tundra transition is gradual and interpretation of tree line directly from the AVHRR imagery was not possible. Coastline is from the Digital Chart of the World (ESRI,1993). Small islands less than 49 km2 were deleted, and the coastlines were simplified by removing arc vertices that were closer together than 5,000 m. |
|
aga_circumpolar_landscape_age_2009.zip |
Landscape age indicating the length of time (in thousands of years) that Arctic landscapes have been available for plant colonization and the development of plant communities. |
|
geobotanical_2003_layers.zip |
Contains the following six shapefiles, which were extracted from the geobotanical data contained in the fields of the file: aga_CAVM.shp. |
|
circumpolar_arctic_bioclimate_subzones_2003 |
Circumpolar Arctic bioclimatic subzones from A-E, where A is the coldest and E is the warmest |
|
aga_circumpolar_floristic_2003 |
Floristic sectors of the circumpolar Arctic |
|
aga_circumpolar_landscape_2003 |
Physiography of the circumpolar arctic region |
|
aga_circumpolar_substrate_ph_2003 |
Identifies acidic areas, carbonate, neutral, saline, and glacier or ice cap areas in the circumpolar Arctic region. |
|
aga_circumpolar_vegetation_2003 |
Zonal vegetation types within each identified polygon and over five broad physiognomic categories |
|
aga_circumpolar_lake_cover_2003 |
Lake cover based on the number of AVHRR water pixels in each mapped polygon, divided by the number of pixels in the polygon; pixels within 2 km of the coastline were excluded to avoid ocean water. |
Table 2: Geographic extent of the shapefiles
|
Shapefile Name |
Geographic Extent |
|||
|
North |
South |
East |
West |
|
|
aga_CAVM |
83.627419 |
55.796231 |
-180 |
180 |
|
circumpolar_arctic_bioclimate_subzones_2003 |
83.627419 |
55.796231 |
-180 |
180 |
|
aga_circumpolar_floristic_2003 |
83.627419 |
55.796231 |
-180 |
180 |
|
aga_circumpolar_landscape_2003 |
83.627419 |
55.796231 |
-180 |
180 |
|
aga_circumpolar_substrate_ph_2003 |
83.627419 |
55.796231 |
-180 |
180 |
|
aga_circumpolar_vegetation_2003 |
83.627419 |
55.796231 |
-180 |
180 |
|
aga_circumpolar_lake_cover_2003 |
83.627419 |
55.796231 |
-180 |
180 |
|
aga_circumpolar_coastline_treeline_2003 |
90 |
39.71032 |
-180 |
180 |
|
aga_circumpolar_landscape_age_2009 |
83.627419 |
55.796231 |
-180 |
180 |
Data Descriptions:
The attribute names, units, and descriptions for each of the shapefiles are listed below.
Table 3: aga_CAVM.shp
|
Attribute Name |
Description |
|
BIOZONE |
Bioclimate Subzone |
|
PHYTO |
Floristic Provinces |
|
LAND |
Landscape |
|
CHEM |
Substrate pH |
| PHYSIOG |
Vegetation |
|
PCTWATER |
Lake Cover |
Table 4: Circumpolar_arctic_bioclimate_subzones_2003.shp
|
Attribute Name |
Description |
|
BIOZONE |
Bioclimatic subzones: 0 = Glaciers |
Table 5: aga_circumpolar_floristic_2003.shp
|
Attribute Name |
Description |
|
PHYTO |
Floristic provinces: |
Table 6: aga_circumpolar_landscape_2003.shp
|
Attribute Name |
Description |
|
LAND |
Physiography: |
Table 7: aga_circumpolar_substrate_ph_2003.shp
|
Attribute Name |
Description |
|
CHEM |
Parent material chemistry: |
Table 8: aga_circumpolar_vegetation_2003.shp
|
Attribute Name |
Description |
|
PHYSIOG |
There are there are 21 distinct physiogonomic unit codes: 14 vegetation types and seven large areas of azonal vegetation that are dependent on specific soil or hydrological conditions, such as mountain ranges and large wetlands. |
Table 9: aga_circumpolar_lake_cover_2003.shp
|
Attribute Name |
Description |
|
PCTWATER |
Percent lake cover |
Table 10: aga_circumpolar_coastline_treeline_2003.shp
|
Attribute Name |
Description |
|
WATER |
Presence or absence of water |
Table 11: aga_circumpolar_landscape_age_2009.shp
|
Attribute Name |
Description |
|
AGE |
Landscape age; 1000s of years; 9999= unknown |
GeoTIFF Files
The seven GeoTIFF (.tif) files along with their descriptions are listed in Table 12. All the GeoTIFF files are in WGS84 datum with map units in meters. The spatial attributes of each of the GeoTIFF files are listed in Table 13.
Table 12: GeoTIFF (.tif) files and their descriptions
|
File Name |
Description |
|
aga_circumpolar_avhrr_cir_1995.tif |
Advanced Very High Resolution Radiometer (AVHRR) Channel 1 and Channel 2 data, displayed as false color-infrared. Pixel values are a maximum NDVI value composite from 11 July to 30 August 1993 and 1995 in the circumpolar arctic region. |
|
aga_circumpolar_avhrr_ndvi_1995.tif |
NDVI calculated from Channel 1 and Channel 2 data. Pixel values are a maximum NDVI value composite from 1 April to 31 October 1993 and 1995 in the circumpolar arctic region. |
|
aga_circumpolar_avhrr_ndvi_trend_1982-2010.tif |
NDVI trend in Arctic NDVI calculated from a linear regression of NDVI values for all years 1982-2010. Pixels with significant trends (p <0.05) were retained. |
|
aga_circumpolar_avhrr_biomass_2010.tif |
Estimated above ground plant biomass for the tundra biome based on trans-Arctic field data and AVHRR NDVI. Cell values: Arctic biomass; kg/m2. |
|
aga_circumpolar_avhrr_biomass_trend_1982-2010.tif |
Arctic biomass calculated from a linear regression of biomass values for all years 1982-2010 (Epstein et al., 2012). Pixels with significant trends (p < |
|
aga_circumpolar_avhrr_swi_1982-2003.tif |
Summer Warmth Index (SWI) based on AVHRR surface temperature data (Raynolds et al, 2008). SWI is the sum of monthly mean temperatures above 0 degrees Celsius. Data in degrees C for the months of May-September, averaged for the years 1982-2003 in the circumpolar arctic region. |
|
aga_circumpolar_elevation.tif |
Landform elevations in the circumpolar arctic region based on Digital Chart of the World (ESRI, 1993) |
Data Descriptions:
Table 13: Geographic extent and attributes of the GeoTIFF files
|
File Name |
Geographic Extent |
Fill Value |
Data Type |
Number of Bands |
Range of Values |
|||
|
North |
South |
East |
West |
|
|
|
|
|
|
aga_circumpolar_avhrr_cir_1995.tif |
90 |
31.28806 |
180 |
-180 |
-32768 |
int16 |
2 |
|
|
aga_circumpolar_avhrr_ndvi_1995.tif |
90 |
31.28806 |
180 |
-180 |
127 |
float32 |
1 |
117 to 245 |
|
aga_circumpolar_avhrr_ndvi_trend_1982-2010.tif |
90 |
29.01694 |
180 |
-180 |
-3.4E+38 |
float32 |
2 |
-0.036 to 0.459 |
|
aga_circumpolar_avhrr_biomass_2010.tif |
90 |
44.305 |
180 |
-180 |
-3.4E+38 |
float32 |
1 |
0.083 to 0.97 |
|
aga_circumpolar_avhrr_biomass_trend_1982-2010.tif |
90 |
44.305 |
180 |
-180 |
-3.4E+38 |
float32 |
1 |
-0.029 to 0.03 |
|
aga_circumpolar_avhrr_swi_1982-2003.tif |
90 |
30.96583 |
180 |
-180 |
-3.4E+38 |
float32 |
1 |
0 to136.142 |
|
aga_circumpolar_elevation.tif |
90 |
17.7625 |
180 |
-180 |
-32768 |
int16 |
1 |
-142 to 5927 |
Companion File Information: There are two companion files - CAVM_procedure.pdf which describes the method for creating the Circumpolar Arctic Vegetation Map (CAVM) and Circumpolar_Map_Images.zip that contains images derived from the maps.
Application and Derivation
These data have consistent treatment of vegetation types, geobotanical characteristics, and physiographic features across the circumpolar Arctic tundra and would be useful to land-use and climate change applications.
Quality Assessment
The accuracy of the bioclimate subzone boundaries is an issue. More accurate maps of temperatures that portray maritime-continental influences and elevation would help to more accurately delineate the boundary zones (Walker et al., 2005). In addition, zonal vegetation is dependent on temperature, precipitation, landscape age and substrate chemistry and it is often not clear what the zonal vegetation in a given subzone should be.
Data Acquisition, Materials, and Methods
Site description
The circumpolar Arctic tundra vegetation region is north of the climatic limit of trees and is characterized by an arctic climate, arctic flora, and tundra vegetation. It excludes tundra regions than have a boreal flora such as the boreal oceanic areas of Iceland and the Aleutian Islands and alpine tundra south of the latitudinal treeline.
Mapping Procedure
The products included with this data set were developed under the Circumpolar Arctic Vegetation Map (CAVM) project, an international effort to map the vegetation and associated characteristics of the circumpolar region using a common base map The mapping procedure relied mostly on literature, expert knowledge, and close examination of AVHRR imagery used as the base map (Walker et al, 2002):
- The base map (aga_circumpolar_avhrr_cir_1995.tif) is a 1:4-million-scale false color infrared (CIR) image derived from the Advanced Very High Resolution Radiometer (AVHRR).
- Mapping experts within nine Arctic regions (Canada, Greenland, Iceland, Norway including Svalbard, European Russia, West Siberia, East Siberia, Chukotka, and Alaska) collected relevant maps and literature sources for their region and prepared draft maps using geographic information technology (ArcInfo) of their portion of the Arctic. All hard copy maps that were deemed useful for helping to define vegetation boundaries were then photographically reproduced to the 1:4 M scale of the base map, and the boundaries adjusted to match the AVHRR CIR image.
- The third step was to define the vegetation transitions in the Arctic, and it was decided to use the approach of the Panarctic Flora (PAF) initiative (Elvebakk et al., 1999) which considered the Arctic to be equivalent to the five Arctic Bioclimate Zones, the area of the Earth with tundra vegetation, an Arctic climate and Arctic flora, with the tree line defining the southern limit. The five bioclimate subzones are based on a combination of summer temperature and vegetation. Subzone A is the coldest and most barren subzone, and Subzone E is the warmest and most lushly vegetated.
- After the base map was established with the bioclimate subzones, additional geobotanical features were examined including the floristic features, elevation and landscapes, lake cover, and substrate pH.
The attributes from the maps in the steps above were later integrated to make the final circumpolar Arctic vegetation map (aga_CAVM.zip). Area analysis of the map was done according to bioclimate subzones, and country. The integrated mapping procedures resulted in other maps of vegetation, topography, soils, landscapes, lake cover, substrate pH, and above-ground biomass.
The mapping was done by drawing polygon boundaries on frosted Mylar sheets overlaid on the AVHRR imagery. Boundaries were drawn around areas of homogeneous color and texture, guided by boundaries from the other source maps.
Look-up tables of dominant plant community types were made for most regions of the map based on the vegetation literature from each region. Separate tables were also made for each floristic subprovince within a given region. The literature sources were provided in the tables. From the look-up tables, the expected dominant plant community type was derived for each combination of floristic subprovince, bioclimate subzone, soil reaction class, and topographic position.
Since very steep bioclimate gradients occur in mountains these areas were mapped as complexes of elevation belts. The mountainous areas are shown as hachures-the background color indicates the nature of the bedrock and the color of the hachure indicates the bioclimate subzone at the base of the mountains.
The final result (aga_CAVM.zip) is a single Arc/Info coverage where each polygon was coded with the following attributes: dominant vegetation, bioclimate subzone, floristic subprovinces, landscape type, lake cover, and substrate chemistry. Elevation and maximum NDVI are in separate raster coverages at 1-km pixel size (Walker et al., 2005, 2002).
Detailed Product-Attribute Information
This section provides additional information pertaining to the geobotanical attributes provided in each data file. In this section, CAVM products are described first and then related data products.
CAVM map products
aga_CAVM.zip: The Circumpolar Arctic Vegetation Map (CAVM), is a geobotanical map of the entire Arctic. It is the first vegetation map of an entire global biome at a comparable resolution (Walker et al., 2005). The aga_CAVM.zip map file attributes are dominant vegetation, bioclimate subzone, floristic subprovince, landscape type, lake cover, and substrate chemistry data. Individual shapefiles of these attributes are also provided.
aga_circumpolar_avhrr_cir_1995.tif: This was the base map false color infrared (CIR) image derived from the AVHRR, a sensor on board the National Oceanic and Atmospheric Administration (NOAA) satellites. This is a map of vegetation green-up-to-senescence period from 11 July to 30 August 1993 and 1995 in the circumpolar arctic region (Walker et al, 2002). The image was composed of 1-km x 1-km picture elements (pixels). Each pixel portrays the vegetation at the maximum greenness during two years of 10-day composite data (USDA-NRCS, 2004) between 11.07 and 30.08 in 1993 and 1995. Shorelines were adapted from the Digital Chart of the World (DCW). Small islands less than 49 km2 were deleted from the DCW files, and the coastlines were simplified by removing arc vertices that were closer together than 5,000 m. Glaciers, oceans and sea ice were masked out of the image using information from the DCW. The final image shows the Arctic at maximum greenness with minimum snow and cloud cover.
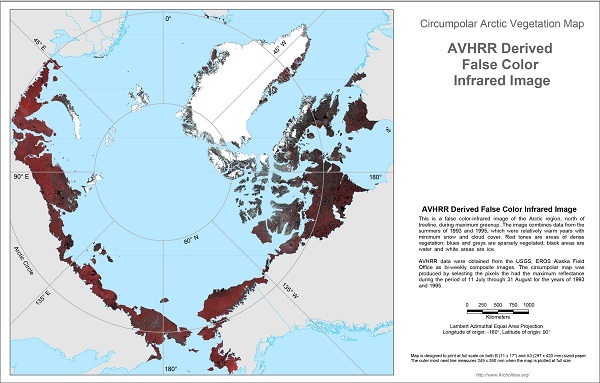
Figure 2. AVHRR false color infrared image used to make the base map.
circumpolar_arctic_bioclimate_subzones_2003.zip: A shapefile of bioclimate subzones from A-E, where A is the coldest and E is the warmest. In order to characterize the transitions in vegetation that occur across the Arctic’s roughly 10 degrees C difference in mean July temperature, the approach of (Elvebakk et al., 1999) was adopted with some modification.
aga_circumpolar_floristic_2003.zip: A shapefile of the floristic sectors based on the PAF project (Elvebakk et al., 1999). The Arctic has a relatively consistent core of plant species that occur around the circumpolar region, but there is also considerable east to west variation in the regional floras, particularly in subzones C, D, and E. This variation is due to a number of factors, including different histories related to glaciations, land bridges, and north-south trending mountain ranges, primarily in Asia. These influences have restricted the exchange of species between parts of the Arctic. Russian geobotanists have described a set of floristic subdivisions based primarily on these floristic differences (Yurtsev 1994). The map was adapted from the PAF project (Elvebakk et al., 1999) based largely on Yurtsev’s approach.
aga_circumpolar_substrate_ph_2003.zip: A shapefile depicting acidic areas, carbonate, circumneutral, saline, and glacier or ice cap areas. This product was derived from a wide variety of available sources including soil, surface-geology, and bedrock-geology maps, and from spectral patterns that could be recognized on the AVHRR base image. The pH values of the three categories were based on the field experience and hundreds of Arctic vegetation releve plots sampled by D.A. Walker on the North Slope and Seward Peninsula of Alaska, in consultation with F.J.A. Daniëls (Greenland) and N.G. Moskalenko (Yamal and Gydan Peninsulas, Russia).
aga_circumpolar_vegetation_2003.zip: A shapefile of zonal vegetation within each mapped polygon. The legend contains five broad physiognomic categories:
- B-barrens
- G-graminoid-dominated tundras
- P-prostrate-shrub-dominated tundras
- S-erect-shrub-dominated tundras, and
- W-wetlands
The five categories were divided into 21 subunits: 14 of vegetation and seven large areas of azonal vegetation that are dependent on specific soil or hydrological conditions, such as mountain ranges and large wetlands. The units are named according to dominant plant functional types except in the mountains where complexes of vegetation are named according to the dominant bedrock (carbonate and noncarbonate mountain complexes). The plant functional types are based on a variety of criteria including growth form (e.g., graminoids, shrubs), size (e.g., dwarf and low shrubs), and taxonomical status (e.g., sedges, rushes, grasses). The vegetation units take into special consideration the stature of woody shrubs, which is a major diagnostic feature of zonal vegetation in the Arctic (Walker et al., 2002, Yurtsev 1994). The very steep bioclimate gradients in the mountainous areas were classified as complexes of elevation belts.
Vegetation in mountainous regions changes with elevation, forming distinct elevation belts which correspond approximately to bioclimatic subzones. Vegetation is also modified by local topographic effects such as slope, aspect, and cold-air drainage.
aga_circumpolar_landscape_2003.zip: A shapefile of seven surface features (physiography) in the circumpolar arctic region. The landscape type was derived from visual interpretation of the AVHRR false-CIR image supplemented with the topographic data and regional physiographic maps to show areas with plains, hills and mountains.
aga_circumpolar_lake_cover_2003.zip: A shapefile of lake cover based on the number of AVHRR water pixels in each mapped polygon, divided by the number of pixels in the polygon; pixels within two km of the coastline were excluded to avoid ocean water. Since the imagery has a pixel size of 1-km2, lake cover is underestimated for areas with many small lakes. No pixels were sampled within two pixels (2 km) of the coastline to avoid including ocean pixels. The percent cover data were grouped into six categories: < 2%, 2-10%, 10-25%, 25-50%, 50-75%, and 75-100%. Since the sum of the last three categories was only 1.5%, (the 75-100% category covered 1% of the map), they were combined one category, >25%.
Related Map Products:
aga_circumpolar_avhrr_ndvi_1995.tif: A GeoTIFF of NDVI from 11 July to 30 August 1993 and 1995 in the circumpolar arctic region. NDVI was calculated as: NDVI = (NIR - R) / (NIR + R), where NIR is the spectral reflectance in the AVHRR near-infrared channel (0.725-1.1 µm, channel 2) where light-reflectance from the plant canopy is dominant, and R is the reflectance in the red channel (0.5 to 0.68 µm, channel 1), the portion of the spectrum where chlorophyll absorbs maximally (Bhatt et al., 2010). Advanced Very High Resolution Radiometer (AVHRR) data were obtained from the USGS Global AVHRR 10-day composite data (http://earthexplorer.usgs.gov/). Glaciers and oceans were masked out using information from the Digital Chart of the World (ESRI 1993). The image is composed of 1 x 1-km pixels. The color of each pixel was determined by its reflectance at the time of maximum greenness, selected from 10-day composite images from 11 July to 30 August 1993 and 1995 (Markon et al., 1995). These intervals cover the vegetation green-up-to-senescence period during two relatively warm years when summer-snow cover was at a minimum in the Arctic (Markon et al., 1995).
Circumpolar_AVHRR_NDVI_trend_1982_2010.tif: A GeoTIFF of NDVI trend in Arctic NDVI calculated from a linear regression of NDVI values for all years 1982-2010. NDVI was calculated as: NDVI = (NIR - R) / (NIR + R), where NIR is the spectral reflectance in the AVHRR near-infrared channel (0.725-1.1 µm, channel 2) where light-reflectance from the plant canopy is dominant, and R is the reflectance in the red channel (0.5 to 0.68 µm, channel 1), the portion of the spectrum where chlorophyll absorbs maximally. Trend in Arctic NDVI was calculated from a linear regression of NDVI values for all years 1982-2010. Pixels with significant trends (p < 0.05) were retained (Bhatt et al., 2010).
aga_circumpolar_elevation_2003.tif: A GeoTIFF of landform elevations in the circumpolar arctic region. The elevations were derived from the Digital Chart of the World (ESRI 1993). The relationship between elevation and temperature corresponds to the ecological adiabatic lapse rate of -6 degrees C per 1,000- m elevation (Barry & Chorley 1987). An additional < 100-m belt delineates the extensive low flat plains of the Arctic. The topography was used to help develop a landscape distribution that showed broad physiographic regions.
aga_circumpolar_avhrr_swi_1982_2003.tif: A GeoTIFF of Summer Warmth Index (SWI) temperatures in degrees C for the months of May-September, and for the years 1982-2003 in the circumpolar arctic region. SWI is the sum of monthly mean temperatures above 0 degrees Celsius. These data were calculated from monthly AVHRR thermal infrared data (Raynolds et al, 2008).
aga_circumpolar_avhrr_biomass_2010.tif: A GeoTIFF of estimated above ground plant biomass for the tundra biome based on trans-Arctic field data and AVHRR NDVI (Raynolds et al., 2012). Above-ground phytomass was sampled on transects along the Arctic bioclimate gradient in North America (1750 km long, eight locations sampled 2003-2006) and Eurasia (1,500 km, five locations sampled 2007-2010). The study locations were chosen to represent each of the five Arctic bioclimate sub-zones. NDVI values for each phytomass sampling site were extracted from two different NDVI data sets with different spatial resolutions. The maximum NDVI for the specific year during which the phytomass data were collected for each sampling site was extracted from the 8-km GIMMS3g AVHRR data. The relationship between landscape-level zonal phytomass sampled along the Arctic transects and satellite NDVI values were compared using logarithmic regression (y = 0.383 lnx + 0.994,R2 = 0.94, p < 0.001). A logarithmic equation has been shown to best correlate with phytomass, since NDVI is asymptotically non-linear as it approaches its maximum value of 1 for areas with dense plant cover. The regression equation relating above-ground phytomass to the GIMMS3g data for the years sampled was applied to all pixels within that image to create a map showing the distribution of Arctic phytomass and to calculate an estimate of total Arctic aboveground phytomass.
aga_circumpolar_avhrr_biomass_trend_1982-2010.tif: A GeoTIFF of Arctic biomass calculated from a linear regression of biomass values for all years 1982-2010 (Epstein et al., 2012). Biomass was calculated from the relationship between AVHRR NDVI and ground sampling of biomass. Above-ground phytomass was sampled on transects along the Arctic bioclimate gradient in North America (1,750-km long, eight locations sampled 2003-2006) and Eurasia (1,500 km, five locations sampled 2007-2010). The study locations were chosen to represent each of the five Arctic bioclimate sub-zones. The relationship between landscape-level zonal phytomass sampled along the Arctic transects and satellite NDVI values were compared using logarithmic regression (y = 0.383 Inx + 0.994,R2 = 0.94, p < 0.001). This relationship was applied to the GIMMS3g maximum annual NDVI data (1982–2010) to calculate biomass. Trends in biomass were calculated by applying a linear regression to the time series for each pixel. Pixels with significant trends (p < 0:05) were retained (Epstein et al., 2012).
aga_circumpolar_coastline_treeline_2003.zip: A shapefile of the circumpolar arctic region tree line. The spatial extent is the Arctic, defined as the Arctic Bioclimate Zone, and the tree line defines the southern limit of this zone. This map excludes tundra regions that lack an Arctic flora, such as the boreal oceanic areas of Iceland, the Aleutian Island, and the alpine tundra regions south of latitudinal tree line. In some regions of the Arctic, especially Canada and Chukotka, the forest tundra transition is gradual and interpretation of tree line directly from the AVHRR imagery was not possible. Additional sources for the tree line included:
- Alaska: The Ecoregions map of Alaska (Joint Federal State Land Use Planning Commission for Alaska 1973)
- Canada: Canadian maps of tree line (Timoney et al., 1992) and the extensive personal experience of S. Zoltai, who had studied the Canadian boreal forest for several decades
- Russia: Vegetation maps at 1:2.5 million and 1:4 million scales and the personal communication of Natalia Moskalenko (Earth Cryosphere Institute) and Alexei Polezhaev (Zonal Research Institute of Northeast Agriculture, Magadan).
The coastline was derived from the Digital Chart of the World (ESRI, 1993). Small islands less than 49 km2 were deleted, and the coastlines were simplified by removing arc vertices that were closer together than 5,000 m.
aga_circumpolar_landscape_age.zip: A shapefile of landscape age indicating the length of time (in thousands of years) that Arctic landscapes have been available for plant colonization and the development of plant communities (Raynolds et al., 2009). Areas for which no Wisconsin glaciation is known, were coded as 9999. These data came mostly from Ehlers, J. and P. L. Gibbard (2004). The product was based on the Circumpolar Arctic Vegetation Map shapefile (aga_CAVM.zip), with an attribute added for landscape age. Polygon boundaries were modified where necessary to follow glaciation data.
This data set was provided by the GINA repository at http://geobotanical.portal.gina.alaska.edu/catalogs/9603-circumpolar-arctic-vegetation-map-all-layers. For more information on this dataset please refer to http://www.arcticatlas.org/maps/themes/cp/
Data Access
These data are available through the Oak Ridge National Laboratory (ORNL) Distributed Active Archive Center (DAAC).
Circumpolar Arctic Vegetation, Geobotanical, Physiographic Maps, 1982-2003
Contact for Data Center Access Information:
- E-mail: uso@daac.ornl.gov
- Telephone: +1 (865) 241-3952
References
Barry, R.G. & Chorley, R.J. 1987. Atmosphere, weather and climate. Methuen, New York, NY, US.
Bhatt, U.S., Walker, D.A., Raynolds, M.K., Comiso, J.C., Epstein, H.E., Jia, G., Gens, R., Pinzon, J.E., Tucker, C.J., Tweedie, C.E. and Webber, P.J., 2010. Circumpolar Arctic tundra vegetation change is linked to sea ice decline. Earth Interactions, 14(8), pp.1-20.
Ehlers, J. and Gibbard, P.L., 2004. Quaternary glaciations-extent and chronology: part I: Europe (Vol. 2). Elsevier.
Elvebakk, A., Elven, R. and Razzhivin, V.Y., 1999. Delimitation, zonal and sectorial subdivision of the Arctic for the Panarctic Flora Project. The species concept in the High North-A Panarctic Flora Initiative, pp.375-386.
Epstein, H.E., Raynolds, M.K., Walker, D.A., Bhatt, U.S., Tucker, C.J. and Pinzon, J.E., 2012. Dynamics of aboveground phytomass of the circumpolar Arctic tundra during the past three decades. Environmental Research Letters, 7(1), p.015506. http://dx.doi.org/10.1088/1748-9326/7/1/015506
ESRI 1993. The digital chart of the World for use with ARC/INFO™ data dictionary. Environmental Systems Research Institute, Redlands, CA, US.
Joint Federal-State Land Use Planning Commission for Alaska, 1973, Major ecosystems of Alaska [map]: U.S. Geological Survey, scale 1:2,500,000.
Markon, C.J., Fleming, M.D. and Binnian, E.F., 1995. Characteristics of vegetation phenology over the Alaskan landscape using AVHRR time-series data. Polar Record, 31(177), pp.179-190.
Raynolds, M.K., Comiso, J.C., Walker, D.A. and Verbyla, D., 2008. Relationship between satellite-derived land surface temperatures, arctic vegetation types, and NDVI. Remote Sensing of Environment, 112(4), pp.1884-1894. http://dx.doi.org/10.1016/j.rse.2007.09.008
Raynolds, M.K. and Walker, D.A., 2009. Effects of deglaciation on circumpolar distribution of arctic vegetation. Canadian Journal of Remote Sensing, 35(2), pp.118-129. http://dx.doi.org/10.5589/m09-006
Raynolds, M.K., Walker, D.A., Epstein, H.E., Pinzon, J.E. and Tucker, C.J., 2012. A new estimate of tundra-biome phytomass from trans-Arctic field data and AVHRR NDVI. Remote Sensing Letters, 3(5), pp.403-411. http://dx.doi.org/10.1080/01431161.2011.609188
Timoney, K.P., La Roi, G.H., Zoltai, S.C. and Robinson, A.L., 1992. The high subarctic forest-tundra of northwestern Canada: position, width, and vegetation gradients in relation to climate. Arctic, pp.1-9.
USDA-NRCS 2004. The PLANTS database, Version 3.5. URL: http://plants.usda.gov. National Plant Data Center, Baton Rouge, US.
Walker, D.A., Gould, W.A., Maier, H.A. and Raynolds, M.K., 2002. The Circumpolar Arctic Vegetation Map: AVHRR-derived base maps, environmental controls, and integrated mapping procedures. International Journal of Remote Sensing, 23(21), pp.4551-4570. http://dx.doi.org/10.1080/01431160110113854
Walker, D.A., Raynolds, M.K., Daniëls, F.J., Einarsson, E., Elvebakk, A., Gould, W.A., Katenin, A.E., Kholod, S.S., Markon, C.J., Melnikov, E.S. and Moskalenko, N.G., 2005. The circumpolar Arctic vegetation map. Journal of Vegetation Science, 16(3), pp.267-282. http://dx.doi.org/10.1111/j.1654-1103.2005.tb02365.x
Yurtsev, B.A., 1994. Floristic division of the Arctic. Journal of Vegetation Science, 5(6), pp.765-776.