Documentation Revision Date: 2021-12-07
Dataset Version: 1
Summary
Flux estimates with chamber (19% of the monthly observations), snow diffusion (3%), and eddy covariance (78%) techniques are included. The largest number of observations were collected during the climatological summer (June-August; 32%). Fewer observations were available for autumn (September-October; 25%), winter (December-February; 18%), and spring (March-May; 25%).
There is one data file in comma-separated value (*.csv) format included in this dataset.
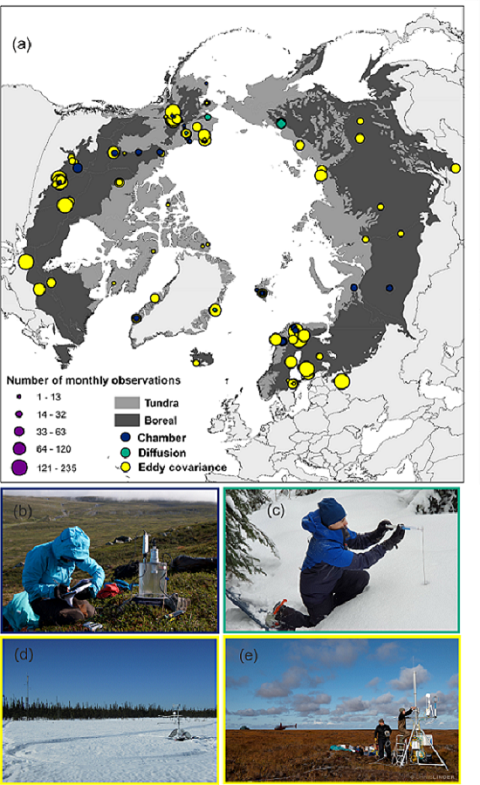
Figure 1. Map showing the distribution and measurement technique at each site (a), and examples of a manual chamber (b), diffusion measurements (c), and two eddy covariance towers in a wetland-forest and tundra ecosystem (d-e). Photographs were taken in Kilpisjarvi, Finland (July 2016), Montmorency forest, Canada (April 2021), Scotty Creek, Canada (April, 2014), and Yukon-Kuskokwim Delta, Alaska (September 2019). Image credits to: Markus Jylha, Alex Mavrovic, Gabriel Hould Gosselin, Chris Linder, Manuel Helbig.
Citation
Virkkala, A-M., S. Natali, B.M. Rogers, J.D. Watts, K. Savage, S.J. Connon, M.E. Mauritz-tozer, E.A.G. Schuur, D.L. Peter, C. Minions, J. Nojeim, R. Commane, C.A. Emmerton, M. Goeckede, M. Helbig, D. Holl, H. Iwata, H. Kobayashi, P. Kolari, E. Lopez-blanco, M.E. Marushchak, M. Mastepanov, L. Merbold, M. Peichl, O. Sonnentag, T. Sachs, M. Ueyama, C. Voigt, M. Aurela, J. Boike, G. Celis, N. Chae, T. Christensen, S. Bret-Harte, S. Dengel, H. Dolman, C. Edgar, B. Elberling, S.E. Euskirchen, A. Grelle, J. Hatakka, E.R. Humphreys, J. Jaerveoja, A. Kotani, L. Kutzbach, T. Laurila, A. Lohila, I. Mammarella, Y. Matsuura, G. Meyer, M.B. Nilsson, S.F. Oberbauer, S.J. Park, F.J.W. Parmentier, R. Petrov, A.S. Prokushkin, S. Zyrianov, C. Schulze, V.L. St.louis, E.S. Tuittila, J.P. Tuovinen, W. Quinton, A. Varlagin, D. Zona, and V.I. Zyryanov. 2021. The ABCflux Database: Arctic-Boreal CO2 Flux and Site Environmental Data, 1989-2020. ORNL DAAC, Oak Ridge, Tennessee, USA. https://doi.org/10.3334/ORNLDAAC/1934
Table of Contents
- Dataset Overview
- Data Characteristics
- Application and Derivation
- Quality Assessment
- Data Acquisition, Materials, and Methods
- Data Access
- References
Dataset Overview
This Arctic-Boreal CO2 fluxes (ABCflux) dataset contains monthly aggregates of terrestrial net ecosystem CO2 exchange and its derived partitioned component fluxes: gross primary productivity (GPP) and ecosystem respiration. Over 70 supporting variables describe key site conditions (e.g., vegetation and disturbance type), micrometeorological and environmental measurements (e.g., air and soil temperatures), and flux measurement techniques. The data contained in this ABCflux dataset form a standardized monthly database of Arctic-Boreal CO2 fluxes (i.e., ABCflux Database) and include 244 sites and 6,309 monthly observations; 136 sites and 2,217 monthly observations represent tundra, and 108 sites and 4,092 observations represent the boreal biome. The data are for the period 1989 to 2020.
Flux estimates with chamber (19% of the monthly observations), snow diffusion (3%), and eddy covariance (78%) techniques are included. The largest number of observations were collected during the climatological summer (June-August; 32%). Fewer observations were available for autumn (September-October; 25%), winter (December-February; 18%), and spring (March-May; 25%).
Project: Arctic-Boreal Vulnerability Experiment
The Arctic-Boreal Vulnerability Experiment (ABoVE) is a NASA Terrestrial Ecology Program field campaign based in Alaska and western Canada between 2016 and 2021. Research for ABoVE links field-based, process-level studies with geospatial data products derived from airborne and satellite sensors, providing a foundation for improving the analysis and modeling capabilities needed to understand and predict ecosystem responses and societal implications.
Related Publication
Virkkala, A-M., S. Natali, B.M. Rogers, J.A. Watts, K. Savage, S.J. Connon, M.E. Mauritz-Tozer, T. Schuur, D.L. Peter, C. Minions, J. Nojeim, R. Commane, C.A. Emmerton, M. Goeckede, M. Helbig, D. Holl, H. Iwata, H. Kobayashi, P. Kolari, E. Lopez-Blanco, M.E. Marushchak, M. Mastepanov, L. Merbold, M. Peichl, O. Sonnentag, T. Sachs, M. Ueyama, C. Voigt, M. Aurela, J. Boike, G. Celis, N. Chae, T. Christensen, S. Bret-Harte, S. Dengel, H. Dolman, C. Edgar, B. Elberling, S.E. Euskirchen, A. Grelle, J. Hatakka, E.R. Humphreys, J. Jaerveoja, A. Kotani, L. Kutzbach, T. Laurila, A. Lohila, I. Mammarella, Y. Matsuura, G. Meyer, M.B. Nilsson, S.F. Oberbauer, S.J. Park, F.J.W. Parmentier, R. Petrov, A.S. Prokushkin, S. Zyrianov, C. Schulze, V.L. St.louis, E.S. Tuittila, J.P. Tuovinen, W. Quinton, A. Varlagin, D. Zona, and V.I. Zyryanov. 2021. The ABC flux database: Arctic-Boreal CO2 flux observations and ancillary information aggregated to monthly time steps across terrestrial ecosystems Earth System Science Data: In review. https://doi.org/10.5194/essd-2021-233
Acknowledgments
This research was funded by the NASA Carbon Cycle Science, NASA ABoVE, and NASA Early Career Investigator (NIP) in Earth Science programs (grants NNX17AE13G, NNX15AT81A, 80NSSC18K0770 ).
Data Characteristics
Spatial Coverage: Arctic boreal sites in Alaska, Canada, Finland, Greenland, Iceland, Mongolia, Norway, Russia, and Sweden.
ABoVE Reference Locations
Domain: Core ABoVE
State/Territory: Alaska and Canada
Grid cells (5 m): Ch079v093, Ch076v096, Ch024v013, Ch093v101, Ch048v021, Ch036v033, Ch089v059, Ch165v028, Ch039v032, Ch051v020, Ch053v017, Ch050v018, Ch048v020, Ch108v096, Ch108v095, Ch107v095, Ch105v093, Ch091v102, Ch050v007, Ch050v020, Ch052v019, Ch069v067, Ch099v023, Ch211v004, Ch041v032, Ch040v032, Ch051v019, Ch043v023, Ch042v030, Ch045v023, Ch040v028, Ch041v026, Ch047v022, Ch049v020, Ch052v018, Ch046v022, Ch094v102, Ch049v007, Ch156v057, Ch133v030, Ch011v017, Ch179v042, Ch164v110, Ch147v121, Ch048v019, Ch046v008, Ch040v029, Ch042v032, Ch092v099, Ch092v100, Ch091v101, Ch095v105, Ch069v059, Ch065v034, Ch083v090, Ch070v066, Ch064v035, Ch067v050, Ch159v102, Ch034v010, Ch078v095, Ch040v038, Ch040v037, Ch038v033, Ch042v015
Spatial Resolution: Point measurements
Temporal Coverage: 1989-12-01 to 2020-09-30
Temporal Resolution: Monthly
Study Area: All latitude and longitude are given in decimal degrees
| Site | Northern Extent | Southern Extent | Eastern Extent | Western Extent |
|---|---|---|---|---|
| Arctic boreal sites | 82.82255 | 48.2167 | 161.55 | -165.62 |
Data file information
There is one data file in comma-separated value (*.csv) format included in this dataset. The data span from 1989 to 2020 and provide monthly aggregates, which are not actual raw observations. GPP and Reco are indirectly derived variables at eddy-covariance sites, and some flux and ancillary data can also be partly gap-filled. Positive values for NEE indicate net CO2 loss to the atmosphere (i.e., CO2 source) and negative numbers indicate net CO2 uptake by the ecosystem (i.e., CO2 sink). For consistency, GPP is presented as negative (uptake) values and Reco as positive.
Data File Details
Missing data are represented as -9999 or NA.
Table 1. Variables names and descriptions.
| Variable | Units/format | Description |
|---|---|---|
| id | ID given to each individual monthly entry at each site | |
| study_id | ID given to study/site entry. (PI/first author of publication)_(site name)_(tower/chamber)_(#); Eg., Schuur_EML_Tower_1. Note that there might be several chamber (or tower) Study_IDs for one site. |
|
| study_id_short | ID given to study/site entry (see details), individual chamber plots within a site not differentiated. (PI/first author of publication)_(site name)_(tower/chamber)_(#); Eg., Schuur_EML_Tower_1. |
|
| site_name | Site name as specified in data source | |
| site_reference | A more specific name used in data source | |
| country | Country of the study site | |
| latitude | decimal degrees | Latitude of study site |
| longitude | decimal degrees | Longitude of study site |
| start_date | YYYY-MM-DD | Start day of the measurement |
| end_date | YYYY-MM-DD | End day of the measurement |
| meas_year | YYYY | Year in which data were recorded |
| season | Season in which data were recorded | |
| interval_month | Measurement month | |
| start_day | Start day of the measurement | |
| end_day | End day of the measurement | |
| duration | Number of days during the measurement month | |
| biome | Biome of the study site | |
| veg_type | A detailed vegetation type for the study site | |
| veg_type_short | A more general vegetation type for the site | |
| veg_detail | Detailed vegetation description from data source/contributor | |
| permafrost | Reported presence or absence of permafrost | |
| disturbance | Last disturbance | |
| disturb_year | YYYY | Year of last disturbance |
| disturb_severity | Relative severity of disturbance | |
| soil_moisture_class | General descriptor of site moisture | |
| site_activity | Describes whether the site is currently active (i.e., measurements conducted each year) | |
| nee | g C m-2 month-1 | Net ecosystem exchange (NEE) for the entire measurement interval in g C in CO2 |
| gpp | g C m-2 month-1 | Gross primary productivity (GPP) for the entire measurement interval in g C in CO2. Note: GPP is presented as negative (uptake) values. |
| reco | g C m-2 month-1 | Ecosystem respiration (Reco)for the entire measurement interval in g C in CO2 |
| ground_nee | g C m-2 month-1 | Forest floor net ecosystem exchange, measured with chambers for the entire measurement interval in g C in CO2 |
| ground_gpp | g C m-2 month-1 | Forest floor ecosystem respiration, measured with chambers for the entire measurement interval in g C in CO2. Note: GPP is presented as negative (uptake) values. |
| ground_reco | g C m-2 month-1 | Forest floor gross primary productivity measured with chambers for the entire measurement interval in g C in CO2 |
| rsoil | g C m-2 month-1 | Soil respiration measured with for the entire measurement interval in g C in CO2 |
| flux_method | How flux values were measured | |
| flux_method_detail | Details related to how flux values were measured: closed- and open-path eddy covariance, mostly manual chamber measurements, mostly automated chamber measurements, a combination of chamber and cuvette measurements, diffusion measurements through the snowpack, chamber measurements on top of snow | |
| measurement_frequency | Frequency of flux measurements. >100 characterizes high-frequency eddy covariance (and automated chamber) measurements. This is the primary variable that characterizes the frequency and gaps in monthly fluxes estimated with chambers and diffusion techniques. | |
| diurnal_coverage | Times of day covered by flux measurements | |
| spatial_reps_chamber | Number of spatial replicates for the chamber plot | |
| partition_method | Method used to partition NEE into GPP and RECO | |
| gap_fill | Gap filling method | |
| gap_fill_perc | percent | % of nee data that was gap-filled in the measurement interval (relative to standard measurement time step) |
| tower_qa_qc_nee_flag | 1 | Overall monthly quality flag for eddy covariance aggregated observations; fraction between 0-1, indicating percentage of measured (quality flag QC = 0 in FLUXNET2015) and good-quality gap-filled data (quality flag QC = 1 in FLUXNET2015); average from daily data; 0=extensive gap-filling, 1=low gap-filling. |
| tower_qa_qc_source | The source for the overall quality information for the eddy covariance observations | |
| method_error_nee | g m-2 | Rmse or other bootstrapped error of model fit for nee or the entire measurement interval, in g C in CO2 |
| method_error_technique | Technique used to quantify method errors for flux measurements | |
| high_freq_availability | Availability of high-frequency data | |
| aggregation_method | Method used to aggregate data to measurement interval | |
| instrumentation | Description of instrumentation used | |
| tower_version | Version number of the eddy covariance dataset from the extraction source | |
| tower_data_restriction | Tower data restrictions: No, CC by 4.0, Tier 1, or Tier 2 | |
| tower_corrections | Details related to processing corrections employed, including time, duration, and thresholds for u* and heat corrections | |
| spatial_variation_technique | Spatial techniques used by researchers, for example, growing seasons, subhabitats, etc. | |
| light_response_method_chamber | Details related to how the varying light response conditions were considered in chamber measurements | |
| par_cutoff | umol par m-2 second-1 | Photosynthetically active radiation (PAR) level used to define night-time data and apply partitioning method |
| precip_int | mm | Mean precipitation during measurement interval |
| tair_int | degrees C | Mean air temperature during measurement interval |
| tsoil | degrees C | Mean soil temperature during measurement interval |
| soil_moisture | percent | Mean soil moisture during the measurement interval (% by volume) |
| thaw_depth | cm | Mean thaw depth during the measurement interval |
| tsoil_depth | cm | Depth of soil temperature measurement below surface |
| moisture_depth | cm | Depth of soil moisture measurement below surface |
| alt | cm | Active layer thickness (cm; maximum thaw depth), will change annually |
| water_table_depth | cm | Mean water table depth during the measurement interval (cm); positive is below the surface, negative is above (inundated) |
| snow_depth | cm | Mean snow depth during the measurement interval |
| vapor_pressure_deficit | pa | Mean vapor pressure deficit during the measurement interval |
| evapotranspiration | mm | Total evapotranspiration during the measurement interval |
| par | w m-2 | Mean photosynthetically active radiation (PAR) during measurement interval |
| par_ppfd | µmol m2 s | Mean photosynthetically active radiation during measurement interval (measured in photosynthetic photon flux density, ppfd; micromol m-2 s-1) |
| precip_annual | mm | Mean annual precipitation from site or nearby weather station as a general site descriptor. This should describe the longer-term climate for the site rather than a few years of study |
| tair_annual | degrees C | Mean annual air temperature from site or nearby weather station as a general site descriptor. This value describes the longer-term climate for the site rather than a few years of study. |
| t_precip_source_yrs | Data source and years used to calculate mean annual temperature/precipitation | |
| elevation | m | Elevation above sea level |
| lai | Leaf area index | |
| sol_depth | cm | Soil organic layer depth |
| soil_perc_carbon | percent | Soil carbon percentage |
| perc_c_depth | cm | Depth at which soil carbon % was measured |
| c_density | kg m-2 | Soil carbon per unit area |
| c_density_depth | cm | Depth to which soil organic carbon per unit area was estimated (cm) |
| agb | kg m-2 | Above ground biomass in kg carbon |
| agb_type | Types of above ground vegetation included in the agb measurement | |
| soil_type | General soil type, including source (e.g., USDA, CSSC, NCSCD) | |
| soil_type_detail | Detailed soil type description, if available | |
| other_data | Other types of data from the data source that may be relevant | |
| notes_site_info | Any other relevant information | |
| notes_time_variant | Any other relevant information | |
| citation | Journal article, data citation, and/or other source (online repository, pi submitted, etc.). | |
| citation_data_overlap | Another citation for the site | |
| data_contributor_or_author | Data contributor(s) or primary author(s) associated with data set or publication | |
| Primary author email | ||
| orcid | Personal digital identifier: https://orcid.org/ | |
| data_availability | Current availability of data: data available in a published paper, in an open online data repository, in an already published synthesis, or user contributed | |
| data_maturity | Current maturity of data | |
| extraction_source | Data source | |
| dataentry_person | The person(s) who added the data to the database |
Application and Derivation
ABCflux can be used in a wide array of empirical, remote sensing, and modeling studies to improve understanding of the regional and temporal variability in CO2 fluxes, and to better estimate the terrestrial Arctic Boreal Zone CO2 budget (Virkkala et al., 2021).
Quality Assessment
The data were screened for poor-quality, potential unit and sign convention issues, and inaccurate coordinates. Source data downloaded from different repositories were processed and quality checked using quality flags associated with monthly data supplied by the repository processing pipeline (Virkkala et al., 2021). Note that GPP is sometimes positive because the gap-filling and partitioning approach is based on a model which does not always predict periods with 0 GPP correctly.
Data Acquisition, Materials, and Methods
The ABCflux database is a standardized monthly database of compiled in-situ measured terrestrial ecosystem-level CO2 fluxes from sites in the Arctic Boreal Zone (ABZ) aggregated to monthly time periods (g C m-2 month-1). The database includes 94 variables: 16 are flux measurements and associated metadata (e.g., NEE, measurement date, and duration), 21 describe flux measurement methods (e.g., measurement frequency, gap-filling method), 49 describe site conditions (e.g., soil moisture, air temperature, vegetation type), and 8 describe the extraction source (e.g., primary author or site PI, citation, data maturity). Sixty-one variables are considered static and thus do not vary with repeated measurements at a site (e.g., site name, coordinates, vegetation type), while 33 variables are considered dynamic and vary monthly (e.g., soil temperature). There are 244 sites and 6,309 monthly observations; 136 sites and 2,217 monthly observations represent tundra, and 108 sites and 4092 observations represent the boreal biome. Flux estimates with chamber (19% of the monthly observations), snow diffusion (3%), and eddy covariance (78%) techniques are included. The largest number of observations were collected during the climatological summer (June-August; 32%), and fewer observations were available for autumn (September-October; 25%), winter (December-February; 18%), and spring (March-May; 25 %).
Data sources
Potential CO2 flux studies and sites from prior synthesis efforts were identified (Belshe et al., 2013; McGuire et al., 2012; Virkkala et al., 2018; Natali et al., 2019; Virkkala et al., 2021), including a search of citations within and of the studies included in these prior syntheses. A literature search was also conducted to ensure that the database included the most recent publications. Studies were included that reported at least NEE, presented at a monthly or finer temporal resolution, and had supporting data describing the sites. Eddy covariance and supporting environmental data products were downloaded from AmeriFlux (Novick et al., 2018), Fluxnet2015 (Pastorello et al., 2020), EuroFlux database cluster (ICOS, Carbon Extreme, Carbo Africa, GHG Europe, Carbo Italy, INGOS) (Paris et al., 2012; Valentini, 2003), and the Station for Measuring Ecosystem-Atmosphere Relations (Hari et al., 2013).
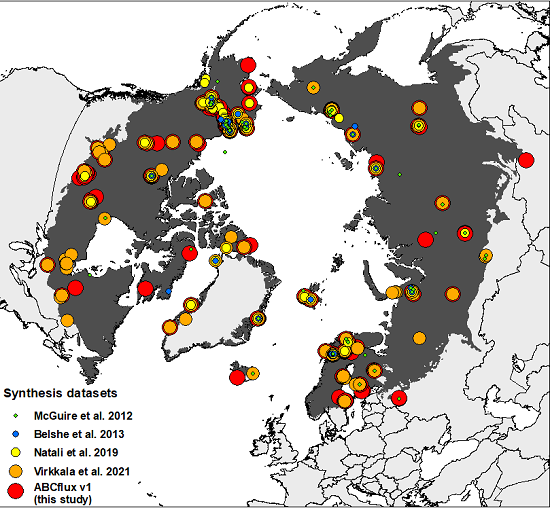
Figure 2. The flux site distribution in syntheses focused on compiling fluxes from high latitudes (McGuire et al. 2012, Belshe et al. 2013, Natali et al. 2019, Virkkala et al. 2021 and this study (ABCflux)). The Arctic-Boreal Zone is highlighted in dark grey; countries are shown in the background. Based on the unique latitude-longitude coordinate combinations in the tundra, there were 136 tundra sites in ABCflux, 104 tundra sites in Virkkala et al. 2021, 68 tundra sites in Natali et al., 2019, 34 tundra sites in Belshe et al. 2013, and 66 tundra sites in McGuire et al., 2012. Observations that were included in previous studies but not in ABCflux represent fluxes aggregated over seasonal, not monthly periods.
The data were summed to monthly time steps. Although the three flux measurement techniques primarily measure net ecosystem exchange (NEE), chamber and eddy covariance techniques can also be used to estimate GPP (the photosynthetic flux) and Reco (comprising emissions from autotrophic and heterotrophic respiration), which are also included in the database. Source GPP, Reco, or NEE datasets that were not gap filled were not aggregated. Flux measurement techniques were recorded (e.g., measurement frequency, instrumentation, gap filling, and partitioning method, number of spatial replicates for chamber measurements, flux data quality), wherever possible.
Additional Data
A community call was solicited in 2018 through a CO2 flux synthesis workshop (Parmentier et al., 2019, Reconciling historical and contemporary trends in terrestrial carbon exchange of the northern permafrost-zone, 2021), whereby the network of Arctic Boreal Zone flux researchers were contacted and invited to contribute their most current unpublished data. This call resulted in an additional 39 sites and 1,372 monthly observations (see variable extraction_source).
Refer to Virkkala et al. (2021) for additional information.
Data Access
These data are available through the Oak Ridge National Laboratory (ORNL) Distributed Active Archive Center (DAAC).
The ABCflux Database: Arctic-Boreal CO2 Flux and Site Environmental Data, 1989-2020
Contact for Data Center Access Information:
- E-mail: uso@daac.ornl.gov
- Telephone: +1 (865) 241-3952
References
Belshe, E.F., E.A. G. Schuur, and B.M. Bolker. 2013. Tundra ecosystems observed to be CO2 sources due to differential amplification of the carbon cycle. Ecology Letters 16:1307–1315. https://doi.org/10.1111/ele.12164
Hari, P., E. Nikinmaa, T. Pohja, E. Siivola, J. Bäck, T. Vesala, and M. Kulmala. 2012. Station for measuring ecosystem-atmosphere relations: SMEAR. Physical and Physiological Forest Ecology:471–487. https://doi.org/10.1007/978-94-007-5603-8_9
Keenan, T.F., and C.A. Williams. 2018. The terrestrial carbon sink. Annual Review of Environment and Resources 43:219–243. https://doi.org/10.1146/annurev-environ-102017-030204
McGuire, A.D., T.R. Christensen, D. Hayes, A. Heroult, E. Euskirchen, J.S. Kimball, C. Koven, P. Lafleur, P.A. Miller, W. Oechel, P. Peylin, M. Williams, and Y. Yi. 2012. An assessment of the carbon balance of Arctic tundra: comparisons among observations, process models, and atmospheric inversions. Biogeosciences 9:3185–3204. https://doi.org/10.5194/bg-9-3185-2012
Natali, S.M., J.D. Watts, B.M. Rogers, S. Potter, S.M. Ludwig, A.-K. Selbmann, P.F. Sullivan, B.W. Abbott, K.A. Arndt, L. Birch, M.P. Björkman, A.A. Bloom, G. Celis, T.R. Christensen, C.T. Christiansen, R. Commane, E.J. Cooper, P. Crill, C. Czimczik, S. Davydov, J. Du, J.E. Egan, B. Elberling, E.S. Euskirchen, T. Friborg, H. Genet, M. Göckede, J.P. Goodrich, P. Grogan, M. Helbig, E.E. Jafarov, J.D. Jastrow, A.A.M. Kalhori, Y. Kim, J. S. Kimball, L. Kutzbach, M.J. Lara, K.S. Larsen, B.-Y. Lee, Z. Liu, M. M. Loranty, M. Lund, M. Lupascu, N. Madani, A. Malhotra, R. Matamala, J. McFarland, A.D. McGuire, A. Michelsen, C. Minions, W.C. Oechel, D. Olefeldt, F.-J.W. Parmentier, N. Pirk, B. Poulter, W. Quinton, F. Rezanezhad, D. Risk, T. Sachs, K. Schaefer, N.M. Schmidt, E.A.G. Schuur, P.R. Semenchuk, G. Shaver, O. Sonnentag, G. Starr, C.C. Treat, M.P. Waldrop, Y. Wang, J. Welker, C. Wille, X. Xu, Z. Zhang, Q. Zhuang, and D. Zona. 2019. Large loss of CO2 in winter observed across the northern permafrost region. Nature Climate Change 9:852–857. https://doi.org/10.1038/s41558-019-0592-8
Novick, K.A., J.A. Biederman, A.R. Desai, M.E. Litvak, D.J. P. Moore, R.L. Scott, and M.S. Torn. 2018. The AmeriFlux network: A coalition of the willing. Agricultural and Forest Meteorology 249:444–456. https://doi.org/10.1016/j.agrformet.2017.10.009
Paris, J.-D., P. Ciais, L. Rivier, F. Chevallier, H. Dolman, J.-M. Flaud, C. Garrec, C. Gerbig, J. Grace, E. Huertas, T. Johannessen, A. Jordan, I. Levin, D. Papale, R. Valentini, A. Watson, T. Vesala, and ICOS-PP Consortium. 2012. Integrated Carbon Observation. Geophysical Research Abstracts 14:EGU2012-12397, EGU General Assembly. https://www.icos-cp.eu
Parmentier, F.-J., O. Sonnentag, M. Mauritz, A.-M. Virkkala, and E. Schuur. 2019. Is the Northern Permafrost Zone a source or a sink for Carbon? Eos 100. https://doi.org/10.1029/2019eo130507
Pastorello, G., C. Trotta, E. Canfora, H. Chu, D. Christianson, Y.-W. Cheah, C. Poindexter, J. Chen, A. Elbashandy, M. Humphrey, P. Isaac, D. Polidori, A. Ribeca, A. van Ingen, L. Zhang, B. Amiro, C. Ammann, M.A. Arain, J. Ardö, T. Arkebauer, S.K. Arndt, N. Arriga, M. Aubinet, M. Aurela, D. Baldocchi, A. Barr, E. Beamesderfer, L.B. Marchesini, O.J. Bergeron, C. Beringer, D. Bernhofer, D. Berveiller, T.A. Billesbach, P.D. Black, G. Blanken, J. Bohrer, P.V. Boike, D. Bolstad, Y.-W. Bonal, C. Bonnefond, D.R. Bowling, R. Bracho, J. Brodeur, C. Brümmer, N. Buchmann, B. Burban, S.P. Burns, P. Buysse, P. Cale, M. Cavagna, P. Cellier, S. Chen, I. Chini, T.R. Christensen, J. Cleverly, A. Collalti, C. Consalvo, B. Cook, D. Cook, C. Coursolle, E. Cremonese, P.S. Curtis, E. D’Andrea, H. da Rocha, X. Dai, K. Davis, J.B. De Cinti, A. de Grandcourt, A. De Ligne, R.C. De Oliveira, N. Delpierre, A.R. Desai, C.M. Di Bella, P. di Tommasi, H. Dolman, F. Domingo, G. Dong, S. Dore, P. Duce, E. Dufrêne, A. Dunn, J. Dušek, D. Eamus, U. Eichelmann, H.A.M. ElKhidir, W. Eugster, C.M. Ewenz, B. Ewers, D. Famulari, S, Fares, I. Feigenwinter, A. Feitz, R. Fensholt, G. Filippa, M. Fischer, J. Frank, M. Galvagno, M. Gharun, D. Gianelle, et al. 2020. The FLUXNET2015 dataset and the ONEFlux processing pipeline for eddy covariance data. Scientific Data 7:225. https://doi.org/10.1038/s41597-020-0534-3
Valentini, R. 2003. EUROFLUX: an integrated network for studying the long-term responses of biospheric exchanges of carbon, water, and energy of European forests. Ecological Studies:1–8. https://doi.org/10.1007/978-3-662-05171-9_1
Virkkala, A-M., S. Natali, B.M. Rogers, J.A. Watts, K. Savage, S.J. Connon, M.E. Mauritz-Tozer, T. Schuur, D.L. Peter, C. Minions, J. Nojeim, R. Commane, C.A. Emmerton, M. Goeckede, M. Helbig, D. Holl, H. Iwata, H. Kobayashi, P. Kolari, E. Lopez-Blanco, M.E. Marushchak, M. Mastepanov, L. Merbold, M. Peichl, O. Sonnentag, T. Sachs, M. Ueyama, C. Voigt, M. Aurela, J. Boike, G. Celis, N. Chae, T. Christensen, S. Bret-Harte, S. Dengel, H. Dolman, C. Edgar, B. Elberling, S.E. Euskirchen, A. Grelle, J. Hatakka, E.R. Humphreys, J. Jaerveoja, A. Kotani, L. Kutzbach, T. Laurila, A. Lohila, I. Mammarella, Y. Matsuura, G. Meyer, M.B. Nilsson, S.F. Oberbauer, S.J. Park, F.J.W. Parmentier, R. Petrov, A.S. Prokushkin, S. Zyrianov, C. Schulze, V.L. St.louis, E.S. Tuittila, J.P. Tuovinen, W. Quinton, A. Varlagin, D. Zona, and V.I. Zyryanov. The ABC flux database: Arctic-Boreal CO2 flux observations and ancillary information aggregated to monthly time steps across terrestrial ecosystems (2021, In review). https://doi.org/10.5194/essd-2021-233
Virkkala, A., J. Aalto, B.M. Rogers, T. Tagesson, C.C. Treat, S.M. Natali, J.D. Watts, S. Potter, A. Lehtonen, M. Mauritz, E.A. G. Schuur, J. Kochendorfer, D. Zona, W. Oechel, H. Kobayashi, E. Humphreys, M. Goeckede, H. Iwata, P.M. Lafleur, E.S. Euskirchen, S. Bokhorst, M. Marushchak, P.J. Martikainen, B. Elberling, C. Voigt, C. Biasi, O. Sonnentag, F.W. Parmentier, M. Ueyama, G. Celis, V.L. St.Louis, C.A. Emmerton, M. Peichl, J. Chi, J. Järveoja, M.B. Nilsson, S.F. Oberbauer, M.S. Torn, S. Park, H. Dolman, I. Mammarella, N. Chae, R. Poyatos, E. López-Blanco, T.R. Christensen, M.J. Kwon, T. Sachs, D. Holl, and M. Luoto. 2021. Statistical upscaling of ecosystem CO2 fluxes across the terrestrial tundra and boreal domain: Regional patterns and uncertainties. Global Change Biology 27:4040–4059. https://doi.org/10.1111/gcb.15659
Virkkala, A.-M., T. Virtanen, A. Lehtonen, J. Rinne, and M. Luoto. 2018. The current state of CO2 flux chamber studies in the Arctic tundra. Progress in Physical Geography: Earth and Environment 42:162–184. https://doi.org/10.1177/0309133317745784