Documentation Revision Date: 2022-10-12
Dataset Version: 1
Summary
There are five data files in comma-separated (.csv) format with this dataset.
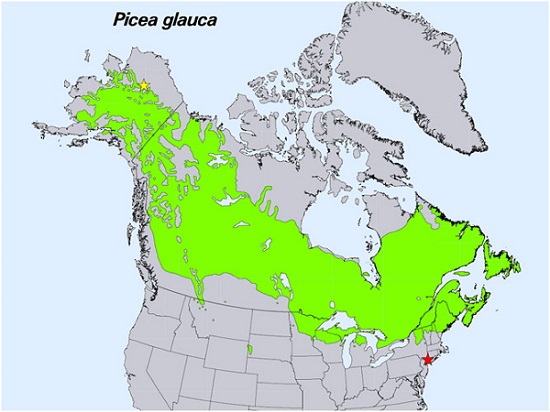
Figure 1. Species distribution for white spruce, Picea glauca. The southern range limit site, Black Rock Forest, Cornwall, NY, is marked with the red star. The arctic treeline site in northern Alaska is marked with a yellow star. Map from USGS from Thompson et al. (1999), in Griffin et al. (2022).
Citation
Griffin, K., S.C. Schmiege, S.G. Bruner, N. Boelman, L. Vierling, J. Eitel, and Z.M. Griffin. 2022. Spruce Leaf, Tree Traits, and Respiration at Range Extremes, AK and NY, USA, 2018. ORNL DAAC, Oak Ridge, Tennessee, USA. https://doi.org/10.3334/ORNLDAAC/1948
Table of Contents
- Dataset Overview
- Data Characteristics
- Application and Derivation
- Quality Assessment
- Data Acquisition, Materials, and Methods
- Data Access
- References
Dataset Overview
This dataset provides in situ measurements of needle-level gas-exchange and leaf traits from Picea glauca (white spruce) from a field site located in the northern latitudinal forest-tundra ecotone (FTE) near the Dalton Highway in northern Alaska, and from one study site located in Black Rock Forest, New York, USA. Measurements were collected with an open flow portable photosynthesis system (Li6400XT) and custom-built temperature-controlled cuvette. Respiration as a function of leaf temperature was measured continuously as the needle temperature was ramped from approximately 5 to 65 degrees C, at a constant rate of 1 degree C per minute. Additional data include tree diameter at breast height (dbh), leaf area, photosynthetic rate, intercellular C02, conductance to H20, tree height, and data from raw temperature curves. Results are reported on both a leaf area and leaf mass basis. The data are for the period 2018-06-06 to 2018-06-23 .
Project: Arctic-Boreal Vulnerability Experiment
The Arctic-Boreal Vulnerability Experiment (ABoVE) is a NASA Terrestrial Ecology Program field campaign being conducted in Alaska and western Canada, for 8 to 10 years, starting in 2015. Research for ABoVE links field-based, process-level studies with geospatial data products derived from airborne and satellite sensors, providing a foundation for improving the analysis, and modeling capabilities needed to understand and predict ecosystem responses to, and societal implications of, climate change in the Arctic and Boreal regions.
Related Publications
Griffin, K.L., Z.M. Griffin, S.C. Schmiege, S.G. Bruner, N.T. Boelman, L.A. Vierling, and J.U.H. Eitel. 2022. Variation in White spruce needle respiration at the species range limits: a potential impediment to Northern expansion. Plant, Cell & Environment 45:2078-2092. https://doi.org/10.1111/pce.14333
Griffin, K.L., S.C. Schmiege, S.G. Bruner, N.T. Boelman, L.A. Vierling, and J.U.H. Eitel. 2021. High leaf respiration rates may limit the success of white spruce saplings growing in the Kampfzone at the Arctic Treeline. Frontiers of Plant Science 12:746464. https://doi.org/10.3389/fpls.2021.746464
Related Datasets
Eitel, J., A.J. Maguire, K. Griffin, N. Boelman, J.E. Jensen, S.C. Schmiege, and L. Vierling. 2020. ABoVE: Photochemical Reflectance and Tree Growth, Brooks Range, Alaska, 2018-2019. ORNL DAAC, Oak Ridge, Tennessee, USA. https://doi.org/10.3334/ORNLDAAC/1781
Maguire, A.J., J. Eitel, L. Vierling, N. Boelman, K. Griffin, J.S. Jennewein, and J.E. Jensen. 2020. ABoVE: Terrestrial Lidar Scanning Forest-Tundra Ecotone, Brooks Range, Alaska, 2016. ORNL DAAC, Oak Ridge, Tennessee, USA. https://doi.org/10.3334/ORNLDAAC/1782
Maguire, A.J., J. Eitel, K. Griffin, S.C. Schmiege, S.G. Bruner, N. Boelman, and W. Weygint. 2020. ABoVE: Needle-Level Chlorophyll Fluorescence, Alaska and Idaho, USA, 2017 and 2019. ORNL DAAC, Oak Ridge, Tennessee, USA. https://doi.org/10.3334/ORNLDAAC/1785
Acknowledgment
This work was supported by NASA ABoVE grant NNX15AT86A and generally by the Arctic LTER (NSF Grant No. 1637459).
Data Characteristics
Spatial Coverage: northern Alaska and Black Rock Forest, New York, USA
ABoVE gridding system:
- Domain: Core
- Grid cells: Ah001v000, Bh007v003, Ch045v022, Ch045v023, Ch046v022, Ch046v023
Spatial Resolution: Point
Temporal Coverage: 2018-06-06 to 2018-06-23
Temporal Resolution: Gas exchange variables and rates were recorded every 20 seconds; other measurements were one-time measurements
Study Area: Latitude and longitude are given in decimal degrees.
| Sites | Westernmost Longitude | Easternmost Longitude | Northernmost Latitude | Southernmost Latitude |
|---|---|---|---|---|
| Alaska, near the Dalton Highway | -149.9551 | -149.6063 | 67.8889 | 67.6488 |
| Black Rock Forest, New York | -74.0246 | -74.0246 | 41.4011 | 41.4011 |
Data File Information
There are five data files in comma-separated (.csv) format with this dataset. The files provide respiration measurements, leaf traits, and tree traits from the Northern and Southern Spruce range extremes.
Table 1. File names and descriptions
| File Name | Description |
|---|---|
| AK_Tundra_Spruce_Raw_RespTemp_Curves.csv | Output of the raw LI-6400xt respiration temperature curves for Alaska site. |
| AK_Tundra_Spruce_Analysis_RespTemp.csv | Results of the data analysis from the raw temperature curves for Alaska site. A simple polynomial model described by Heskel et al (2016) was used to describe the relationship between temperature and respiration. |
| BlackRockForest_RespTemp_Results.csv | White spruce respiratory traits for Black Rock Forest, New York, from Griffin et al. (2022). |
| BlackRockForest_RespTemp_curves_Raw.csv | Raw LI-6400xt respiration temperature curves for Black Rock Forest, New York. |
| Leaf_Traits_AK_BlackRockForest.csv | Leaf trait results for Alaska and New York white spruce from Griffin et al. (2022). |
Table 2. Variables in the file AK_Tundra_Spruce_Raw_RespTemp_Curves.csv
| Variable | Units | Description |
|---|---|---|
| plot | Plot number: 1-6 | |
| latitude_north | degrees north | Northernmost latitude of study site |
| latitude_south | degrees north | Southernmost latitude of study site |
| longitude_east | degrees east | Easternmost longitude of study site |
| longitude_west | degrees east | Westernmost longitude of study site |
| tree | Tree identifier at each Plot: a-f | |
| photo_rate | micromol m-2 s-1 | Photosynthetic rate |
| conductance_h2o | mol m-2 s-1 | Conductance to H2O |
| intercellular_co2 | micromol m-2 s-1 | Intercellular CO2 exchange |
| transpiration_rte | mmol m-2 s-1 | Transpiration rate |
| leaf_area | cm2 | Leaf area of the sample |
| leaf_thermocouple_temp | Degrees C | Temperature of the leaf thermocouple |
| co2_reference | micromol mol-1 | Reference CO2 concentration |
| co2_sample | micromol mol-1 | Sample CO2 concentration |
| h20_reference | mmol mol-1 | Reference H2O concentration |
| h20_sample | mmol mol-1 | Sample H2O concentration |
| flow_rate | micromol s-1 | Flow rate to the chamber |
| date | YYYY-MM-DD | The date the curve was measured |
| species | Picea glauca (pigl) | |
| replication_number | 1 | Replication number in case any curves were remeasured |
| canopy_position | Canopy position: "low" or "high" | |
| leaf_fresh_mass | g | Leaf sample wet mass |
| leaf_dry_mass | g | Leaf sample dry mass |
| sample | Unique name of each curve/sample (concatenated Plot, Tree, Rep, Canopy) | |
| site | Alaska: AK | |
| dbh | cm | Diameter at breast height of measured trees |
| height | m | Height of measured trees |
| size_class | Size class of trees: "large" or "small." Small trees (or saplings) are defined as 5-10 cm DBH, Large trees are >10 cm DBH | |
| resp_area | micromol m-2 s-1 | Area-based respiration rate |
| resp_mass | micromol g-1 s-1 | Mass-based respiration rate |
Table 3. Variables in the file AK_Tundra_Spruce_Analysis_RespTemp.csv
| Variable | Units | Description |
|---|---|---|
| plot | Plot number: 1-6 | |
| date | YYYY-MM-DD | The date the curve was measured |
| latitude_north | degrees north | Northernmost latitude of study site |
| latitude_south | degrees north | Southernmost latitude of study site |
| longitude_east | degrees east | Easternmost longitude of study site |
| longitude_west | degrees east | Westernmost longitude of study site |
| tree | Tree identifier at each Plot: a-f | |
| canopy | Canopy position: "low" or "high" | |
| sample | Unique name of each curve/sample (concatenated Plot, Tree, Rep, Canopy) | |
| a_area | 1 | a polynomial coefficient, area-based respiration temperature curve |
| b_area | 1 | b polynomial coefficient, area-based respiration temperature curve |
| c_area | 1 | c polynomial coefficient, area-based respiration temperature curve |
| a_mass | 1 | a polynomial coefficient, mass-based respiration temperature curve |
| b_mass | 1 | b polynomial coefficient, mass-based respiration temperature curve |
| c_mass | 1 | c polynomial coefficient, mass-based respiration temperature curve |
| max_temp_resp_area | micromol m-2 s-1 | Respiration at the maximum temperature of the respiration temperature curve |
| max_temp_rt_curve | C | Maximum temperature of the RT curve (degrees Celsius) |
| resp_25c_area | micromol m-2 s-1 | Respiration at 25° C on an area basis |
| resp_25c_mass | micromol m-2 s-1 | Respiration at 25° C on an mass basis |
| replication_number | 1 | Replication number in case any curves were remeasured |
| leaf_area | cm2 | Leaf area of the sample |
| leaf_fresh_mass | g | Leaf sample wet mass |
| leaf_dry_mass | g | Leaf sample dry mass |
| site | Alaska: AK | |
| dbh | cm | Diameter at breast height (DBH) of measured trees (cm) |
| height | m | Height of measured trees (m) |
| size_class | Size class of trees: large or small. Small trees (or saplings) are defined as 5-10 cm DBH, Large trees are >10 cm DBH | |
| sla | cm2 g-1 | Specific leaf area of each sample |
| leaf_dry_matter | g g-1 | Leaf dry matter content |
Table 4. Variables in the file BlackRockForest_RespTemp_Results.csv
| Variable | Units | Description |
|---|---|---|
| site | BRF (Black Rock Forest, NY) | |
| plot | Plot number: 1 | |
| tree | Tree identifier at each plot, 1-6 | |
| canopy | Canopy position: "low" or "high" | |
| sample | Unique name of each curve/sample (concatenated Site, “Spruce”, Tree, Canopy) | |
| a_area | 1 | a polynomial coefficient, area-based respiration temperature curve |
| b_area | 1 | b polynomial coefficient, area-based respiration temperature curve |
| c_area | 1 | c polynomial coefficient, area-based respiration temperature curve |
| max_r_area | micromol m-2 s-1 | Respiration at the maximum temperature of the respiration temperature curve |
| max_temp | C | Maximum temperature of the RT curve in degrees Celsius |
| r25_area | micromol m-2 s-1 | Respiration at 25° C on an area basis |
| species | Picea glauca (pigl) | |
| rep | 1 | Replication number in case any curves were remeasured |
| size_class | Size class of trees- large (DBH > 10cm) | |
| dbh | cm | Diameter at breast height (DBH) of measured trees (cm) |
| height | m | Height of measured trees (m) |
| leaf_area | cm2 | Leaf area of the sample |
| leaf_fresh_mass | g | Leaf sample wet mass |
| Leaf_dry_mass | g | Leaf sample dry mass |
| leaf_dry_matter | mg g-1 | Leaf dry matter content (mg dry mass for each gram of fresh mass) |
| sla | cm2 g-1 | Specific leaf area of each sample |
Table 5. Variables in the file BlackRockForest_RespTemp_Curves_Raw.csv
| Variable | Units | Description |
|---|---|---|
| site | BRF (Black Rock Forest, New York) | |
| plot | Plot number- 1 | |
| tree | Tree identifier at each plot, 1-6 | |
| photosynthetic_rate | micromol m-2 s-1 | Photosynthetic rate |
| conductance | mol m-2 s-1 | Conductance to H2O |
| intercellular_co2 | micromol mol-1 | Intercellular CO2 |
| transpiration_rate | mmol m-2 s-1 | Transpiration rate |
| leaf_area | cm^2 | Leaf area of the sample |
| t_leaf | Degrees C | Temperature of the leaf thermocouple |
| co2_reference | micromol mol-1 | Reference CO2 concentration |
| co2_sample | micromol mol-1 | Sample CO2 concentration |
| h2o_reference | mmol mol-1 | Reference H2O concentration |
| h2o_sample | mmol mol-1 | Sample H2O concentration |
| flow | micromol s-1 | Flow rate to the chamber |
| canopy | Canopy position: "low" or "high" | |
| leaf_fresh_mass | g | Leaf sample wet mass |
| leaf_dry_mass | g | Leaf sample dry mass |
| sample | Unique name of each curve/sample (concatenated Site, “Spruce”, Tree, Canopy) | |
| r_area | micromol m-2 s-1 | Area-based respiration rate |
| date | YYYY-MM-DD | The date the curve was measured |
| species | Picea glauca (pigl) | |
| rep | Replication number in case any curves were remeasured | |
| size_class | Size class of trees, large (DBH >10cm) | |
| dbh | cm | Diameter at breast height (DBH) of measured trees |
| height | m | Height of measured trees |
| size_class | Size class of trees, large (DBH >10cm) |
Table 6. Variables in the file Leaf_Traits_AK_BlackRockForest.csv
| Variable | Units | Description |
|---|---|---|
| sample | Unique name of each curve/sample (for AK concatenated Plot, Tree, Rep, Canopy; for BRF-concatenated Site, “Spruce”, Tree, Canopy) | |
| site | Alaska or BRF (Black Rock Forest, New York) | |
| plot | Plot number- for AK- 1-6; for BRF- 1 | |
| tree | Tree identifier at each Plot- 1-6 | |
| canopy | Canopy position- low or high | |
| carbon | percent | Foliar percent carbon |
| nitrogen | percent | Foliar percent nitrogen |
| ratio_carbon_nitrogen | ratio | Ratio of carbon to nitrogen |
| delta13C | C isotope ratio ml-1 | Foliar carbon isotope ratio (per ml) |
| delta15N | Nitrogen isotope ratio ml-1 | Foliar nitrogen isotope ratio (per mil) |
| leaf_fresh_mass | g | Leaf sample wet mass |
| leaf_dry_mass | g | Leaf sample dry mass |
| leaf_dry_matter | mg g-1 | Leaf dry matter content (mg dry mass for each gram of fresh mass) |
| percent_water | percent | Foliar percent water |
| sla | cm2 g-1 | Specific leaf area of each sample |
| leaf_area | cm2 | Leaf area of the sample |
| nitrogen_per_leaf_area | mg m-2 | Foliar nitrogen per leaf area (mg N per m2) |
| resp_25c_mass | micromol g-1 s-1 | Mass-based respiration at 25C |
| rep | Replication number in case any curves were remeasured | |
| species | Picea glauca (pigl) |
Application and Derivation
Arctic Treeline is the transition from the boreal forest to the treeless tundra and may be determined by growing season temperatures. The environmental and physiological mechanisms that determine the location of treeline are not fully understood. This study demonstrates that the respiratory characteristics of white spruce saplings at treeline impose a significant carbon cost that may contribute to their lack of perseverance beyond treeline. In the absence of thermal acclimation, the rate of leaf respiration could increase by 57% by the end of the century, posing further challenges to the ecology of this massive ecotone.
Quality Assessment
Raw data are analyzed for stability during the gas exchange measurements. Typical measures of statistical confidence are used throughout.
Data Acquisition, Materials, and Methods
Methods are the same for both sites unless stated otherwise. Refer to Griffin et al. (2021, 2022) for additional details.
Study Sites and Sampling
Leaf samples were collected from two locations at the northern and southern range extremes of the White Spruce (Picea glauca) distribution. During June and July 2018, samples were collected from six field sites located in northern Alaska on the southern side of the Brooks Range along a 5.5 km stretch of the Dalton Highway, and in June 2018 at the southern range extreme, from a single site located in Black Rock Forest, New York, USA, along Continental Road. Samples were collected from branches of upper and lower canopy adult White Spruce trees.
At each site of the six sites in Alaska, a circular plot with 10-m radius (314 m2 area) was established, and six white spruce trees from two different size classes were tagged. The size classes were chosen to differentiate “trees” (≥ 10 cm DBH) from “saplings” (<10 cm DBH). Leaves were sampled from the lower canopy and the upper canopy on each of the 36 target trees, made up of 18 saplings and 18 trees, for gas exchange analysis. Leaves were sampled from one site in Black Rock Forest, New York from trees ≥ 10 cm DBH (Griffin et al., 2022). The terminal portions of several branches were cut with sharp pruners (bottom of the canopy) or a pole clipper (top of the canopy), and the removed portion of the stem was immediately wrapped with wet paper towels, sealed in a plastic bag with ample air and placed in a cooler where they were kept in the dark until arriving in the lab. The location of the lower samples was approximately 1.37 m above the ground and were collected from the south side of the canopy. The location of upper samples was approximately 1 m from the terminal apex of each tree and were collected from the south side of the canopy. Once returned to the lab, the stems were recut underwater and placed in a beaker containing enough water to keep the cut end submerged until analyzed, typically within 8, but no more than 24 hours.
Respiration Temperature Response Curves
To assess average respiration rates, CO2 exchange rates were measured at a common temperature (25°C, R25) and at various temperatures to quantify the response of respiration to temperature, . The individual leaves (needles) were carefully removed from the stems to avoid the large contribution the stem would otherwise have made to the CO2 flux thereby confounding the results (e.g. (Heskel et al., 2014)). These needles were weighed to determine the initial fresh mass (g) and then placed in a fine nylon mesh bag, allowing for easy air flow through the bag while keeping the leaves from entering the optical bench of the infrared gas analyzer or becoming lost in the leaf cuvette. The mesh bag containing the leaves was placed inside a custom-made cuvette milled from a solid block of aluminum with a plexiglass lid sealed with a Viton gasket (Patterson et al., 2018; Li et al., 2019; Schmiege et al., 2021)). The cuvette contained a mixing fan and two fine wire thermocouples to measure leaf and air temperatures. Temperature was thermoelectrically controlled from a laptop computer (using a CP-121 Thermoelectric Peltier Cooling Unit, TE Technology, Traverse City, MI USA). The custom cuvette was interfaced with a portable photosynthesis system (Li-6800XT, LiCor, Lincoln, Nebraska USA).
Respiration temperature curves were collected using an LI-6400xt with a modified leaf chamber attached to a temperature controller. Before each measurement, the system was both equilibrated to 5° C and zeroed. The mesh bag holding the leaves was then sealed inside the cuvette and the system was again equilibrated to 5° C. Once stability was reached, the response curve was measured as described in previous studies (O'Sullivan et al., 2013; Heskel et al., 2016; Schmiege et al. 2021). During measurement, the cuvette temperature was ramped continuously from 5° to 65° C at a constant rate of 1° C min-1. All gas exchange variables and calculated rates were recorded every 20 seconds by the Li-6400XT.
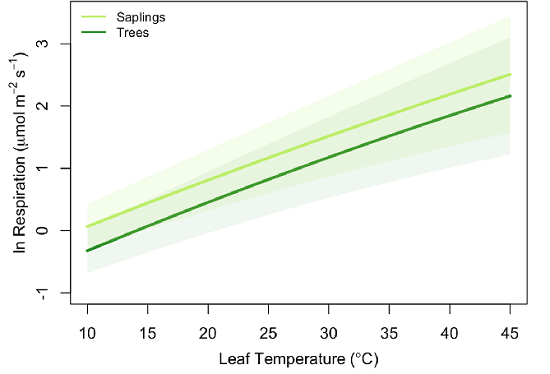
Figure 2. Average model results (log of leaf respiration) for trees (≥ 10 cm DBH – dark green) and saplings (5-10 cm DBH – light green) of Picea glauca growing in the Forest Tundra Ecotone in Alaska. Line presents the mean response (n = 36) and shaded area = 95% confidence interval for size class (Griffin et al., 2021).
Leaf Traits
Upon the completion of the temperature response curve, the leaves were removed from the cuvette and photographed with a known scale. ImageJ software (Schneider et al., 2012) was used to determine the projected area of these needles. The leaves were transferred to coin envelopes and dried at 65° C for a minimum of 48 hours. Dried leaves were again weighed to determine leaf dry mass (g). Specific leaf area (SLA cm2 g-1) was calculated and used to interconvert between area- and mass-based respiratory fluxes. Leaf water content (%) and leaf dry matter content (LDMC) were calculated from the fresh and dry masses. Leaf nitrogen was estimated using the %N measured from these same trees, sampled at the same canopy locations in 2017 (Schmiege et al., unpublished data).
Data Analyses
A simple polynomial model described by Heskel et al. (2016) was used to describe the relationship between temperature and respiration. The model has three coefficients (a, b and c). Estimates of these parameters are provided on both a leaf area and a leaf mass basis. Other derived variables in the dataset include the rate of respiration at 25 °C (on both a leaf area and leaf mass basis) as well as the data needed to convert between the two (specific leaf area and leaf dry matter content).
The respiration-temperature response curves were analyzed as in Heskel et al. (2016) by fitting a second-order polynomial model to the log transformed respiration rates [Ln(R)] between 10° and 45° C:
Ln(R) = a + bT + cT2,
where a represents the basal respiration rate (y-intercept), and b and c describe the slope and curvature of the response to temperature (T) (Heskel et al., 2016). From these modeled curves, the respiration rate was derived at a common temperature of 25° C (R25). Using the entire data set between 5° and 65° C, the temperature of the maximum respiration rate was extracted (Tmax).
Before statistical analysis, all traits were transformed as necessary to fulfill statistical assumptions of normality. Statistical differences in P. glauca traits between large trees and small saplings including DBH and tree height were assessed using an independent sample t-test. A linear mixed effects model was used to test the main effects of canopy position and tree size on all respiratory parameters (including the polynomial model parameters a, b, and c, area- and mass-based R25, and Tmax) and leaf traits (including SLA, LDMC and %N). This model was used to the incorporate effects of each unique tree as a random effect (using the lme4 and the lmerTest packages; Bates et al., 2015; Kuznetsova et al., 2017, respectively). Finally, model coefficients from the study were compared to those from Heskel et al. (2016) for the Tundra and Boreal biomes, as well as the needle-leaved evergreen (NLEv) plant functional type using the information contained within their Table 1, with an independent sample t-test. For all analyses, statistical significance was assessed using a p-value of 0.05.
Refer to Griffin et al. (2021, 2022) for additional details.
Data Access
These data are available through the Oak Ridge National Laboratory (ORNL) Distributed Active Archive Center (DAAC).
Spruce Leaf, Tree Traits, and Respiration at Range Extremes, AK and NY, USA, 2018
Contact for Data Center Access Information:
- E-mail: uso@daac.ornl.gov
- Telephone: +1 (865) 241-3952
References
Bates, D., M. Mächler, B. Bolker, and S. Walker. 2015. Fitting linear mixed-effects models using lme4. Journal of Statistical Software 67:1–48. https://doi.org/10.18637/jss.v067.i01
Eitel, J., A.J. Maguire, K. Griffin, N. Boelman, J.E. Jensen, S.C. Schmiege, and L. Vierling. 2020. ABoVE: Photochemical Reflectance and Tree Growth, Brooks Range, Alaska, 2018-2019. ORNL DAAC, Oak Ridge, Tennessee, USA. https://doi.org/10.3334/ORNLDAAC/1781
Griffin, K.L., Z.M. Griffin, S.C. Schmiege, S.G. Bruner, N.T. Boelman, L.A. Vierling, and J.U.H. Eitel. 2022. Variation in white spruce needle respiration at the species range limits: a potential impediment to Northern expansion. Plant, Cell & Environment 45:2078-2092. https://doi.org/10.1111/pce.14333
Griffin, K.L., S.C. Schmiege, S.G. Bruner, N.T. Boelman, L.A. Vierling, and J.U.H. Eitel. 2021. High leaf respiration rates may limit the success of white spruce saplings growing in the Kampfzone at the Arctic Treeline. Frontiers of Plant Science 12:746464. https://doi.org/10.3389/fpls.2021.746464
Heskel, M.A., O.S. O’Sullivan, P.B. Reich, M.G. Tjoelker, L.K. Weerasinghe, A. Penillard, J.J.G. Egerton, D. Creek, K.J. Bloomfield, J. Xiang, F. Sinca, Z.R. Stangl, A. Martinez-De La Torre, K.L. Griffin, C. Huntingford, V. Hurry, P. Meir, M.H. Turnbull, and O.K. Atkin. 2016. Convergence in the temperature response of leaf respiration across biomes and plant functional types. Proceedings of the National Academy of Sciences of the United States of America 113:3832-3837. https://doi.org/10.1073/pnas.1520282113
Kuznetsova, A., P.B. Brockhoff, and R.H.B. Christensen. 2017. lmerTest package: Tests in linear mixed effects models. Journal of Statistical Software 82:1–26. https://doi.org/10.18637/jss.v082.i13
Li, X.M., C.Y. Xu, Z.Z. Li, J.C. Feng, D.T. Tissue, and K.L. Griffin. 2019. Late growing season carbon subsidy in native gymnosperms in a northern temperate forest. Tree Physiology 39:971–982. https://doi.org/10.1093/treephys/tpz024
Maguire, A.J., J. Eitel, L. Vierling, N. Boelman, K. Griffin, J.S. Jennewein, and J.E. Jensen. 2020. ABoVE: Terrestrial Lidar Scanning Forest-Tundra Ecotone, Brooks Range, Alaska, 2016. ORNL DAAC, Oak Ridge, Tennessee, USA. https://doi.org/10.3334/ORNLDAAC/1782
Maguire, A.J., J. Eitel, K. Griffin, S.C. Schmiege, S.G. Bruner, N. Boelman, and W. Weygint. 2020. ABoVE: Needle-Level Chlorophyll Fluorescence, Alaska and Idaho, USA, 2017 and 2019. ORNL DAAC, Oak Ridge, Tennessee, USA. https://doi.org/10.3334/ORNLDAAC/1785
O’Sullivan, O.S., K. Weerasinghe, J.R. Evans, J.J.G. Egerton, M.G. Tjoelker, and O.K. Atkin. 2013. High-resolution temperature responses of leaf respiration in snow gum (Eucalyptus pauciflora) reveal high-temperature limits to respiratory function. Plant Cell and Environment 36:1268–1284. https://doi.org/10.1111/pce.12057
Patterson, A.E., R. Arkebauer, C. Quallo, M.A. Heskel, X.M. Li, N. Boelman, and K.L. Griffin. 2018. Temperature response of respiration and respiratory quotients of 16 co-occurring temperate tree species. Tree Physiology 38:1319–1332. https://doi.org/10.1093/treephys/tpx176
Schmiege, S.C., B.M. Buckley, D.W. Stevenson, M.A. Heskel, T.Q. Cuong, L. Nam, and K.L. Griffin. 2021. Respiratory temperature responses of tropical conifers differ with leaf morphology. Functional Ecology 35:1408-1423. https://doi.org/10.1111/1365-2435.13814
Schneider, C.A., W.S. Rasband, and K.W. Eliceiri. 2012. NIH Image to ImageJ: 25 years of image analysis. Nature Methods 9:671–675. https://doi.org/10.1038/nmeth.2089
Thompson, R.S., K.H. Anderson, and P.J. Bartlein. 1999. Atlas of relations between climatic parameters and distributions of important trees and shrubs in North America: Introduction and conifers. U.S. Geological Survey Report 1650. USGS Publications Warehouse. Accessed 2015-05-12. https://doi.org/10.3133/pp1650AB