Documentation Revision Date: 2020-04-22
Dataset Version: 1
Summary
Burned area was retrieved from combining fire perimeter data from the Alaskan and Canadian Large Fire Databases with surface reflectance and active fire data from the Moderate Resolution Imaging Spectroradiometer (MODIS). Per-pixel carbon consumption was estimated based on a statistical relationship between field estimates of pyrogenic consumption and several environmental variables. To derive the carbon consumption estimates, the approach from AKFED was updated and extended for the period 2001 to 2015. Fire weather variables, temperature and the drought code, complemented remotely sensed tree cover and burn severity as model predictors.
Fire ignition location and timing were extracted from the daily burned area maps. The ignitions were overlaid with the lightning fire perimeters from large fire databases to discriminate between lightning and human ignitions.
There are 90 data files in GeoTIFF format (*.tif), and two compressed shapefiles (*.zip) with this data set.
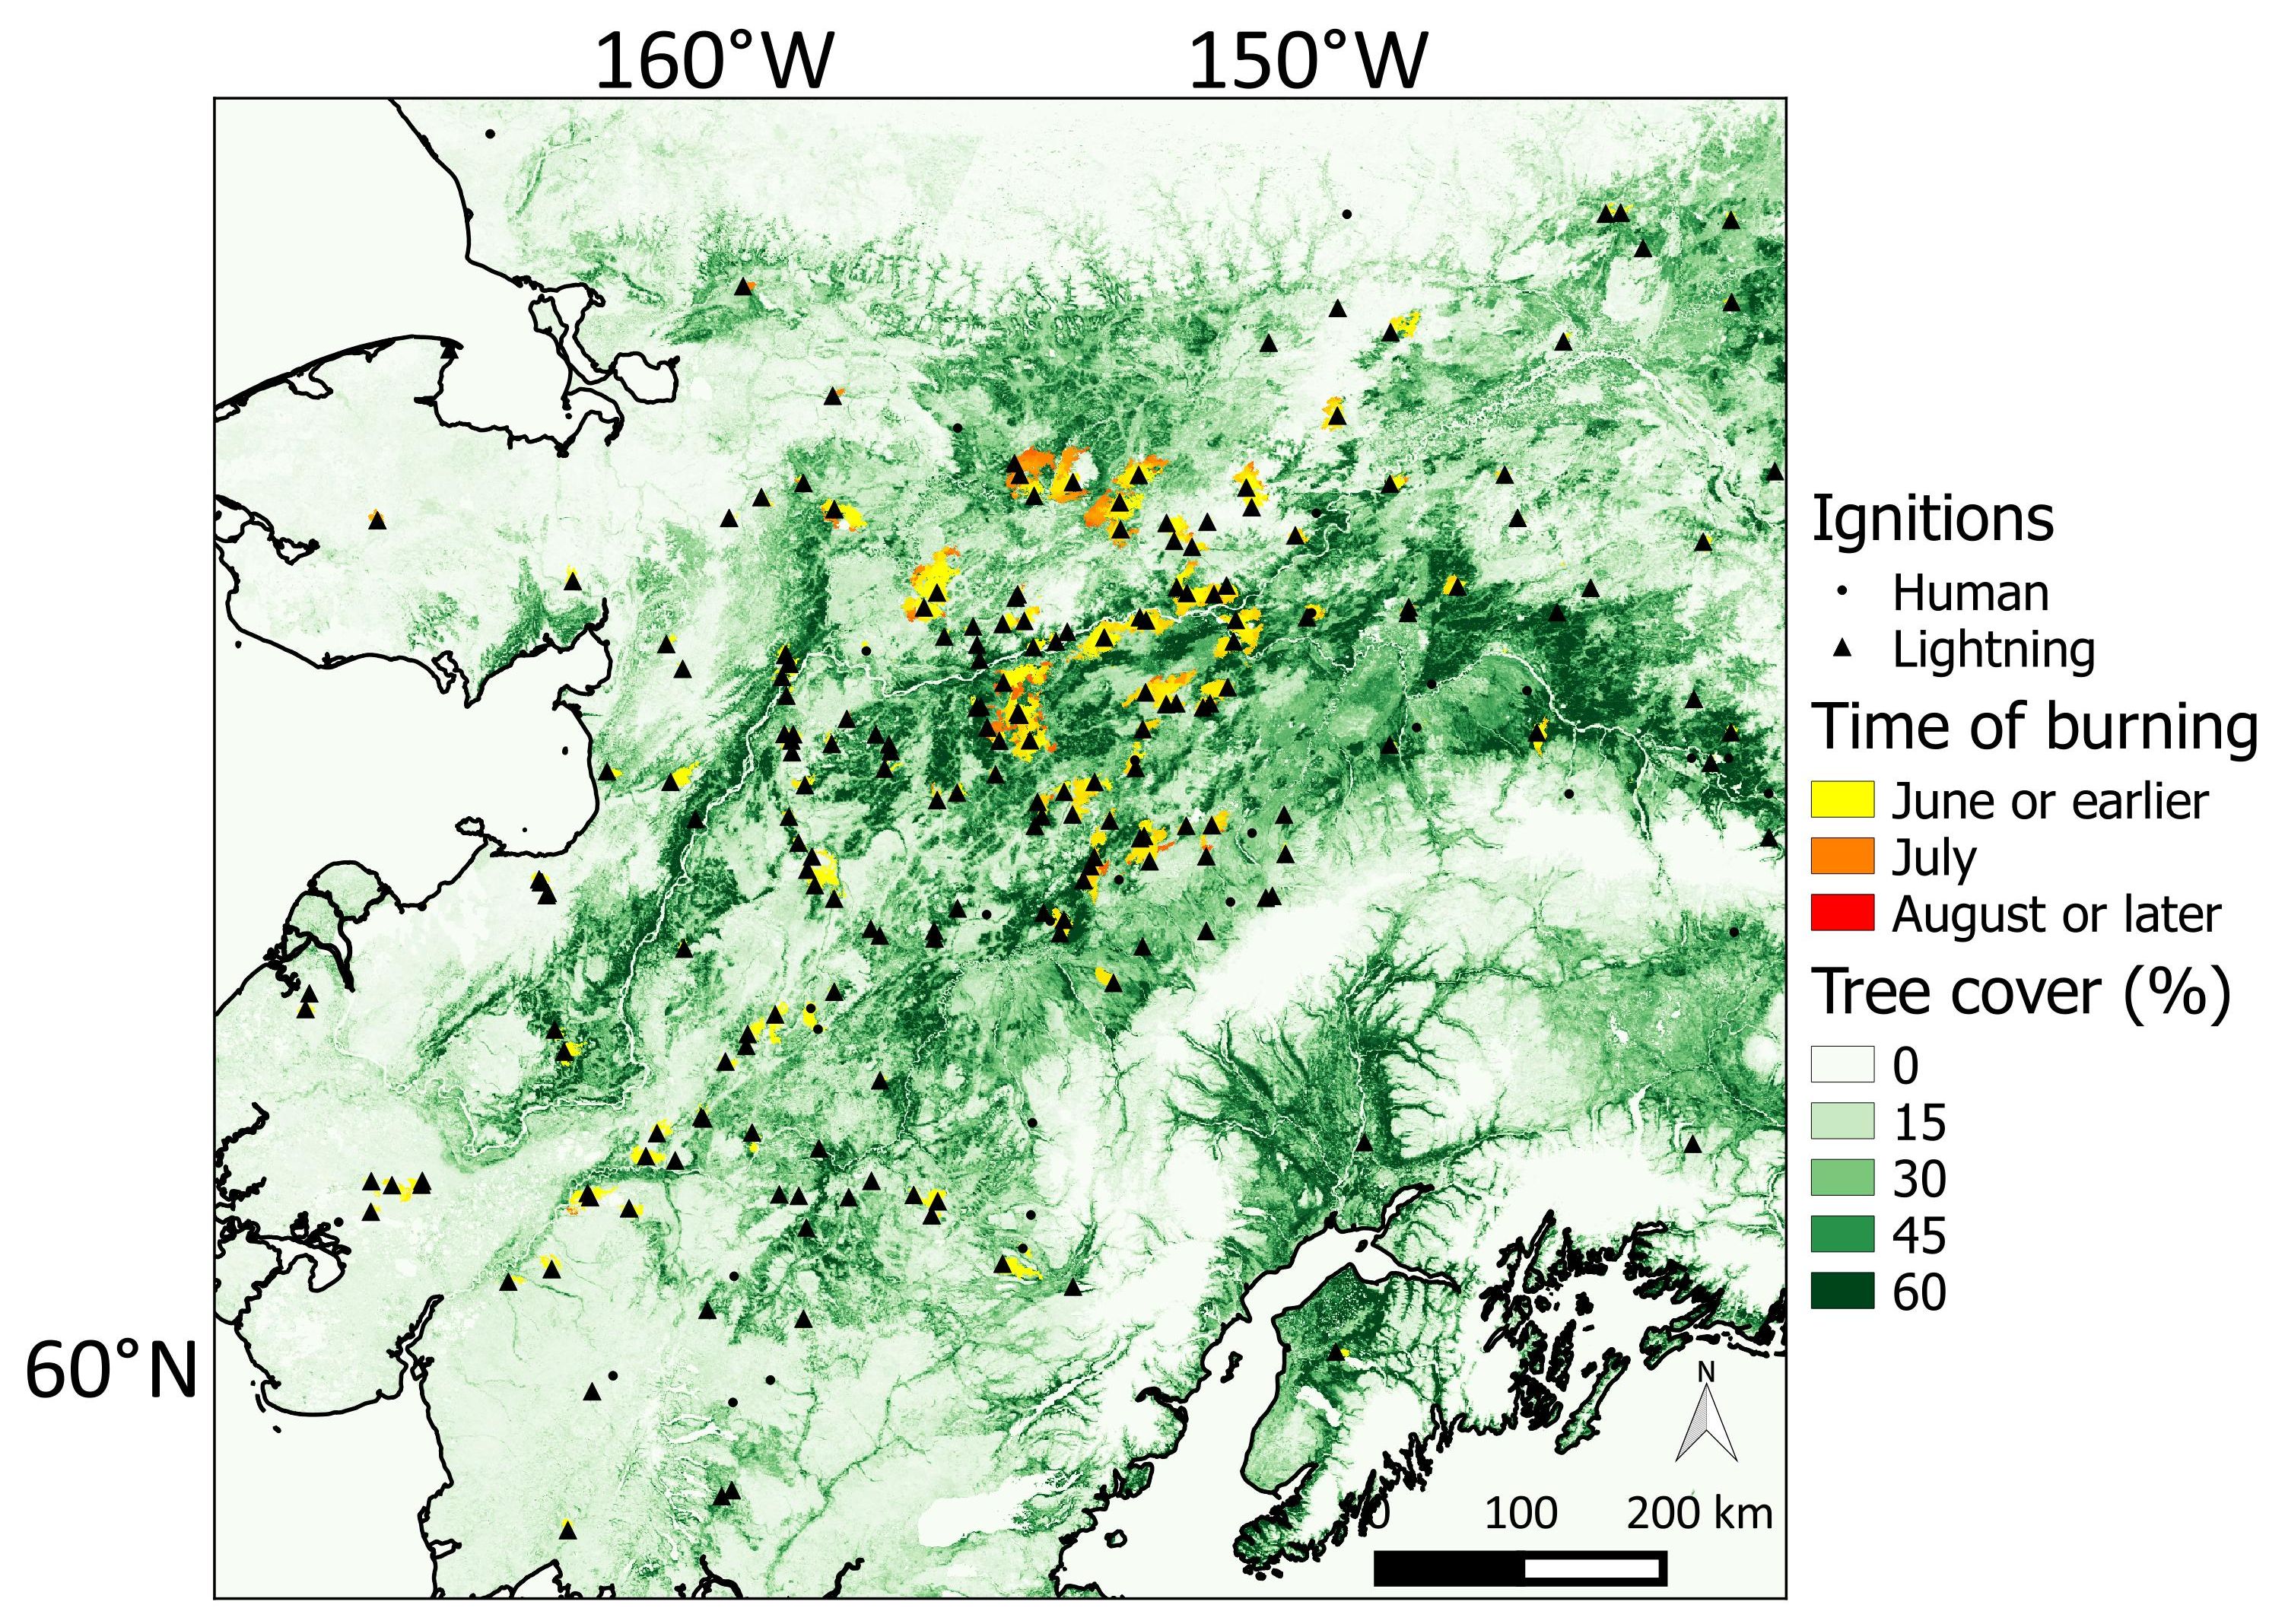
Figure 1. Ignition locations and burned area for Interior Alaska in 2015 (figure from Veraverbeke et al, 2017).
Citation
Veraverbeke, S., B.M. Rogers, M.L. Goulden, R. Jandt, C.E. Miller, E.B. Wiggins, and J.T. Randerson. 2017. ABoVE: Ignitions, burned area and emissions of fires in AK, YT, and NWT, 2001-2015. ORNL DAAC, Oak Ridge, Tennessee, USA. https://doi.org/10.3334/ORNLDAAC/1341
Table of Contents
- Dataset Overview
- Data Characteristics
- Application and Derivation
- Quality Assessment
- Data Acquisition, Materials, and Methods
- Data Access
- References
Dataset Overview
This data set provides estimates of daily burned area, carbon emissions and uncertainty (kg C/m2), and daily fire ignition locations for boreal fires in Alaska, USA, and the Yukon and Northwest Territories, Canada. The data are at 500-m resolution for the period 2001 to 2015.
Burned area was retrieved from combining fire perimeter data from the Alaskan and Canadian Large Fire Databases and surface reflectance and active fire data from the Moderate Resolution Imaging Spectroradiometer (MODIS). Per-pixel carbon consumption was estimated based on a statistical relationship between field estimates of pyrogenic consumption and several environmental variables. To derive the carbon consumption estimates, the approach from AKFED was updated and extended for the period 2001 to 2015. Fire weather variables, temperature and the drought code, complemented remotely sensed tree cover and burn severity as model predictors.
Fire ignition location and timing were extracted from the daily burned area maps. The ignitions were overlaid with the lightning fire perimeters from large fire databases to discriminate between lightning and human ignitions.
Project: ABoVE
The Arctic-Boreal Vulnerability Experiment (ABoVE) is a NASA Terrestrial Ecology Program field campaign taking place in Alaska and western Canada between 2016 and 2021. Climate change in the Arctic and Boreal region is unfolding faster than anywhere else on Earth, resulting in reduced Arctic sea ice, thawing of permafrost soils, decomposition of long-frozen organic matter, widespread changes to lakes, rivers, coastlines, and alterations of ecosystem structure and function. ABoVE seeks a better understanding of the vulnerability and resilience of ecosystems and society to this changing environment.
Related Publication:
Veraverbeke, S., Rogers, B., Goulden, M. et al. Lightning as a major driver of recent large fire years in North American boreal forests. Nature Clim Change 7, 529–534 (2017). https://doi.org/10.1038/nclimate3329
Related Data Set:
Veraverbeke, S., B.M. Rogers, and J.T. Randerson. 2015. CARVE: Alaskan Fire Emissions Database (AKFED), 2001-2013. ORNL DAAC, Oak Ridge, Tennessee, USA. http://dx.doi.org/10.3334/ORNLDAAC/1282
Data Characteristics
Spatial Coverage: Alaska, USA, and the Yukon and Northwest Territories, Canada
ABoVE Reference Locations:
Domain: Core ABoVE
State/territory: Alaska, Yukon, and the Northwest Territories, Canada
Grid cell(s): Ah0v0, Ah1v0, Ah1v1, Ah2v1
Spatial Resolution: 500 m
Temporal Coverage: 20010101 to 20151231
Temporal Resolution: Annual
Study Area (coordinates in decimal degrees)
| Site | Westernmost Longitude | Easternmost Longitude | Northernmost Latitude | Southernmost Latitude |
|---|---|---|---|---|
| Alaska, Yukon and Northwest Territories, Canada | -176.93 | -99.99 | 75.74 | 59.99 |
Data File Information
There are 90 data files in GeoTIFF format (*.tif), and two shapefiles (*.shp) with this data set. The shapefiles are compressed into two *.zip files.
GeoTIFF File naming conventions:
Carbon consumption files are named Carbon_consumption_year_region.tif
Uncertainty in carbon consumption files are named Carbon_uncertainty_year_region.tif
Day of burning files are named fire_DOY_year_region.tif
Where:
year is 2001 - 2015, and
region is AK for Alaska or YTNT for Yukon and the Northwest Territories.
Example file names:
Carbon_consumption_2001_AK.tif
Carbon_uncertainty_2012_YTNT.tif
Data Descriptions: GeoTIFF (.tif) files
Table 1. File names and descriptions.
| File Name | Units | Description |
|---|---|---|
| Carbon_consumption_year_region.tif | kg carbon per m2 | Carbon consumption (emissions) from burning. There are two files for each year (one file for each region- AK and YTNT), for 2001 – 2015 |
| Carbon_uncertainty_year_region.tif | kg carbon per m2 | Carbon consumption (emissions) uncertainty files. There are two files for each year (one file for each region- AK and YTNT), for 2001 – 2015 |
| fire_DOY_year_region.tif | Day of the year (local solar time) | Day of burning. There are two files for each year (one file for each region- AK and YTNT), for 2001 – 2015 |
Spatial Properties and Attributes
Table 2. Attributes of the GeoTIFF files.
| File Names | No Data Value | Data Type | Number of Bands | Spatial Properties |
|---|---|---|---|---|
| Alaska files |
There are no missing values for carbon consumption files. For ‘fire_DOY_year_region.tif', the no data value is 0. |
float | 1 | Geographic Coordinate Reference: NAD83 Projection: Albers Conical Equal Area PROJCS: NAD83 / Alaska Albers |
| Yukon and Northwest Territories files |
There are no missing values for carbon consumption files. For ‘fire_DOY_year_region.tif', the no data value is 0. |
float | 1 | Geographic Coordinate Reference: NAD83 Projection: Albers Conical Equal Area PROJCS: NAD83 / Albers unnamed (Canada) |
Table 3. Geographic extent of the GeoTIFF files.
| Region | North | South | East | West |
|---|---|---|---|---|
|
Alaska |
70.93194 | 57.84722 | -133.23722 | -176.93194 |
|
Yukon and Northwest Territories |
75.74555 | 54.305 | -99.99972 | -154.62694 |
Data Descriptions: Shapefiles (.shp)
Table 4. File names and descriptions.
| File Name | Description |
|---|---|
| Ignitions_20012015_AK.zip |
When unzipped, this shapefile shows the daily fire ignition locations in Alaska |
| Ignitions_20012015_YTNT.zip | When unzipped, this shapefile shows the daily fire ignition locations in Yukon and the Northwest Territories |
Spatial Properties and Attributes
Table 5. The attribute names and descriptions in the shapefiles
| Attribute Name | Description |
|---|---|
| Year | Year of ignition |
| DOY | Day of year of ignition (in local solar time) |
| Light | Lightning-origin (value of 1 for lightning, value of 0 for non-lightning) |
| Xc | X coordinate of Albers equal area projection |
| Yc | Y coordinate of Albers equal area projection |
Table 6. Spatial properties of the shapefiles
| Shapefile Name | Geographic Coordinate System and Datum | North | South | East | West |
|---|---|---|---|---|---|
| Ignitions_20012015_AK |
GCS_WGS_1984; D_WGS_1984 |
70.31897 | 58.92562 | -140.98765 | -165.88441 |
| Ignitions_20012015_YTNT | GCS_WGS_1984; D_WGS_1984 | 69.60258 | 59.99182 | -102.03520 | -141.08621 |
Application and Derivation
Databases of burned area and emissions with high spatial and temporal resolution are a necessity to advance several related fields in biogeosciences. These data could be used is climate models and for predicting future fire regimes that will result from changes in fire weather, vegetation dynamics, and inherent landscape heterogeneity.
Quality Assessment
The authors did asses the uncertainly in their estimates. Uncertainty in carbon consumption is derived from uncertainties in the regression modeling approach and underlying land cover classifications.
Data Acquisition, Materials, and Methods
Site Characteristics
Fire is the main landscape disturbance in the boreal forest and exerts important controls on carbon and energy fluxes, with positive and negative feedbacks to climate. Ignition is an important control on fire dynamics. The methods and processing described below can be found in Veraverbeke et al. (2017, in review).
Methods
The data provided with this data set were derived from multiple sources including surface reflectance, active fire, and tree cover data from MODIS, weather data, fire perimeters and tree species maps.
Table 7. Data and variables used to derive the burned area and carbon consumption estimates, and lightning and ignition data sources.
| Data | Data Source |
|---|---|
| differenced Normalized Burn Ratio (dNBR) | Derived from MODIS surface reflectance (500 m) |
| Meteorological data | Regional Reanalysis (NARR) archived at the National Climatic Data Center (NCDC). Data obtained included wind speed, air temperature, relative humidity and precipitation |
| Fractional tree species and non-treed vegetation cover data | Beaudoin et al. (2014) and the Fuel Characteristic Classification System |
| Tree cover in boreal forest and across the treeline ecotone | Terra MODIS Vegetation Continuous Fields Collection 5.1 product at 250-m resolution (MOD44B) |
| Fire perimeters | Alaskan and Canadian Large Fire Databases |
| Active fire | Derived from MODIS active fire product (http://modis-fire.umd.edu/index.php ) |
Fire and burned area
Burned area and carbon emissions estimates (since 2001) were derived from an updated version of the AKFED (Veraverbeke et al., 2015a & 2015b) model. The data are at 500-m resolution and based on integrating field, fire perimeter and remote sensing data. Daily burned area was determined by combining fire perimeter data with reflectance and active fire data from the Moderate Resolution Imaging Spectroradiometer (MODIS) (Veraverbeke et al., 2014). A threshold was applied to a burn-sensitive spectral index based on 1-year post-fire reflectance data, the differenced Normalized Burn Ratio (dNBR), within fire perimeters and outside perimeters, but within 1-km of active fire locations (Veraverbeke et al., 2015). The dNBR threshold for discriminating burned and unburned pixels was set at 0.15.
AKFED was updated and extended for the period 2001-2015 by replacing the elevation and day of burning variables with weather variables from NARR.
For each burned pixel, the weather variables were interpolated by applying the inverse distance weighting on the center coordinates from the four closest NARR grid cells. Subsequently, the fire weather indices were calculated from the Canadian Fire Weather Index (CFWI) system.
Carbon consumption
Carbon consumption was calibrated based on relationships between field observations of carbon consumption by fire in black spruce ecosystems and the environmental variables. This approach was extended to include Yukon Territory and the Northwest Territories. To do so, modifications were made to the original model. First, fractional tree species and non-treed vegetation cover data were used from Beaudoin et al. (2014) for the Canadian territories. Fractional cover data were aggregated for black spruce, white spruce, pine, deciduous, tundra-grass-shrubs, and non-vegetated. Second, the Consume 4.2 fuel consumption model was used to estimate consumption in black spruce, white spruce, pine and deciduous ecosystems. As in Veraverbeke et al. 2015, these consumption values were used to estimate consumption in ecosystems other than black spruce, by calculating their consumption relative to consumption in black spruce ecosystems. The consumption module of AKFED was originally driven by tree cover, burn severity, elevation and day of burning in the year as environmental variables. For the non-treed cover classes, the same retrieval as for black spruce was applied since tree cover is accounted for in the model as driving variable.
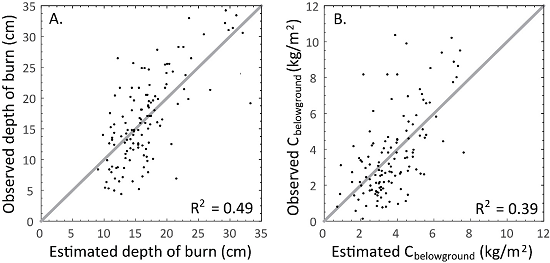
Figure 2. Observed versus estimated (A) depth of burn and (B) belowground carbon consumption (Figure from Veraverbeke et al., 2017).
Uncertainties in carbon consumption within AKFED primarily originate from the unexplained model variance and the underlying land cover classifications. Uncertainties in burned area were propagated in the carbon consumption model to estimate uncertainties in carbon emissions.
Ignition Locations
For the period from 2001 to 2015, ignition location and timing were extracted from the daily burned area maps. A local minimum filter was applied to the day of burning variable within a search radius of 20 km. The location and timing for each local minimum defined ignition points. The ignitions were overlaid with the lightning fire perimeters from the large fire databases to discriminate between lightning and human ignitions. The ignitions that were derived for Interior Alaska with these from the Alaska Interagency Coordination Center (AICC) were compared and 70% of the ignitions points during 2001-2015 fell within three km and three days of the AICC ignition locations. The AICC ignition locations were estimated using local expert knowledge and may have larger temporal and locational uncertainties.
Data Access
These data are available through the Oak Ridge National Laboratory (ORNL) Distributed Active Archive Center (DAAC).
ABoVE: Ignitions, burned area and emissions of fires in AK, YT, and NWT, 2001-2015
Contact for Data Center Access Information:
- E-mail: uso@daac.ornl.gov
- Telephone: +1 (865) 241-3952
References
Beaudoin, A.; Bernier, P.Y.; Guindon, L.; Villemaire, P.; Guo, X.J.; Stinson, G.; Bergeron, T.; Magnussen, S.; Hall, R.J. 2014. Mapping attributes of Canada’s forests at moderate resolution through kNN and MODIS imagery. Can. J. For. Res. 44, 521–532. http://doi.org/10.1139/cjfr-2013-0401
Veraverbeke, S., F. Sedano, S.J. Hook, and B.M. Rogers, 2014. Mapping the daily progression of large wildland fires using MODIS active fire data. International Journal of Wildland Fire, 23(5):655-667. http://doi.org/10.1071/WF13015
Veraverbeke, S. B. M. Rogers, J. T. Randerson. 2015a. Daily burned area and carbon emissions from boreal fires in Alaska. Biogeosciences. 12, 3579–3601. http://doi.org/10.5194/bg-12-3579-2015
Veraverbeke, S., B.M. Rogers, and J.T. Randerson. 2015b. CARVE: Alaskan Fire Emissions Database (AKFED), 2001-2013. ORNL DAAC, Oak Ridge, Tennessee, USA. http://dx.doi.org/10.3334/ORNLDAAC/1282
Veraverbeke, S., Rogers, B., Goulden, M. et al. Lightning as a major driver of recent large fire years in North American boreal forests. Nature Clim Change 7, 529–534 (2017). https://doi.org/10.1038/nclimate3329