Documentation Revision Date: 2022-12-02
Dataset Version: 1
Summary
This dataset contains 164,450 data files. There are 164,448 data files in GeoTIFF (*.tif) format organized by LVIS flightline name. There is one geopackage file (LVIS_ABoVE_spatial_footprints_2017_2019.gpkg) that provides the spatial footprints of the extent of valid data for each 30-m raster flightline from both the 2017 and 2019 campaigns. It is spatially detailed and serves as a spatial index for the grids that are grouped by flightline name. An R script file (lvis_metrics.R) that was used to generate this gridded dataset is also included.
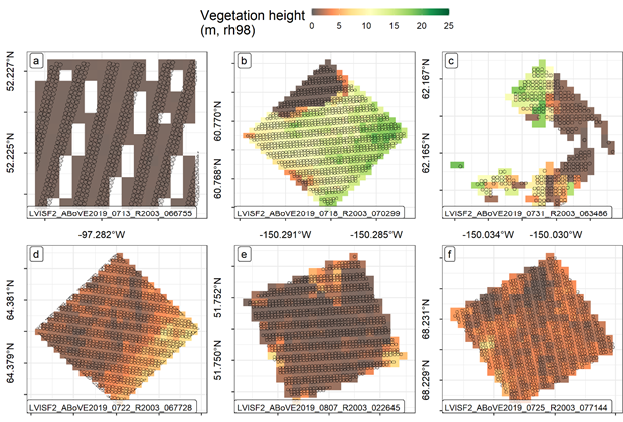
Figure 1. Examples of LVIS-Facility instrument footprint observations with corresponding gridded values of vegetation height estimated by the mean of relative height 98 percentile (RH98) values. These maps depict a mix of forest structures and a variety of lidar footprint sampling densities to illustrate the effect of gridding footprints of various spatial densities. Each map shows the 10-meter diameter LVIS footprint boundaries (open circles) overlaying the 30-meter gridded RH98 estimates. Note: to facilitate plotting, the gridded data shown has been reprojected. As a result, some grid cells do not have corresponding footprints. This is not the case for the gridded data available here, where all grid cells coincide with at least 1 footprint.
Citation
Montesano, P.M., M.J. Macander, and E.E. Hoy. 2022. ABoVE: LVIS L3 Gridded Vegetation Structure across North America, 2017 and 2019. ORNL DAAC, Oak Ridge, Tennessee, USA. https://doi.org/10.3334/ORNLDAAC/1923
Table of Contents
- Dataset Overview
- Data Characteristics
- Application and Derivation
- Quality Assessment
- Data Acquisition, Materials, and Methods
- Data Access
- References
- Dataset Revisions
Dataset Overview
This dataset provides Level 3 (L3) footprint-level gridded metrics and attributes collected from NASA's Land, Vegetation, and Ice Sensor (LVIS)-Facility instrument for each flightline from 2017 and 2019. In 2017, the LVIS-Facility instrument was flown at a nominal flight altitude of 28,000 ft onboard a Dynamic Aviation Super King Air B200T. In 2019, the LVIS-Facility and LVIS-Classic instruments were flown at a nominal flight altitude of 41,000 feet onboard the NASA Gulfstream V. LVIS data are collected as waveforms over footprints of ~10-m diameter. The L3 data include grids of canopy relative height (RH), complexity, canopy cover (CC), ground elevation, and the number of LVIS footprints available to produce a pixel's estimate.. These 30-m resolution grids describe the vertical column of the vegetation canopy in detail with relative canopy height metrics and are enriched with an additional set of canopy cover estimates at a variety of height thresholds. The LVIS-Facility instrument 2017 and 2019 acquisitions span Arctic, boreal, temperate, and sub-tropical landscapes in support of a variety of Arctic-Boreal Vulnerability Experiment (ABoVE)- and Global Ecosystem Dynamics Investigation (GEDI)-related science. In the ABoVE study domain of arctic and boreal Alaska and Western Canada, some of these acquisitions coincide spatially with legacy small-footprint airborne lidar. Data are included for the ABoVE domain and also for the continental U.S. and central America from GEDI. Data files are provided in GeoTIFF format and one geopackage file shows flightlines.
Project: Arctic-Boreal Vulnerability Experiment
The Arctic-Boreal Vulnerability Experiment (ABoVE) is a NASA Terrestrial Ecology Program field campaign based in Alaska and western Canada that started in 2015 and is expected to run for 8 to 10 years. Research for ABoVE links field-based, process-level studies with geospatial data products derived from airborne and satellite sensors, providing a foundation for improving the analysis and modeling capabilities needed to understand and predict ecosystem responses and societal implications.
Related Datasets
Armston, J., H. Tang, S. Hancock, S. Marselis, L. Duncanson, J. Kellner, M. Hofton, J.B. Blair, T. Fatoyinbo, and R.O. Dubayah. 2020. AfriSAR: Gridded Forest Biomass and Canopy Metrics Derived from LVIS, Gabon, 2016. ORNL DAAC, Oak Ridge, Tennessee, USA. https://doi.org/10.3334/ORNLDAAC/1775
Dubayah, R.O., J. Armston, J.R. Kellner, L. Duncanson, S.P. Healey, P.L. Patterson, S. Hancock, H. Tang, J. Bruening, M.A. Hofton, J.B. Blair, and S.B. Luthcke. 2022. GEDI L4A Footprint Level Aboveground Biomass Density, Version 2.1. ORNL DAAC, Oak Ridge, Tennessee, USA. https://doi.org/10.3334/ORNLDAAC/2056
Hurtt, G.C., R.Q. Thomas, J. Fisk, R.O. Dubayah, and S.L. Sheldon. 2016. Canopy Height and Biomass from LiDAR Surveys at La Selva, Costa Rica, 1998 and 2005. ORNL DAAC, Oak Ridge, Tennessee, USA. http://dx.doi.org/10.3334/ORNLDAAC/1312
Related Publication
Montesano, P. M., Neigh, C. S. R., Macander, M. J., Wagner, W., Duncanson, L. I., Wang, P., Sexton, J. O., Miller, C. E., Armstrong, A. H. 2022. Patterns of regional site index across a North American boreal forest gradient, in review.
Acknowledgments
This research was funded by the NASA Carbon Cycle Science Program (NNH16ZDA001N-CARBON) and the NASA Terrestrial Ecology Program (NNH18ZDA001N-TE, grant number 80NSSC19M0112).
Data Characteristics
Spatial Coverage: North and Central America
ABoVE Reference Locations
Domain: Core ABoVE
State/Territory: Alaska
Grid Cells: all “A” cells
Spatial Resolution: 30 m
Temporal Coverage: 2017-06-29 to 2019-08-08
Temporal Resolution: One and two-time estimates with limited extents having multiple collections during a single year
Study Area: All latitude and longitude are given in decimal degrees. These coordinates are the approximate locations of the study sites and may not match the extent of the data files.
| Site | Northern Extent | Southern Extent | Eastern Extent | Western Extent |
|---|---|---|---|---|
| North and Central America | 71.94095 | 9.53161 | -81.87553 | -167.3241 |
Data File Information
This dataset contains 164,450 data files. There are 164,448 data files in GeoTIFF (*.tif) format, one file in geopackage (*.gpkg) format included in this dataset, and an R script file. The GeoTIFF files provide canopy cover estimates (cc), canopy complexity metrics (COMPLEXITY), canopy height metrics (RH), mean, minimum, and maximum terrain elevation (ZG), and the number of footprints per pixel (pt_cnt) (see Table 2).
The GeoTIFF files are named LVISF3_ABoVEYYYY_MMDD_FLIGHTLINE_GRIDNAME_STAT_30m.tif or LVISF3_GEDIYYYY_MMDD_FLIGHTLINE_GRIDNAME_STAT_30m.tif, where:
- YYYY is "2017" or "2019",
- MMDD is the two-digit month and day.
- FLIGHTLINE is the flightline number.
- GRIDNAME is the variable name described in Table 2, and
- STAT is the mean, maximum, minimum, or count described in Table 2.
Table 1. File names and descriptions
| File Name | Number of Files | Description |
|---|---|---|
| LVISF3_ABoVEYYYY_MMDD_FLIGHTLINE_GRIDNAME_STAT_30m.tif | 128,278 2017: 48,346 2019: 79,932 |
2017 and 2019 flights flown over the ABoVE domain. |
| LVISF3_GEDIYYYY_MMDD_FLIGHTLINE_GRIDNAME_STAT_30m.tif | 36,170 | 2019 flights flown over Central America obtained during the GEDI program with the instrument onboard the International Space Station (ISS). |
| LVIS_ABoVE_spatial_footprints_2017_2019.gpkg | 1 | Spatial footprints of the extent of each 30 m raster flightline from both the 2017 and 2019 campaigns. It is spatially detailed and serves as a spatial index for the grids that are grouped by flightline name. |
| lvis_metrics.R | 1 | R Script used to generate this gridded dataset. |
Data File Details
For all GeoTIFF files,
- Projection: Canada Albers Conic Equal Area (EPSG:102001), North American Datum 1983
- Bands: 1
- Scaling factor: 1
- Mapping units: meter
- Missing data values: 65535 for the canopy cover (CC) files, and 255 for all other files
Table 2. Variable names (GRIDNAME) and descriptions for the GeoTIFF files.
| Variable (GRIDNAME) | Rasterization Function (STAT) | Data Type | Description |
|---|---|---|---|
| lvis_pt_cnt | Count | Byte | The count of footprints whose centroids intersected the grid cell (the per-pixel count of the number of LVIS footprints available to produce a pixel's estimate). There is one file per flightline. There are a total of 3,579 files |
| ZG | Minimum, Mean, Maximum | Float32 | The ground surface elevation in meters. There are three files per flightline (mean, maximum, and minimum). The 'mean' was calculated using the mean of the ZG values per pixel, the 'max' using the maximum of the ZG values per pixel, and the 'min' using the minimum of the ZG values per pixel. There are 10,737 ZG files |
| COMPLEXITY | Mean | Float32 | The number of surfaces detected in the waveform. There is one file per flightline for a total of 3,441 files |
| RH<metric_value> Metric_values: 010,015,020,025,030,035,040,045, 050,055,060,065,070,075,080,085,090,095,096,097,098,099,100 | Mean | Float32 | Relative height percentiles of canopy surfaces above the ground, in meters. There are 23 files per flightline for a total of 82,317 files |
| CC_gte_<height_threshold> Height_thresholds: 00p20, 00p30, 00p50, 00p75, 01p00; 01p37, 01p50, 02p00, 03p00, 04p00, 05p00, 06p00, 07p00, 08p00, 09p00, 10p00, 12p00, 15p00 | Mean | Uint16 | The estimated canopy cover at a height greater than or equal to the specified height threshold in meters (e.g., 01p37 = 1.37 m). Values are scaled by 10000; for example 5000 represents a canopy cover of 0.5 or 50%. There are 18 files per flightline for a total of 64,404 files |
Application and Derivation
Boreal forest structure—the height, cover, vertical complexity, and spatial patterns of boreal forests—is a key ecosystem characteristic linked to biogeochemical, biophysical, habitat, and human-environment interactions in the high northern latitudes. These patterns of forest structure reveal important environmental gradients in soil moisture, nutrient availability, permafrost active layer depth, species composition, and carbon accumulation (Montesano et al., 2022 in review).
Quality Assessment
The LVIS-Facility instrument 2017 and 2019 acquisitions span Arctic, boreal, temperate, and sub-tropical landscapes in support of a variety of ABoVE- and GEDI-related science. In the ABoVE study domain of Arctic and boreal Alaska and Western Canada, some of these acquisitions coincide spatially with existing small-footprint discrete return airborne lidar. These legacy data were collected with NASA Goddard's Lidar, Hyperspectral, and Thermal (GLiHT) Imager (Cook et al., 2013; Corp et al., 2015) in Alaska during summer 2014 and 2018. The GLiHT lidar data were published as a suite of data products, including gridded as a canopy height model (CHM) at 1-m resolution, which were resampled to the LVIS L3 30-m grids and converted to a suite of CHM relative height metrics (rhXCHM). These relative heights are those that are greater than X% of the set of 1 m CHM (reference top-of-canopy) pixels whose centroids fall within a given LVISF 30 m grid cell. These rhXCHM values were used to examine the relationship of the many canopy height estimates from reference GLiHT with those from LVIS. The fractional cover estimate (tree_fcover) from the suite of gridded GLiHT products was similarly resampled to provide canopy cover intervals for the comparisons. The rh98 metric from LVIS was most similar to the rh90CHM metric (the 90th percentile of the top-of canopy 1 m pixels) from GLiHT when gridded to match the LVIS L3 30-m grid, and the cc_gte1p37 canopy cover metric was most similar to the tree_fcover metric from GLiHT.
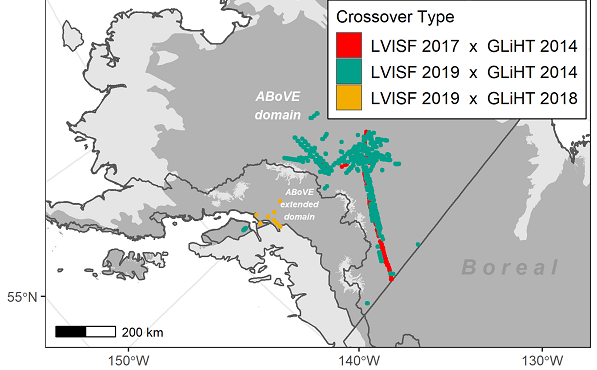
Figure 2. Map of the set of LVISF (LVIS-Facility) and GLiHT crossover locations that are located within the boreal domain. Source: Montesano et al., 2022 in review
Data Acquisition, Materials, and Methods
The LVIS-Facility instrument 2017 and 2019 acquisitions span Arctic, boreal, temperate, and sub-tropical landscapes in support of a variety of ABoVE- and GEDI-related science. During selected 2019 flights, a separate LVIS-Classic instrument was co-mounted and operated together with the LVIS-Facility instrument. These two LVIS instruments differ in the laser footprint size and spacing on the ground. Observations from the LVIS-Classic instrument were not used to generate this LVIS L3 dataset. In the ABoVE study domain of Arctic and boreal Alaska and western Canada, some of these acquisitions coincide spatially with legacy small-footprint discrete return airborne lidar. Across the ABoVE domain, data were collected during the growing season (June–August) of 2017 and 2019 (Blair and Hofton, 1999; Blair et al., 1999; Miller et al., 2019). Legacy data were collected with the NASA GLiHT Imager (Cook et al., 2013; Corp et al., 2015) in Alaska during the growing seasons of 2014 and 2018.
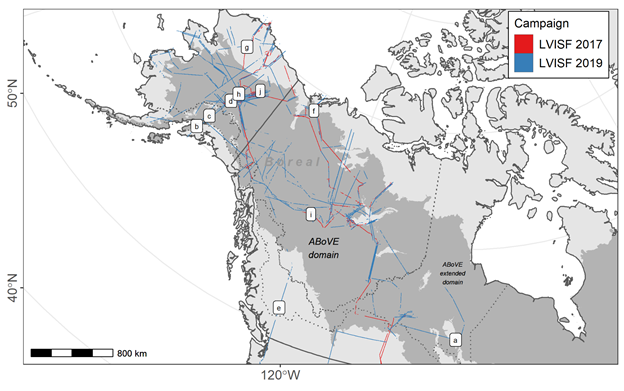
Figure 3. Map of LVISF (LVIS-Facility) 2017 and 2019 flightlines from airborne campaigns across Alaska and western Canada. The marked locations correspond to mapped sites along flightlines that are used as examples to show gridded rh98 estimates. Refer to Figure 1 for example locations a-f (all locations marked in this figure are not provided in Figure 1) (From Montesano et al., 2022 in review).
These lidar waveforms were collected with a 1064 nm wavelength laser from the LVIS-Facility instrument, in nominally 10-m diameter footprints. The flightlines from the 2017 campaign featured swath widths of nominally 1.8 km, while those from 2019 were 2.5 km. The waveforms for the footprints collected in these swaths were processed to "Level 2" as LVIS Facility L2 Geolocated Surface Elevation and Canopy Height Product (Version 1) (Blair and Hofton 2020). The latest version of these data (Version 1) was acquired from the National Snow and Ice Data Center (NSIDC) as ASCII text files of individual flightlines.
Gridding Individual Footprint Estimates of Vegetation Structure
L3 footprint gridded estimates of vegetation structure summarize the vertically continuous lidar waveform. They feature a series of heights of canopy components at statistical percentiles recorded along the vertical distribution of lidar energy returned to the sensor, referenced as heights above a detected 'ground' mode.
For each flightline, the ground latitude and longitude fields were used to assign spatial coordinates to the center of each footprint. Using the "raster" package in R (version 3.6.1), an empty raster grid was initialized to 30 m resolution in the Canada Albers Equal Area Conic projection (EPSG:102001), and this empty raster was used as the base grid to which all other gridded data were aligned. The base grid was aligned to the ABoVE 30 m standard reference grid (Loboda et al., 2019). All footprints with a central coordinate located with a 30-m pixel were included in the estimate for that pixel. The resolution of 30 m represents a trade-off between the higher spatial detail from individual footprints and continuous within-swath mapping of the gridded data for which areas with no-data values were significantly reduced. The greater footprint spacing (lower density) of the 2019 campaign was the result of the higher flight altitude and faster aircraft speed during the acquisition.
Estimating Vegetation Canopy Cover
Estimates of vertical structure are a standard attribute from LVIS L3 footprint observations. In addition to these vertical metrics of vegetation structure, these gridded data include a suite of vegetation canopy cover estimates that characterize a horizontal component of vegetation structure. For each footprint, estimates of canopy cover (CC_gte_<height_threshold>) were calculated as 1.0 minus the lowest relative height metric (a quantile value) whose height value exceeds a height threshold. The result is an estimate of the proportion of the returned energy derived from above a specified height, all of which is assumed to be vegetation canopy. We note that some components of this metric can include signals from the ground return, especially for low height bins (e.g. <1.37 m on flat terrain). Table 2 summarizes the full suite of variables produced for each LVIS flightline. Estimates of canopy cover were made for a suite of height thresholds from 0.2–15.0 m. The height threshold of 1.37 m is conventionally used to discern trees from shrubs.
For each relative height (RH) metric, vertical structure complexity estimate (COMPLEXITY) (Goetz et al., 2010), and ground elevation estimate (ZG) in each flightline, a raster grid was created using the determined extent, and input resolution and rasterization function (‘mean’) and then exported as GeoTIFF. Similarly for each flightline, a grid of the count of contributing footprints (‘count’) was produced. Retrievals over a 30-m pixel will be more reliable when the count of contributing footprints is higher. A ‘min’ and ‘max’ ZG gridded estimate for each cell was also included. Caution should be applied to interpreting the data in cases when the range of ZG values is of a similar magnitude to the RH values, or the CC threshold.
Refer to Montesano et al. 2022 (in review) for additional information.
Data Access
These data are available through the Oak Ridge National Laboratory (ORNL) Distributed Active Archive Center (DAAC).
ABoVE: LVIS L3 Gridded Vegetation Structure across North America, 2017 and 2019
Contact for Data Center Access Information:
- E-mail: uso@daac.ornl.gov
- Telephone: +1 (865) 241-3952
References
Blair, J.B., D.L. Rabine, and M.A. Hofton. 1999. The Laser Vegetation Imaging Sensor: a medium-altitude, digitisation-only, airborne laser altimeter for mapping vegetation and topography. ISPRS Journal of Photogrammetry and Remote Sensing 54:115-122. https://doi.org/10.1016/s0924-2716(99)00002-7
Blair, J.B., and Hofton, M.A. 1999. Modeling laser altimeter return waveforms over complex vegetation using high-resolution elevation data. Geophysical Research Letters 16:2509-2512. https://doi.org/10.1029/1999gl010484
Blair, J.B. and M. Hofton. 2020. LVIS Facility L2 Geolocated Surface Elevation and Canopy Height Product, Version 1. NASA National Snow and Ice Data Center Distributed Active Archive Center, Boulder, Colorado, USA. https://doi.org/10.5067/VP7J20HJQISD
Cook, B.D., L.A. Corp, R.F. Nelson, E.M. Middleton, D.C. Morton, J.T. McCorkel, J.G. Masek, K.J. Ranson, V. Ly, and P. Montansano. 2013. NASA Goddard’s LiDAR, Hyperspectral and Thermal (G-LiHT) Airborne Imager. Remote Sensing 5:4045-4066. https://doi.org/10.3390/rs5084045
Corp, L.A., B.D. Cook, and E.Middleton. 2015. Data products of NASA Goddard’s LiDAR, hyperspectral, and thermal airborne imager (G-LiHT). Proceedings: SPIE 9482, Next-Generation Spectroscopic Technologies VIII, 94821D. https://doi.org/10.1117/12.2177083
Goetz, S.J., D. Steinberg, M.G. Betts, R.T. Holmes, P.J. Doran, R. Dubayah, and M. Hofton. 2010. Lidar remote sensing variables predict breeding habitat of a Neotropical migrant bird. Ecology 91:1569-1576. https://doi.org/10.1890/09-1670.1
Loboda, T.V., E.E. Hoy, and M.L. Carroll. 2019. ABoVE: Study Domain and Standard Reference Grids, Version 2. ORNL DAAC, Oak Ridge, Tennessee, USA. https://doi.org/10.3334/ORNLDAAC/1527
Miller, C.E., P.C. Griffith, S.J. Goetz, E.E. Hoy, N. Pinto, B. McCubbin, A.K. Thorpe, M. Hofton, D. Hodkinson, and C. Hansen. 2019. An overview of ABoVE airborne campaign data acquisitions and science opportunities. Environmental Research Letters 14:080201. https://doi.org/10.1088/1748-9326/ab0d44
Montesano, P. M., Neigh, C. S. R., Macander, M. J., Wagner, W., Duncanson, L. I., Wang, P., Sexton, J. O., Miller, C. E., Armstrong, A. H. 2022. Patterns of regional site index across a North American boreal forest gradient, in review.
Dataset Revisions
On 6/1/2022, 64,404 files were updated to standardize no data values.