Get Data
Summary
This data set provides the results of time-series analyses of Landsat imagery for 55 selected forested sites across the conterminous U.S.A. The output is a pair of disturbance data products for each site, one showing the first year of disturbance in the time series, the other showing the last year of disturbance. Each data pixel is labeled as either a static land class (persistent non-forest, persistent forest, or persistent water) or with the year of change for disturbed forest pixels. The time period analyzed is approximately 1984-2009.
These forest disturbance data are distributed as a single band GeoTiff, with appropriate projection information defined within the file. The analyses were performed in three phases: 5 sites during the Prototype/Focal phase; 23 sites in Phase I; and 27 sites in Phase II. The spatial resolution of the Prototype/Focal and Phase I data is 28.5 meters. The spatial resolution of the Phase II data is 30 meters. The temporal resolution is nominally biennial. The mapped area for each forested site is approximately 185 km x 185 km. There are a total of 110 GeoTiff files – a first year and a last year of disturbance file for each of the 55 sites.
North American Forest Dynamics Project
Within the framework of the North American Carbon Program (NACP), the North American Forest Dynamics (NAFD) project has evaluated forest disturbance and regrowth history for the conterminous U.S. by combining Landsat observations and field measurements (Goward et al. 2008).
The NAFD project uses the Vegetation Change Tracker (VCT), an automated forest change analysis algorithm, on temporally dense (annual or biennial) Landsat Time Series Stack (LTSS) of images and produces forest disturbance data products (Huang et al. 2010). The VCT algorithm was designed specifically for mapping forest change using LTSS. The algorithm consists of two major steps: 1) individual image analysis and 2) time series analysis. VCT produces a disturbance product where each pixel is labeled as either a static land class (persistent non-forest, persistent forest, or persistent water) or with the year of change for disturbed forest pixels.
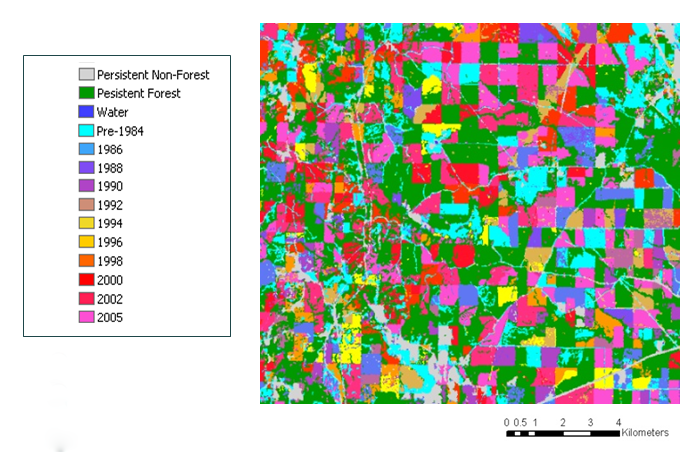
Figure 1: The first year of forest disturbance map for an area in Mississippi ( p21r37 ) where industrial forestry is prevalent. The legend details the map classification system. The first three map categories are static classes which are consistent throughout the time series: persistent non-forest, persistent forest, and water. Forest change pixels are classified according to the year in which change occurred. Actual disturbance year classes vary according to the image dates present in each individual LTSS.
Support Acknowledgment
The NAFD (North American Forest Dynamics) study, a core project of the North American Carbon Program (NACP), is pursued with grant support from the NASA Terrestrial Ecosystems Program and the NASA Applied Sciences Program. High-level preprocessing of the Landsat images using LEDAPS was performed by Teng-Kui Lim of Science Systems and Applications, Inc. (SSAI).
Data and Documentation Access:
Get Data: NACP North American Forest Dynamics Project: Forest Disturbance and Regrowth Data
Description and Links to Companion Files and Supplemental Information:
Companion file of Disturbance Image file characteristics (selected) as shown in Table 1: NAFD_Disturbance_Image_Info.csv
Landsat Project Documentation:
http://landsat.usgs.gov/tools_project_documents.php
LEDAPS Documentation:
http://ledaps.nascom.nasa.gov/
ORNL DAAC Spatial Data Access Tool (SDAT) link:
http://webmap.ornl.gov/wcsdown/index.jsp
Citation:
Cite this data set as follows:
Goward, S.N., C. Huang, J.G. Masek, W.B. Cohen, G.G. Moisen and K. Schleeweis. 2012. NACP North American Forest Dynamics Project: Forest Disturbance and Regrowth Data. ORNL DAAC, Oak Ridge, Tennessee, USA. http://dx.doi.org/10.3334/ORNLDAAC/1077
Requested additional acknowledgment:
Please cite the following publication when these data are used:
Goward, S. N., J. G. Masek, W. Cohen, G. Moisen, G. J. Collatz, S. Healey, R. Houghton, C. Huang, R. Kennedy, B. Law, S. Powell, D. Turner, and M. A. Wulder (2008) Forest disturbance and North American carbon flux. Eos Transactions, 89, 105-116.
Table of Contents:
- 1 Data Set Overview
- 2 Data Description
- 3 Applications and Derivation
- 4 Quality Assessment
- 5 Acquisition Materials and Methods
- 6 Data Archive Access
- 7 References
1. Data Set Overview:
This NAFD data set provides forest disturbance data produced using the VCT algorithm for 55 selected sites, Landsat Time Series Stacks (LTSS) were assembled for each site location (Huang et al. 2009a). Two maps are available for each site, one showing the first year of disturbance in the time series, the other showing the year of the last disturbance. The disturbance data are in GeoTIFF format in Universal Transverse Mercator (UTM), WGS-84 projection, and 28.5-meter resolution (Prototype/Focal and Phase I) and 30 meter resolution (Phase II). The mapped area of each site is approximately 185 km x 185 km.
Spatial Coverage
Sites:NAFD Prototype/Focal, Phase I, and Phase II sample sites over the USFS forest cover type map.
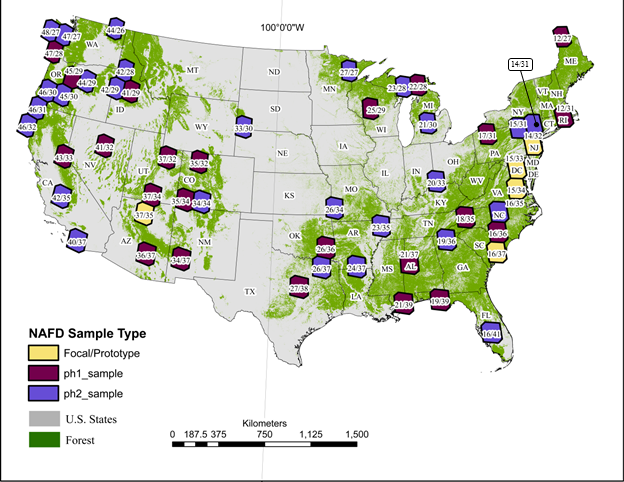
Figure 2. This map shows the location of the Eastern and Western sample sites for which LTSS were assembled. For clearer representation, the sample locations are shown using non-overlapping Thiessen polygon boundaries. The map products for each location cover roughly 185 km2. Site locations are shown over top the Forest Inventory and Analysis (FIA), U.S. Forest Service, forest mask (Ruefenacht et al. 2008).
Site Information
Site locations were derived from a probabilistic sampling scheme designed to estimate national levels of forest disturbance in an eastern and western stratum (Kennedy et al. 2006).
Site names and coordinates are included in Table 1.
Spatial Resolution
The Landsat Spectral Reflectance (SR) images are approximately 185 km x 185 km. The spatial resolution of the scenes is 28.5 meters for Prototype/Focal and Phase I, and 30 meters for Phase II.
Temporal Coverage
The Landsat SR images used in the analyses cover the period from 1984-2009; though vary some with specific location and availability of low cloud cover Landsat data. The selected years of images used for each site analysis are included in Table 1.
Temporal Resolution
Biennial (or more frequent) retrieval of Landsat images.
Data File Description
These forest disturbance maps are distributed as a single band GeoTiff, with appropriate projection information defined within the file. The disturbance data are stored as 8-bit unsigned integer GeoTiffs.
Data File Naming
The primary disturbance map products of the Vegetation Change Tracker (VCT) algorithm are distributed with the following file name syntax:
phaseX_w2pXXrXX_disturbYear_flt__v1_first.tif
phaseX_w2pXXrXX_disturbYear_flt__v1_last.tif
Where:
phaseX indicates that data file is for either a Phase I, Phase II, or Focal/Prototype site (i.e., phase1, phase2, or proto)
pXX gives the path for the source Landsat images
rXX gives the row for the source Landsat images
*_disturbYear_flt__v1_first indicates the file contains data for the year when the first recorded disturbance occurred
and is the first archived version
*_disturbYear_flt__v1_last indicates the file contains data for the year when the last recorded disturbance occurred
and is the first archived version
Disturbance Classification
The *_disturbYear_flt_v1_first.tif data files show the year when the first recorded disturbance occurred. The *_disturbYear_flt_v1_last.tif data files show the year when the last recorded disturbance occurred. If only one disturbance occurred during the observing period, the two layers will have the same value. The persistent land cover classes will have the same values in each of these layers.
The data pixel values are defined as follows:
Classification system:
0 – Background area
1 – Persistent Non-forest
2 – Persistent Forest
4 – Persistent Water
Data values greater than 10 (data pixel value + 1970) indicates year of forest disturbance
Year of forest disturbance is the data value plus 1970. For example, disturbance class 33 was disturbed in 2003.
The first disturbance year in each time series (usually disturbance classes 14 or 15) can best be described as “pre-series disturbance”, as these are pixels that are not forested in the beginning of the time series, but are forested by the end of the series. The date of disturbance is not known, because these are events that occurred prior to the start of the time series. This class should be dealt with in any analysis differently than the subsequent disturbance years.
Data Product Description
The following table lists the site names, the names of disturbance data files distributed in the data set in GeoTiff format, the dates of the Landsat SR images used in the time-series analyses, the projections of the Landsat SR images and the disturbance GeoTiffs, and the data file coordinates (upper left and lower right). The combination of Site Name (Landsat image path and row) and date will lead a user to the unique Landsat image used in these analyses.
Table 1. Site name and disturbance data GeoTiff file descriptions. Latitude and longitude are in decimal degrees.
| Site Name | Distribution Product Filenames | Landsat Input Image Dates (mm/dd/yy) | Image Projection | Image Coordinates: Upper Left and Lower Right (Latitude and Longitude) | |
|---|---|---|---|---|---|
| Phase I Sites | |||||
| p12r27 | phase1_w2p012r027_disturbYear_flt_v1_first.tif phase1_w2p012r027_disturbYear_flt_v1_last.tif | 8/22/07 7/12/04 9/12/03 5/25/01 8/26/00 8/24/99 | 8/21/95 6/15/94 6/7/91 9/8/90 8/1/88 7/27/86 8/9/85 |
WGS84, UTM, Zone 19N | UL: 48.3727, -70.74556 LR: 46.50833, -67.93194 |
| p12r31 | phase1_w2p012r031_disturbYear_flt_v1_first.tif phase1_w2p012r031_disturbYear_flt_v1_last.tif | 9/20/06 8/29/04 6/24/03 9/6/01 9/27/00 6/10/98 |
7/6/96 8/21/95 8/15/93 6/7/91 7/27/89 9/16/87 8/9/85 |
WGS84, UTM, Zone 19N | UL: 42.7116, -72.54222 LR: 40.79639, -70.08472 |
| p16r36 | phase1_w2p016r036_disturbYear_flt_v1_first.tif phase1_w2p016r036_disturbYear_flt_v1_last.tif | 7/27/05 9/24/03 5/24/02 8/14/00 9/26/98 7/2/96 |
9/15/94 9/28/93 5/2/91 10/6/90 9/14/88 9/25/86 7/1/84 | WGS84, UTM, Zone 17N | UL: 35.4913, -80.81333 LR: 33.71167, -78.54222 |
| p17r31 | phase1_w2p017r031_disturbYear_flt_v1_first.tif phase1_w2p017r031_disturbYear_flt_v1_last.tif | 8/6/06 7/2/05 8/16/04 8/3/02 9/6/00 9/12/99 7/12/97 8/26/96 | 6/21/95 10/8/94 5/30/93 6/28/92 7/25/90 7/3/88 7/17/87 8/31/86 6/22/84 | WGS84, UTM, Zone 17N | UL: 42.6269, -80.23722 LR: 40.89806, -77.79639 |
| p18r35 | phase1_w2p018r035_disturbYear_flt_v1_first.tif phase1_w2p018r035_disturbYear_flt_v1_last.tif | 8/7/04 6/2/03 6/9/00 9/11/99 9/5/97 9/13/94 | 7/21/92 6/11/89 8/27/88 6/6/87 9/20/85 9/1/84 | WGS84, UTM, Zone 17N | UL: 36.9827, -83.50833 LR: 35.10167, -81.28806 |
| p19r39 | phase1_w2p019r039_disturbYear_flt_v1_first.tif phase1_w2p019r039_disturbYear_flt_v1_last.tif | 4/27/05 4/22/03 7/16/02 10/14/00 6/27/98 5/20/96 10/9/95 | 7/31/93 6/8/91 4/18/90 6/15/88 4/26/87 4/23/86 6/4/84 | WGS84, UTM, Zone 16N | UL: 31.1863, -86.61 LR: 29.38972, -84.44056 |
| p21r37 | phase1_w2p021r037_disturbYear_flt_v1_first.tif phase1_w2p021r037_disturbYear_flt_v1_last.tif | 10/18/05 6/23/03 9/29/01 9/16/99 8/25/97 6/17/95 | 10/1/93 9/26/91 9/7/90 6/13/88 6/27/87 9/6/84 | WGS84, UTM, Zone 16N | UL: 34.0847, -88.93194 LR: 32.25417, -86.77944 |
| p21r39 | phase1_w2p021r039_disturbYear_flt_v1_first.tif phase1_w2p021r039_disturbYear_flt_v1_last.tif | 10/15/04 10/18/02 10/15/01 8/15/99 8/25/97 10/7/95 |
10/1/93 9/26/91 10/22/89 6/27/87 6/24/86 9/6/84 | WGS84, UTM, Zone 16N | UL: 31.2202, -89.66083 LR: 29.35583, -87.59306 |
| p22r28 | phase1_w2p022r028_disturbYear_flt_v1_first.tif phase1_w2p022r028_disturbYear_flt_v1_last.tif | 8/6/05 7/16/03 8/3/01 9/7/99 7/18/98 8/13/96 |
6/8/95 8/21/93 7/12/90 8/7/88 8/18/86 7/11/84 | WGS84, UTM, Zone 16N | UL: 46.915, -86.57611 LR: 45.11861, -83.915 |
| p25r29 | phase1_w2p025r029_disturbYear_flt_v1_first.tif phase1_w2p025r029_disturbYear_flt_v1_last.tif | 7/10/05 8/22/03 8/8/01 8/29/00 10/6/99 8/5/97 |
9/19/96 8/29/94 9/8/92 9/16/89 9/13/88 7/22/86 9/18/84 | WGS84, UTM, Zone 15N | UL: 45.4744, -91.71167 LR: 43.72861, -89.11861 |
| p26r36 | phase1_w2p026r036_disturbYear_flt_v1_first.tif phase1_w2p026r036_disturbYear_flt_v1_last.tif | 8/31/04 9/11/02 9/29/00 8/18/99 9/29/97 9/10/96 |
7/19/94 7/13/92 7/8/90 6/19/89 8/1/87 7/29/86 | WGS84, UTM, Zone 15N | UL: 35.5591, -96.20333 LR: 33.67778, -94.01694 |
| p27r38 | phase1_w2p027r038_disturbYear_flt_v1_first.tif phase1_w2p027r038_disturbYear_flt_v1_last.tif | 9/13/06 9/7/04 8/1/02 7/21/01 7/24/99 7/18/97 |
9/28/94 7/23/93 8/3/91 10/19/90 9/11/88 9/25/87 8/18/85 |
WGS84, UTM, Zone 14N | UL: 32.6269, -98.55917 LR: 30.86417, -96.37278 |
| p34r37 | phase1_w2p034r037_disturbYear_flt_v1_first.tif phase1_w2p034r037_disturbYear_flt_v1_last.tif | 9/30/06 5/22/05 9/8/04 7/4/03 6/23/02 6/12/01 5/8/00 6/7/99 6/20/98 6/1/97 5/29/96 | 5/27/95 6/25/94 6/22/93 7/5/92 5/16/91 5/13/90 6/11/89 6/8/88 6/22/87 5/18/86 6/16/85 6/13/84 | WGS84, UTM, Zone 13N | UL: 34.1186, -108.99972 LR: 32.22028, -106.84722 |
| p35r32 | phase1_w2p035r032_disturbYear_flt_v1_first.tif phase1_w2p035r032_disturbYear_flt_v1_last.tif | 9/5/06 9/15/04 9/2/02 9/12/00 8/30/98 7/7/96 | 6/16/94 9/30/92 8/11/91 7/4/89 9/3/88 7/28/86 7/6/84 | WGS84, UTM, Zone 13N | UL: 41.2711, -108.50833 LR: 39.35583, -106.11861 |
| p35r34 | phase1_w2p035r034_disturbYear_flt_v1_first.tif phase1_w2p035r034_disturbYear_flt_v1_last.tif | 9/8/07 6/14/05 6/25/03 8/17/02 6/11/01 9/12/00 9/26/99 6/24/97 | 6/5/96 6/16/94 6/18/92 6/21/90 7/4/89 9/19/88 7/28/86 7/6/84 | WGS84, UTM, Zone 12N | UL: 38.3388, -109.37278 LR: 36.59306, -107.03389 |
| p36r37 | phase1_w2p036r037_disturbYear_flt_v1_first.tif phase1_w2p036r037_disturbYear_flt_v1_last.tif | 9/28/06 9/6/04 8/24/02 6/15/00 6/18/98 8/31/96 | 6/23/94 8/4/92 7/1/91 9/13/89 9/26/88 8/20/86 6/14/85 | WGS84, UTM, Zone 12N | UL: 34.0677, -112.05083 LR: 32.25417, -109.88111 |
| p37r32 | phase1_w2p037r032_disturbYear_flt_v1_first.tif phase1_w2p037r032_disturbYear_flt_v1_last.tif | 9/3/06 8/28/04 8/15/02 6/6/00 8/28/98 7/21/96 |
8/17/94 9/15/93 9/26/91 7/2/89 8/30/87 8/8/85 | WGS84, UTM, Zone 12N | UL: 41.2202, -111.57611 LR: 39.47444, -109.18639 |
| p37r34 | phase1_w2p037r034_disturbYear_flt_v1_first.tif phase1_w2p037r034_disturbYear_flt_v1_last.tif | 9/19/06 8/28/04 8/15/02 6/6/00 9/8/99 6/22/97 |
9/21/95 6/27/93 6/22/91 8/27/89 9/15/87 8/24/85 | WGS84, UTM, Zone 12N | UL: 38.3897, -112.4575 LR: 36.55917, -110.1525 |
| p41r29 | phase1_w2p041r029_disturbYear_flt_v1_first.tif phase1_w2p041r029_disturbYear_flt_v1_last.tif | 8/8/04 7/10/02 10/8/00 7/26/99 7/4/97 |
7/31/95 8/10/93 10/8/91 7/14/89 9/11/87 7/16/84 |
WGS84, UTM, Zone 11N | UL: 45.5083, -116.47444 LR: 43.71167, -113.84722 |
| p41r32 | phase1_w2p041r032_disturbYear_flt_v1_first.tif phase1_w2p041r032_disturbYear_flt_v1_last.tif | 8/17/07 7/13/06 7/26/05 6/21/04 6/3/03 6/16/02 6/21/01 6/2/00 7/2/99 8/8/98 7/4/97 |
9/3/96 7/15/95 6/26/94 8/26/93 6/20/92 8/21/91 9/3/90 6/28/89 6/9/88 6/23/87 6/20/86 7/3/85 |
WGS84, UTM, Zone 11N | UL: 41.2202, -117.77944 LR: 39.40667, -115.40667 |
| p43r33 | phase1_w2p043r033_disturbYear_flt_v1_first.tif phase1_w2p043r033_disturbYear_flt_v1_last.tif | 7/24/05 8/6/04 8/20/03 7/16/02 7/21/01 7/18/00 7/24/99 8/3/97 9/1/96 | 8/14/95 8/8/93 8/5/92 7/28/89 7/9/88 7/23/87 8/5/86 7/17/85 6/28/84 | WGS84, UTM, Zone 10N | UL: 39.7625, -121.28806 LR: 38, -118.94889 |
| p45r29 | phase1_w2p045r029_disturbYear_biennial_flt_v1_first.tif phase1_w2p045r029_disturbYear_biennial_flt_v1_last.tif | 8/26/06 8/20/04 8/31/02 9/18/00 8/4/98 7/13/96 |
8/25/94 8/3/92 8/14/90 7/23/88 8/19/86 8/13/84 | WGS84, UTM, Zone 10N | UL: 45.4913, -122.61 LR: 43.71167, -120.03389 |
| p47r28 | phase1_w2p047r028_disturbYear_flt_v1_first.tif phase1_w2p047r028_disturbYear_flt_v1_last.tif | 7/20/05 9/1/03 7/1/01 10/16/99 8/2/98 8/12/96 |
6/23/95 9/21/93 9/16/91 9/10/89 7/21/88 8/1/86 7/13/85 | WGS84, UTM, Zone 10N | UL: 46.9658, -125.18639 LR: 45.06778, -122.55917 |
| Phase II Sites | |||||
| p14r31 | phase2_w2p014r031_disturbYear_flt_v1_first.tif phase2_w2p014r031_disturbYear_flt_v1_last.tif | 8/4/07
7/16/06 6/24/04 6/19/02 8/16/00 7/26/98 |
7/23/97 8/19/95 6/26/93 7/4/90 7/30/88 8/26/86 8/20/84 | WGS84, UTM, Zone 18N | UL: 42.6777, -75.71167 LR: 40.84722, -73.20333 |
| p15r31 | phase2_w2p015r031_disturbYear_flt_v1_first.tif phase2_w2p015r031_disturbYear_flt_v1_last.tif | 7/15/09 7/10/07 6/21/06 9/6/05 7/15/03 7/9/01 7/28/99 6/28/97 | 7/11/96 8/23/94 6/14/92 7/27/90 8/22/88 6/25/87 7/29/85 8/27/84 | WGS84, UTM, Zone 18N | UL: 42.7116, -77.20333 LR: 40.81333, -74.77944 |
| p16r35 | phase2_w2p016r035_disturbYear_flt_v1_first.tif phase2_w2p016r035_disturbYear_flt_v1_last.tif | 7/3/08 8/18/07 7/27/05 9/10/04 8/20/02 8/14/00 7/24/98 |
8/19/96 9/15/94 7/10/93 7/21/91 8/3/90 9/14/88 6/21/86 7/1/84 | WGS84, UTM, Zone 17N | UL: 36.9488, -80.40667 LR: 35.13556, -78.13556 |
| p16r41 | phase2_w2p016r041_disturbYear_flt_v1_first.tif phase2_w2p016r041_disturbYear_flt_v1_last.tif | 7/19/08 7/17/07 6/28/06 7/8/04 8/20/02 8/25/01 8/30/00 6/22/98 |
7/2/96 8/30/94 7/10/93 8/6/91 6/16/90 8/16/89 7/10/87 8/24/86 8/18/84 | WGS84, UTM, Zone 17N | UL: 28.3558, -82.66083 LR: 26.50833, -80.64389 |
| p19r36 | phase2_w2p019r036_disturbYear_flt_v1_first.tif phase2_w2p019r036_disturbYear_flt_v1_last.tif | 7/24/08 7/3/06 7/13/04 8/1/02 7/2/00 6/27/98 7/10/97 | 7/5/95 7/31/93 7/12/92 7/7/90 8/18/88 6/26/86 9/8/84 | WGS84, UTM, Zone 16N | UL: 35.5083, -85.49139 LR: 33.72861, -83.23722 |
| p20r33 | phase2_w2p020r033_disturbYear_flt_v1_first.tif phase2_w2p020r033_disturbYear_flt_v1_last.tif | 8/24/05 9/6/04 7/31/02 6/26/01 7/7/99 7/17/97 |
7/12/95 8/23/93 8/2/91 6/28/90 8/25/88 8/4/86 7/13/84 | WGS84, UTM, Zone 16N | UL: 39.7963, -85.84722 LR: 38, -83.37278 |
| p21r30 | phase2_w2p021r030_disturbYear_flt_v1_first.tif phase2_w2p021r030_disturbYear_flt_v1_last.tif | 7/20/07 7/30/05 6/23/03 8/4/01 7/30/99 7/11/98 7/5/96 | 7/3/95 8/14/93 8/25/91 6/19/90 7/29/87 7/23/85 8/21/84 | WGS84, UTM, Zone 16N | UL: 44.0508, -86.05083 LR: 42.28806, -83.52528 |
| p23r28 | phase2_w2p023r028_disturbYear_flt_v1_first.tif phase2_w2p023r028_disturbYear_flt_v1_last.tif | 8/3/07 7/15/06 7/25/04 7/23/03 7/20/02 7/12/99 8/10/98 | 7/3/96 8/15/94 7/24/92 8/20/90 9/2/89 7/29/88 8/9/86 6/3/85 |
WGS84, UTM, Zone 16N | UL: 46.9488, -88.18639 LR: 45.06778, -85.4575 |
| p23r35 | phase2_w2p023r035_disturbYear_flt_v1_first.tif phase2_w2p023r035_disturbYear_flt_v1_last.tif | 8/5/08 8/3/07 7/31/06 8/10/04 6/21/03 8/2/01 8/29/99 | 8/23/97 8/18/95 7/27/93 8/23/91 7/3/90 8/30/88 7/24/86 7/18/84 | WGS84, UTM, Zone 15N | UL: 36.915, -91.27111 LR: 35.1525, -88.94889 |
| p24r37 | phase2_w2p024r037_disturbYear_flt_v1_first.tif phase2_w2p024r037_disturbYear_flt_v1_last.tif | 8/28/08 8/10/07 9/5/05 8/17/04 9/16/03 8/9/01 8/6/00 8/12/99 | 8/30/97 7/8/95 7/5/94 8/16/92 8/27/90 8/5/88 7/31/86 6/23/84 | WGS84, UTM, Zone 15N | UL: 34.0847, -93.59306 LR: 32.25417, -91.32194 |
| p26r34 | phase2_w2p026r034_disturbYear_flt_v1_first.tif phase2_w2p026r034_disturbYear_flt_v1_last.tif | 8/8/07 8/5/06 8/15/04 7/9/02 8/12/00 7/25/99 8/28/97 | 8/23/95 7/16/93 7/13/92 7/8/90 8/3/88 7/29/86 7/23/84 | WGS84, UTM, Zone 15N | UL: 38.4236, -95.50833 LR: 36.52528, -93.11861 |
| p26r37 | phase2_w2p026r037_disturbYear_flt_v1_first.tif phase2_w2p026r037_disturbYear_flt_v1_last.tif | 7/7/07 8/18/05 7/28/03 7/30/01 8/28/00 8/26/99 8/28/97 |
9/10/96 7/19/94 8/17/93 6/25/91 7/8/90 7/18/88 7/29/86 6/21/84 | WGS84, UTM, Zone 15N | UL: 34.1186, -96.62694 LR: 32.20333, -94.42361 |
| p27r27 | phase2_w2p027r027_disturbYear_flt_v1_first.tif phase2_w2p027r027_disturbYear_flt_v1_last.tif | 8/15/07 7/11/06 7/21/04 9/5/03 7/5/01 7/24/99 8/6/98 7/31/96 | 7/29/95 8/24/93 9/6/92 7/31/90 9/14/89 8/8/87 8/21/86 | 6/28/84 WGS84, UTM, Zone 15N | UL: 48.3727, -93.84722 LR: 46.49139, -91.06778 |
| p33r30 | phase2_w2p033r030_disturbYear_flt_v1_first.tif phase2_w2p033r030_disturbYear_flt_v1_last.tif | 7/24/07 7/2/05 9/1/04 7/10/02 7/12/00 8/19/99 9/1/98 |
8/10/96 8/21/94 8/15/92 7/28/91 8/23/89 7/3/88 8/15/86 8/9/84 | WGS84, UTM, Zone 13N | UL: 44.0508, -104.55917 LR: 42.27111, -102.01694 |
| p34r34 | phase2_w2p034r034_disturbYear_flt_v1_first.tif phase2_w2p034r034_disturbYear_flt_v1_last.tif | 7/15/07 7/12/06 7/6/04 8/10/02 7/19/00 7/1/99 7/3/97 |
8/15/95 6/25/94 7/5/92 7/3/91 7/5/89 6/22/87 8/6/86 8/19/85 | WGS84, UTM, Zone 13N | UL: 38.4236, -107.86417 LR: 36.50833, -105.49139 |
| p40r37 | phase2_w2p040r037_disturbYear_flt_v1_first.tif phase2_w2p040r037_disturbYear_flt_v1_last.tif | 9/16/09 7/27/08 7/6/06 9/2/04 8/28/02 8/22/00 8/1/98 | 8/27/96 7/21/94 8/16/92 8/27/90 7/20/88 7/31/86 6/23/84 | WGS84, UTM, Zone 11N | UL: 34.0847, -118.25417 LR: 32.23722, -116.03389 |
| p42r28 | phase2_w2p042r028_disturbYear_flt_v1_first.tif phase2_w2p042r028_disturbYear_flt_v1_last.tif | 7/25/08 7/20/06 7/30/04 7/9/02 7/27/00 8/15/98 8/9/96 | 7/19/94 8/1/93 7/27/91 7/8/90 8/6/89 8/1/87 6/24/85 | WGS84, UTM, Zone 11N | UL: 46.9319, -117.50833 LR: 45.08472, -114.81333 |
| p42r29 | phase2_w2p042r029_disturbYear_flt_v1_first.tif phase2_w2p042r029_disturbYear_flt_v1_last.tif | 8/24/07 7/20/06 7/30/04 8/2/02 8/28/00 8/31/98 |
8/9/96 7/19/94 7/29/92 7/8/90 8/19/88 7/13/86 7/7/84 | WGS84, UTM, Zone 11N | UL: 45.5422, -117.99972 LR: 43.67778, -115.38972 |
| p42r35 | phase2_w2p042r035_disturbYear_flt_v1_first.tif phase2_w2p042r035_disturbYear_flt_v1_last.tif | 8/10/08 8/5/06 8/31/04 8/18/02 8/12/00 7/14/98 |
9/10/96 8/4/94 7/29/92 8/25/90 8/19/88 7/29/86 7/7/84 | WGS84, UTM, Zone 11N | UL: 37, -120.57611 LR: 35.08472, -118.28806 |
| p44r26 | phase2_w2p044r026_disturbYear_flt_v1_first.tif phase2_w2p044r026_disturbYear_flt_v1_last.tif | 7/7/08 8/19/06 7/28/04 7/15/02 8/2/00 9/9/99 8/10/97 | 8/21/95 9/16/93 7/1/91 7/27/89 7/14/87 8/25/85 9/7/84 | WGS84, UTM, Zone 11N | UL: 49.8302, -119.62694 LR: 47.89806, -116.7625 |
| p44r29 | phase2_w2p044r029_disturbYear_flt_v1_first.tif phase2_w2p044r029_disturbYear_flt_v1_last.tif | 7/5/07 7/18/06 7/28/04 9/9/02 7/25/00 8/13/98 |
7/22/96 8/18/94 8/28/92 9/8/90 7/16/88 8/12/86 7/5/84 | WGS84, UTM, Zone 11N | UL: 45.593, -121.06778 LR: 43.61, -118.47444 |
| p45r30 | phase2_w2p045r030_disturbYear_flt_v1_first.tif phase2_w2p045r030_disturbYear_flt_v1_last.tif | 8/15/08 7/25/06 8/23/05 8/18/03 8/20/01 8/17/00 8/4/98 |
7/13/96 6/25/95 7/5/93 8/1/91 8/11/89 7/7/88 8/19/86 8/13/84 | WGS84, UTM, Zone 10N | UL: 44.0677, -123.10167 LR: 42.25417, -120.57611 |
| p46r30 | phase2_w2p046r030_disturbYear_flt_v1_first.tif phase2_w2p046r030_disturbYear_flt_v1_last.tif | 7/3/07 8/17/06 7/26/04 7/21/02 7/23/00 8/27/98 8/8/97 |
8/3/95 8/29/93 8/10/92 8/8/91 9/3/89 7/30/88 8/10/86 8/4/84 | WGS84, UTM, Zone 10N | UL: 44.1016, -124.69472 LR: 42.22028, -122.08472 |
| p46r31 | phase2_w2p046r031_disturbYear_flt_v1_first.tif phase2_w2p046r031_disturbYear_flt_v1_last.tif | 7/3/07 7/13/05 8/27/04 7/5/02 8/16/00 7/26/98 7/20/96 | 8/16/94 7/9/92 8/8/91 9/3/89 8/31/88 9/11/86 8/4/84 | WGS84, UTM, Zone 10N | UL: 42.6947, -125.08472 LR: 40.81333, -122.61 |
| p46r32 | phase2_w2p046r032_disturbYear_flt_v1_first.tif phase2_w2p046r032_disturbYear_flt_v1_last.tif | 9/5/07 8/17/06 8/27/04 8/6/02 9/9/00 8/27/98 |
7/20/96 8/16/94 7/9/92 8/8/91 9/3/89 7/28/87 6/20/85 | WGS84, UTM, Zone 10N | UL: 41.2711, -125.52528 LR: 39.37278, -123.08472 |
| p47r27 | phase2_w2p047r027_disturbYear_flt_v1_first.tif phase2_w2p047r027_disturbYear_flt_v1_last.tif | 7/10/07 8/5/05 9/1/03 8/13/02v 7/30/00 9/3/98 8/12/96 |
7/22/94 8/4/93 8/15/91 7/11/90 7/21/88 8/1/86 7/13/85 | WGS84, UTM, Zone 10N | UL: 48.3727, -124.72861 LR: 46.49139, -121.98278 |
| p48r27 | phase2_w2p048r027_disturbYear_flt_v1_first.tif phase2_w2p048r027_disturbYear_flt_v1_last.tif |
9/19/07 7/27/05 8/9/04 8/12/02 9/10/01 8/22/00 9/21/99 |
9/2/95 9/9/92 7/5/91 9/20/90 8/27/87 8/8/86 7/4/85 | WGS84, UTM, Zone 10N | UL: 48.4236, -126.33889 LR: 46.4575, -123.55917 |
| Focal – Prototype Sites | |||||
| p14r32 | proto_w2p014r032_disturbYear_flt_v1_first.tif proto_w2p014r032_disturbYear_flt_v1_last.tif | 7/16/06 7/26/04 9/7/02 7/2/01 9/23/99 6/21/97 | 8/19/95 8/29/93 6/21/91 6/28/88 6/10/87 8/23/85 | WGS84, UTM, Zone 18N | UL: 41.2202, -76.08472 LR: 39.42361, -73.67778 |
| p15r33 | proto_w2p015r033_disturbYear_flt_v1_first.tif proto_w2p015r033_disturbYear_flt_v1_last.tif | 9/19/04 9/6/02 7/6/00 8/2/98 7/11/96 8/23/94 |
9/16/91 8/12/90 8/22/88 5/16/87 5/29/86 8/27/84 | WGS84, UTM, Zone 18N | UL: 39.8472, -78.01694 LR: 37.96583, -75.7625 |
| p15r34 | proto_w2p015r034_disturbYear_biennial_flt_v1_first.tif proto_w2p015r034_disturbYear_biennial_flt_v1_last.tif | 8/21/05 8/5/02 10/10/00 5/14/98 10/15/96 8/23/94 | 10/20/92 10/15/90 9/23/88 10/20/86 8/27/84 | WGS84, UTM, Zone 18N | UL: 38.4236, -78.44056 LR: 36.52528, -76.22028 |
| p16r37 | proto_w2p016r037_disturbYear_flt_v1_first.tif proto_w2p016r037_disturbYear_flt_v1_last.tif | 10/15/05 7/19/02 10/9/00 10/23/99 10/12/98 10/22/96 |
9/15/94 10/27/92 10/6/90 10/3/89 9/14/88 9/25/86 9/3/84 | WGS84, UTM, Zone 17N | UL: 34.0677, -81.16944 LR: 32.27111, -79.05083 |
| p37r35 | proto_w2p037r035_disturbYear_flt_v1_first.tif proto_w2p037r035_disturbYear_flt_v1_last.tif | 9/3/06 8/31/05 7/9/03 6/12/02 6/14/00 6/25/98 6/22/97 | 6/14/94 6/27/93 6/22/91 6/19/90 7/2/89 7/26/86 6/21/85 | WGS84, UTM, Zone 12N | UL: 36.9658, -112.86417 LR: 35.10167, -110.57611 |
3. Data Application and Derivation:
Moderate resolution (Landsat type) satellite data provide the only means of constructing spatially-explicit, temporally-detailed disturbance records. The Landsat record provides a unique opportunity for understanding forest disturbance history over the last three decades. The work relies on the use of annual or biennial time series of Landsat time series stacks (LTSS), which may be analyzed at fine spatial scales (~60 m to 100 m), using time series methodologies and validation. The NAFD project uses roughly one Landsat image every year or every two years from 1984 to 2009 for 55 locations across the conterminous US. The primary science goal of the North American Forest Dynamics (NAFD) research is to develop a sound understanding of North American forest disturbance and regrowth during the Landsat era to improve knowledge of the North American Carbon cycle.
4. Quality Assessment:
NAFD developed a method of map validation that uses visual analysis of the Landsat time series along with at least one date of high-resolution aerial photography. This methodology was applied to 6 sites from Phase I and 6 from Phase II.
Design-based accuracy assessment of the disturbance year products revealed that overall accuracies of around 80% were achieved for disturbances mapped at individual year level. Accuracy assessments by forest product users and producers of the disturbance classes averaged around 70% and 60% for 5 of the 6 validation sites, respectively, suggesting that although forest disturbances were typically rare as compared with no-change classes, on average the VCT was able to detect more than half of those disturbances with relatively low levels of false positives. For more in-depth discussion of validation see Thomas et al. (2011).
5. Data Acquisition Materials and Methods:
Overview:
The North American Forest Dynamics (NAFD) project was designed to improve understanding of the carbon budget for North America (Goward et al. 2008).
One of the many goals of this project was to evaluate forest disturbance and regrowth history over the last 20+ years for the conterminous U.S. using
dense Landsat observations. The project was initiated with a prototype study using only a few locations to test the feasibility of compiling and
analyzing time series of Landsat images in conjunction with FIA data. In 2005 NAFD Phase I was funded. To keep the data cost under control, national
estimates of disturbance rates in Phase I were derived using 23 sample sites selected across the conterminous U.S. (Kennedy et al. 2006). Another 27
sample sites were added for phase II using the same sampling methodology to reduce uncertainty in the national estimates. Defined by a path/row tile
of the World Reference System (WRS) (Irish 2000), each sample site had an area of approximately 185 km by 185 km. For each selected site,
a Landsat time series stack (LTSS) was developed and the VCT algorithm was used to evaluate forest disturbance history.
Landsat Imagery:
A Landsat time series stack (LTSS) refers to a sequence of Landsat images acquired at a nominal temporal interval
for a particular WRS path/row tile (Huang et al. 2009a). A LTSS typically consisted of one image approximately every two years.
Selected image dates were constrained to dates during the peak green foliage period, which is typically between early June
and mid-September for the midlatitudes, and low cloud cover when possible. Most selected images were purchased from the USGS
National Center for EROS. The images were processed with high-level preprocessing algorithms, including updated radiometric
calibration for Landsat 5 images, atmospheric adjustment to surface reflectance, precision registration and orthorectification,
in the Landsat Ecosystem Disturbance Adaptive Processing System (LEDAPS) (Masek et al. 2006). The radiometric consistency of
the images in a LTSS was quantitatively assessed by evaluating the variability thru time of stable targets.
Quantitatively Comparing Multi-Temporal Data with VCT:
The Vegetation Change Tracker (VCT) is an automated forest change analysis algorithm. The VCT runs on
temporally dense (annual or biennial) Landsat Time Series Stack (LTSS) of images and produces forest
disturbance map products.
Huang et al. (2010) describe the VCT algorithm in detail. See Figure 3.
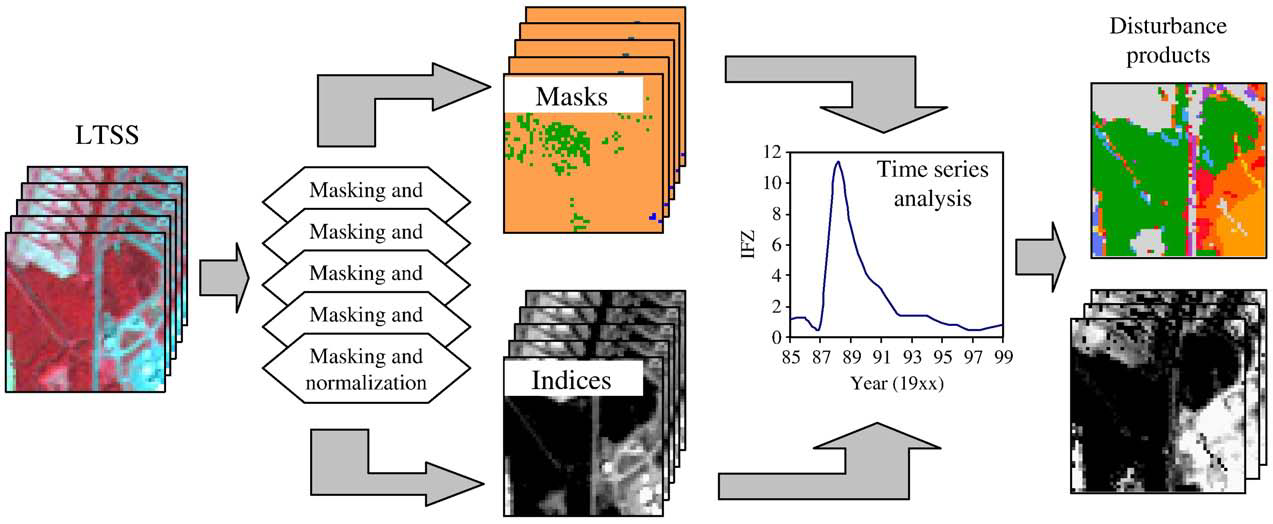
Figure 3: The VCT algorithm uses the spectral-temporal properties of Landsat Time Series Stacks to produce forest disturbance products (from Huang et al.(2010).
This algorithm is based on the spectral–temporal properties of forest, disturbance, and post-disturbance recovery processes. VCT first analyzes each individual image to create masks and spectral indices that measure forest likelihood. It then simultaneously analyzes all images within an LTSS to detect disturbances and uses the spectral trajectory following each disturbance to track post-disturbance processes.
6. Data Archive Access:
This data is available through the Oak Ridge National Laboratory (ORNL) Distributed Active Archive Center (DAAC).
Contact for Data Center Access Information:
E-mail: uso@daac.ornl.gov
Telephone: +1 (865) 241-3952
7. References:
Goward, S. N., J. G. Masek, W. Cohen, G. Moisen, G. J. Collatz, S. Healey, R. Houghton, C. Huang, R. Kennedy, B. Law, S. Powell, D. Turner, and M. A. Wulder (2008)
Forest disturbance and North American carbon flux. Eos Transactions, 89, 105-116.
Huang, C., S. N. Goward, J. G. Masek, F. Gao, E. F. Vermote, N. Thomas, K. Schleeweis, R. E. Kennedy, Z. Zhu, J. C. Eidenshink & J. R. G. Townshend (2009a) Development of Time Series Stacks of Landsat Images for Reconstructing Forest Disturbance History. International Journal of Digital Earth, 195-218.
Huang, C., S. N. Goward, J. G. Masek, N. Thomas, Z. Zhu & J. E. Vogelmann (2010) An automated approach for reconstructing recent forest disturbance history using dense Landsat time series stacks. Remote Sensing of Environment.
Irish, R. R. 2000. Landsat 7 science data user's handbook, Report 430-15-01-003-0 National Aeruonautics and Space Administration. National Aeruonautics and Space Administration.
Kennedy, R. E., W. B. Cohen, G. G. Moisen, S. N. Goward, M. Wulder, S. L. Powell, J. G. Masek, C. Huang & S. P. Healey. 2006. A Sample Design for Landsat-based Estimation of National Trends in Forest Disturbance and Regrowth. In NASA Joint Workship on Biodiversity, Terrestrial Ecology and Related Applied Sciences. College Park, MD.
Masek, J. G., E. F. Vermote, N. E. Saleous, R. Wolfe, F. G. Hall, K. F. Huemmrich, F. Goa, J. Kutler & T. Lim (2006) A Landsat Surface Reflectance Dataset for North America, 1990–2000. IEEE Geoscience and Remote Sensing Letters, 3, 68-72.
Ruefenacht, B., M. V. Finco, M. D. Nelson, R. Czaplewski, E. H. Helmer, J. A. Blackard, G. R. Holden, A. J. Lister, D. Salajanu & K. Weyermann (2008) Conterminous US and Alaska Forest Type Mapping Using Forest Inventory and Analysis Data. Photogrammetric Engineering and Remote Sensing, 74, 1379-1388.
Thomas, N. E., C. Huang, S. N. Goward, S. Powell, K. Rishmawi, K. Schleeweis & A. Hinds (2011) Validation of North American Forest Disturbance dynamics derived from Landsat time series stacks. Remote Sensing of Environment, 115, 19-32.