Get Data
Summary:
This data set includes biophysical measurements collected in 2009 from five New England experimental forest stations: Bartlett Experimental Forest, Harvard Forest, Howland Research Forest, Hubbard Brook Experimental Forest, and the Penobscot Experimental Forest. Howland measurements were repeated in 2010 and one site in the Sierra National Forest, California, was surveyed in 2008.
Biomass in respective measurement plots was calculated with allometric equations using measured diameter at breast height (DBH) for trees greater than 10 cm and species identification. Within selected subplots, the number of stems with diameters less than 10 cm were counted and classified to allow for an estimate of biomass for these stems. There are 16 data files provided that present the biophysical measurement results and the biomass estimates in ASCII comma-separated format.
For a subset of sites and plots (Bartlett Experimental Forest, Harvard Forest and Howland Research Forest), more intensive inventories were done in coordination with Echidna lidar imaging (Strahler et al., 2008). In these intensive collections, the stem location, species, DBH and live/dead status were recorded for all stems with total stem height and canopy dimensions recorded for every tenth stem. In addition, for stems below 10 cm DBH, species and count were recorded in a subplot of each intensive inventory plot. See the related data set Strahler et al., 2011.
Investigators from Federal and university laboratories conducted these field campaigns to make estimates of forest biophysical attributes that will prove useful in comparisons with airborne lidar (LVIS) and UAVSAR remote sensing acquisitions.
The North American Carbon Program (NACP) is a multi-disciplinary research program designed to obtain scientific understanding of North America's carbon sources and sinks and of the changes in carbon stocks needed to meet societal concerns, and to provide tools for decision makers. NACP began in 2002 and continues to date. The NACP data collection contains continental carbon budgets, dynamics, processes, and management of the sources and sinks of carbon dioxide, methane, and carbon monoxide in North America and in adjacent ocean regions.
Data and Documentation Access:
Description and Links to Companion Files and Supplemental Information:
Get Data: NACP New England and Sierra National Forests Biophysical Measurements: 2008-2010
Related Data Sets:
Strahler, A.H., C. Schaaf, C. Woodcock, D. Jupp, D. Culvenor, G. Newnham, R. Dubayah, T. Yao, F. Zhao, X. Yang. 2011. Echidna Lidar Campaigns: Forest Canopy Imagery and Field Data, U.S.A., 2007-2009. ORNL DAAC, Oak Ridge, Tennessee, USA. http://dx.doi.org/10.3334/ORNLDAAC/1045
Data Citation:
Cite this data set as follows:
Cook, B., R. Dubayah, F.G. Hall, R. Nelson, J. Ranson, A.H. Strahler, P. Siqueira, M. Simard, and P. Griffith. 2011. NACP New England and Sierra National Forests Biophysical Measurements: 2008-2010. ORNL DAAC Oak Ridge, Tennessee, USA. http://dx.doi.org/10.3334/ORNLDAAC/1046
Table of Contents:
- 1 Data Set Overview
- 2 Data Characteristics
- 3 Applications and Derivation
- 4 Quality Assessment
- 5 Acquisition Materials and Methods
- 6 Data Access
- 7 References
1. Data Set Overview:
This data set includes biophysical measurements collected in 2009 from five New England experimental forest stations: Bartlett Experimental Forest, Harvard Forest, Howland Research Forest, Hubbard Brook Experimental Forest, and the Penobscot Experimental Forest. Howland measurements were repeated in 2010 and one site in the Sierra National Forest, California, was surveyed in 2008.
Biomass in respective measurement plots was calculated with allometric equations using measured diameter at breast height (DBH) for trees greater than 10 cm and species identification. Within selected subplots, the number of stems with diameters less than 10 cm were counted and classified to allow for an estimate of biomass for these stems.
2. Data Characteristics:
There are 16 data files with the results of the biophysical measurement and the biomass estimates in ASCII comma-separated format. The descriptions are organized by measurement type.
Spatial Coverage
Site boundaries: (All latitude and longitude given in decimal degrees)
These coordinates are the general locations of the experimental forest sites. The measurement plot locations for the New England sites are specifically identified in the Georeference Points Data file. The Sierra National Forest plots are included in Section 5. Measurement subplot coordinates for all sites are included in the Subplot Summary Data file.
| Site (Region) | Westernmost Longitude | Easternmost Longitude | Northernmost Latitude | Southernmost Latitude | Geodetic Datum |
|---|---|---|---|---|---|
| Harvard Forest, Massachusetts, USA | -72.17 | -72.17 | 42.53 | 42.53 | WGS84 |
| Howland Research Forest, Maine, USA | -68.73 | -68.73 | 45.20 | 45.20 | WGS84 |
| Hubbard Brook Experimental Forest, New Hampshire, USA | -71.45 | -71.45 | 43.56 | 43.56 | WGS84 |
| Bartlett Experimental Forest, New Hampshire, USA | -71.16556 | -71.16556 | 44.04417 | 44.04417 | WGS84 |
| Penobscott Experimental Forest, Maine, USA | -68.65056 | -68.65056 | 44.86861 | 44.86861 | WGS84 |
| Sierra National Forest, California, USA | -118.83 | -118.83 | 36.72 | 36.72 | WGS84 |
Site Information
Harvard Forest is an ecological research area of 1,200 ha owned and managed by Harvard University and located in Petersham, Massachusetts. The property, in operation since 1907, includes one of North America's oldest managed forests, educational, and research facilities. The forest stands are in the transition hardwoods - white pine - hemlock zone and are comprised mainly of red oak (Quercus rubra), red maple (Acer rubrum), yellow birch (Betula allleghaniensis), white birch (B. papyrifera), black birch (B. lenta), beech (Fagus grandifolia), white pine (Pinus strobus), and eastern hemlock (Tsuga canadensis). The study plots are located in the Prospect Hill tract. The soils are mainly sandy loam glacial till and are moderately to well drained. The climate is cool, moist temperate. July mean temperature is 20 C and January mean temperature -7 C. The annual mean precipitation of 1,066 mm is distributed fairly evenly throughout the year. Harvard Forest Website: http://HarvardForest.fas.harvard.edu/.
Howland Research Forest is a 558 acre tract of mature, lowland evergreen forest located in central Maine, about 35 miles north of Bangor. The natural stands in this boreal-northern hardwood transitional forest consist of hemlock-spruce-fir, aspen-birch, and hemlock-hardwood mixtures ranging in age from 45 to 130 years. Dominant species composition includes red spruce (Picea rubens), eastern hemlock (Tsuga canadensis ), balsam fir (Abies balsamea), white pine (Pinus strobus), and northern white cedar (Thuja occidentalis). The land was designated as research forest in 1986 by the former owner, International Paper, and was purchased by Northeast Wilderness Trust in 2007, protecting the forest from any future logging activities. The terrain is flat to gently rolling with a maximum elevation of less than 68 m. Soils throughout the forest are glacial tills, acid in reaction, with low fertility and high organic composition. The climate is temperate continental. Howland Research Forest Website: http://HowlandForest.org/.
Bartlett Experimental Forest is a 1,052 ha tract within the U.S. Forest Service, White Mountain National Forest in New Hampshire. Research activities began at the Experimental Forest when it was established in 1931. Bartlett Experimental Forest extends from the village of Bartlett in the Saco River valley at 210 m to about 915 m at its upper reaches. The terrain is rolling to mountainous; aspects across the forest are primarily north and east. The primary forest cover is the sugar maple-beech-yellow birch association. The upper elevations support stands of spruce and fir. There are areas of old-growth northern hardwoods with beech (Fagus grandifolia), yellow birch (Betula allleghaniensis), sugar maple (Acer saccharum), and eastern hemlock (Tsuga canadensis) being the dominant species. Even-aged stands of red maple (Acer rubrum), paper birch (Betula papyrifera), and aspen (Populus tremuloides) occupy sites that were once cleared. Red spruce (Picea rubens) stands cover the highest slopes. Eastern white pine (Pinus strobus) is confined to the lowest elevations. The soils at the Bartlett Experimental Forest are spodosols, developed on glacial till derived from granite and gneiss. The soils are moist but, for the most part, well drained. The climate in the Bartlett area includes warm summers and cold winters with mean January temperatures of 9.8 C and mean July temperatures of 19.8 C. Mean annual precipitation is 1,300 mm, distributed throughout the year. Bartlett Experimental Forest Website: http://www.fs.fed.us/ne/durham/4155/bartlett.htm.
Sierra National Forest encompasses more than 24,000 km2 between 274 m and 4,263 m in elevation on the western slope of the central Sierra Nevada in the state of California. The forest was placed under U.S. Forest Service protection and management in 1893. Distributions of species are largely governed by climate, which is strongly dependent on altitude. The biotic zones include the foothill woodland zone from 300 to 910 m (interior live oak), the lower montane zone from 910 to 2,100 m (yellow pine), the upper montane zone from 2,100 to 2,700 m (lodgepole pine/red fir), the subalpine zone from 2,700 to 2,900 m (whitebark pine), and the alpine zone from 2,900 m (above the tree line). In addition, some 1,550 km2 of the forest are old growth, containing lodgepole pine (Pinus contorta) and red fir (Abies magnifica). Sierra National Forest Website: http://fs.usda.gov/sierra.
Hubbard Brook Experimental Forest is in the southern part of the White Mountain National Forest in central New Hampshire. It lies in the towns of Ellsworth, Thornton, Warren and Woodstock, all in Grafton County, and is near the village of West Thornton. The climate is predominantly continental. The diverse character of the air masses which influence central New Hampshire produces climate which is highly variable from week-to-week, month-to-month and year-to-year. Annual precipitation averages about 1,400 mm, of which about one third to one quarter is snow. The National Forest has mainly deciduous northern hardwoods: sugar maple (Acer saccharum), beech (Fagus grandifolia), and yellow birch (Betula allegheniensis), and some white ash (Fraxinus americana) on the lower and middle slopes. Hubbard Brook Experimental Forest Website: http://www.hubbardbrook.org/.
Penobscot Experimental Forest is located towns of Bradley and Eddington, Maine, across the Penobscot River from Orono and the University of Maine. State Highway 178 parallels the eastern bank of the river and provides access to the Forest. There are presently 46 individual Forest Service research areas comprising about 445 ha (1,100 acres). The climate is cool and humid. The 30 year (1951-1980) normal (i.e. mean annual) temperature for nearby Bangor, Maine, is 43.9 F (6.6 C). February, the coldest month, has an average daily temperature of 19.3 F (7.1 C) while July, the warmest, averages 68.0 F (20.0 C). Normal precipitation is 41.7 inches (1060 mm), with 48 percent falling from May through October. Annual snowfall averages 94 inches (239 cm). Average growing season is 156 days. It is dominated by mixed northern conifers, including eastern hemlock (Tsuga canadensis); spruce, mostly red (Picea rubens) with some white (P. glauca); balsam fir (Abies balsamea); northern white cedar (Thuja occidentalis); eastern white pine (Pinus strobus); and, infrequently, tamarack (Larix laricina) or red pine (P. resinosa). The most common hardwoods are red maple (Acer rubrum); paper birch (Betula papyrifera); gray birch (B. populifolia) and aspen, both quaking (Populus tremuloides) and bigtooth (P. grandidentata). Penobscot Experimental Forest Website: http://www.fs.fed.us/ne/durham/4155/penobsco.htm.
Temporal Coverage
The data set covers the
period 2008/07/16 to 2010/08/31.
Field Measurement Data Descriptions
Large Stem Biometry
The large stem (DBH >10 cm) biometry files contain stem level observations of species identification, live/dead status, diameter at breast height, tree height measurements, and calculations of biomass for the forest sites identified in the file names.
File names:
Bartlett_large_stem_biometry_2009_v3.csv
Harvard_Forest_large_stem_biometry_2009_v3.csv
Howland_large_stem_biometry_2009_v3.1.csv
Howland_large_stem_biometry_2010_v2.csv
Hubbard_Brook_large_stem_biometry_2009_v3.csv
Penobscot_large_stem_biometry_2009_v3.csv
Sierra_Nevada_large_stem_biometry_2008_v3.csv
Data Description:
| Column Name | Units or Format | Description |
|---|---|---|
| Date | yyyy-mm-dd | Date |
| Site | Site identification: Bartlett, Harvard, Howland, Hubbard Brook, Penobscot, Sierra Nevada | |
| Plot_ID | Plot identification | |
| Subplot_ID | Unique identifier for each subplot | |
| Tree_no | Unique identifier for each tree in the subplot | |
| Status | Live or Dead (L or D) | |
| Species | GGSS | Species codes are based on the first two letters of the genus and first two letters of the species. Source: The USDA NRCS PLANTS Database at http://plants.usda.gov/. |
| DBH | cm | Diameter at breast height (DBH)(1.3 m) in centimeters (cm) |
| Height | m | Height in meters (m) |
| Biomass_Jenkins | Mg | Biomass in megagrams (Mg) of identified stems of DBH >= 10 cm calculated according to Jenkins et al. 2004. |
| Notes | Field observations | |
| Biomass_Young | Mg | Biomass in megagrams (Mg) of identified stems of DBH >= 10 cm calculated according to Young et al. 1980 with equations developed specifically for sites in Maine. For species not included in the Young et al. study the Jenkins equations were used. Note this was not calculated for the Sierra sites. |
Example Data Records: (Bartlett_large_stem_biometry_2009_v3.csv)
| Date,Site,Plot_ID,Subplot_ID,Tree_no,Status,Species,DBH,Height,Biomass_Jenkins,Notes,Biomass_Young, yyyy-mm-dd,none,none,none,none,none,GGSS,cm,m,Mg,none,Mg, 2009-07-11,BEF,13L,L1,1,L,TSCA,16.9,-9999,0.088,None,0.0787, 2009-07-11,BEF,13L,L1,2,L,BEAL,28.8,-9999,0.4179,None,0.4097, 2009-07-11,BEF,13L,L1,3,L,TSCA,18.3,-9999,0.1072,None,0.095, ... 2009-07-16,BEF,NACP,R8,30,L,ACRU,15.1,-9999,0.0908,None,0.0808, 2009-07-16,BEF,NACP,R8,31,L,FAGR,13.7,-9999,0.0781,None,0.0826, 2009-07-16,BEF,NACP,R8,32,L,ACRU,13.8,-9999,0.0734,None,0.0652, |
Small Stem Biometry
Small stem (DBH from 3 to 10 cm) biometry files contain stem counts in each diameter category and calculated biomass for the four New England sites where small stem data were collected.
File names:
Bartlett_small_stem_biometry_2009_v3.1.csv
Howland_small_stem_biometry_2009_v3.1.csv
Howland_small_stem_biometry_2010.csv
Hubbard_Brook_small_stem_biometry_2009_v3.1.csv
Penobscot_small_stem_biometry_2009_v3.1.csv
Data Description:
| Column Name | Units or Format | Description |
|---|---|---|
| Site | Site identification: Bartlett, Howland, Hubbard Brook, Penosbscot, no Harvard small stem data | |
| Plot_ID | Plot identification | |
| Subplot_ID | Unique identifier for each subplot | |
| up_to_2_cm | number of stems with DBH between 0 and 2 cm | |
| 2_to_5_cm | number of stems with DBH between 2 and 5 cm | |
| 5_to_8_cm | number of stems with DBH between 5 and 8 cm | |
| 8_to_10_cm | number of stems with DBH between 8 and 10 cm | |
| Biomass_0_2 | Mg per subplot | Biomass in megagrams (Mg) of identified stems with DBH between 0 and 2 cm calculated according to Jenkins et al. 2004. |
| Biomass_2_5 | Mg per subplot | Biomass in megagrams (Mg) of identified stems with DBH between 2 and 5 cm calculated according to Jenkins et al. 2004. |
| Biomass_5_8 | Mg per subplot | Biomass in megagrams (Mg) of identified stems with DBH between 5 and 8 cm calculated according to Jenkins et al. 2004. |
| Biomass_8_10 | Mg per subplot | Biomass in megagrams (Mg) of identified stems with DBH between 8 and 10 cm calculated according to Jenkins et al. 2004. |
Example Data Records: (Bartlett_small_stem_biometry_2009_v3.1.csv)
| Date,Site,Plot_ID,Subplot_ID,up_to_2_cm,2_to_5-cm,5_to_8_cm,8_to10_cm,Biomass_
0_2,Biomass 2_5,Biomass 5_8,Biomass 8_10 yyyy-mm-dd,none,none,none,count,count,count,count,Mg per subplot,Mg per subplot,Mg per subplot,Mg per subplot 2009-07-10,Bartlett,30 AG,-9999,-9999,-9999,-9999,-9999,-9999,-9999,-9999,-9999 2009-07-11,Bartlett,13L,-9999,-9999,-9999,-9999,-9999,-9999,-9999,-9999,-9999 2009-07-12,Bartlett,36 K,-9999,-9999,-9999,-9999,-9999,-9999,-9999,-9999,-9999 ... 2009-07-16,Bartlett,NACP,R6,0,0,2,0,0,0.0038,0,0 2009-07-16,Bartlett,NACP,R7,0,3,2,0,0.0003,0.0038,0,0 2009-07-16,Bartlett,NACP,R8,4,4,0,0,0.0003,0,0,0 |
Crown Data
At the Sierra National Forest and the Penobscot Experimental Forest sites measurements of crown dimensions were collected for select trees. The crown measurement approach was different at each site so separate descriptions and examples are provided.
File names:
Sierra_Nevada_crown_data_2008.csv
Penobscot _crown_data_2009.csv
Data Description: Sierra_Nevada_crown_data_2008.csv
| Column Name | Units or Format | Description |
|---|---|---|
| Date | yyyy-mm-dd | Date |
| Site | Site identification: Sierra Nevada | |
| Plot_ID | Plot identification* | |
| Subplot_ID | Unique identifier for each subplot* | |
| Tree_ID | Unique tree number within each subplot* | |
| Crown_along_slope | m | Crown length in meters (m) along slope |
| Crown_cross_slope | m | Crown length in meters (m) across slope |
| Crown_form | Geometric approximation of crown form (umbrella, cone, truncated ellipsoid, cylinder, ellipse, semi-cylinder, or not identified) | |
| Crown_base | m | Height to base of crown in meters (m) |
| Distance | m | Distance from center of plot to stem in meters (m) |
| Azimuth | decimal degrees | Angle from center of plot to tree |
* Plot_ID, Subplot_ID,and Tree_ID may be cross referenced with the Sierra_Nevada_large_stem_biometry_2008_v3.csv file to obtain tree species.
Example Data Records: Sierra_Nevada_crown_data_2008.csv
|
Date,Site,Plot_ID,Subplot_ID,Tree_ID,Crown_along_slope,Crown_cross_slope,Crown_form,Crown_base,Distance,Azimuth 2008-07-08,Sierra Nevada,23,4,1,-999.9,-999.9,not identified,-9999,12.64,114.1 2008-07-08,Sierra Nevada,23,4,2,-999.9,-999.9,not identified,-9999,13.3,112 2008-07-08,Sierra Nevada,23,4,3,-999.9,-999.9,not identified,-9999,23.53,96.5 ... 2008-07-08,Sierra Nevada,801,9,16,-9999,-9999,not identified,-9999,24.85,163.8 2008-07-08,Sierra Nevada,801,9,17,-9999,-9999,not identified,-9999,37.08,176.3 2008-07-08,Sierra Nevada,801,9,18,-9999,-9999,not identified,-9999,23.03,158.3 |
Data Description: Penobscot _crown_data_2009.csv
| Column Name | Units or Format | Description |
|---|---|---|
| Date | yyyy-mm-dd | Date |
| Site | Site identification: Penobscot | |
| Plot_ID | Plot identification | |
| Subplot_ID | Unique identifier for each subplot | |
| Tree_ID | Unique tree number within each subplot | |
| Status | L or D | Live or dead |
| Species | GGSS | Species codes are based on the first two letters of the genus and first two letters of the species. Source: The USDA NRCS PLANTS Database at http://plants.usda.gov/. |
| DBH | cm | Diameter at breast height (DBH) (1.3 m) in centimeters (cm) |
| Ht_total | m | Height in meters (m) |
| Crown_base_ht | m | Height to base of crown in meters (m) |
| Crown_Radius_1 | m | Radius of crown at widest point in meters (m) |
| Crown_Radius_2 | m | Radius of crown perpendicular to widest point measurement in meters (m) |
| Crown_Radius_3 | m | Radius of crown for irregularly shaped crowns in meters (m) |
Example Data Records: Penobscot _crown_data_2009.csv
| Date,Site,Plot_ID,Subplot_ID,Tree_ID,Status,Species,DBH,Ht_total,Crown_base_ht,Crown_Radius_1,Crown_Radius_2,Crown_Radius_3 2009-08-18,Penobscot,P5,L1,1,L,TSCA,45.6,19.3,4.1,5.9,4,-9999 2009-08-18,Penobscot,P5,L1,7,L,TSCA,48.9,21.1,4.6,4.7,5.4,-9999 2009-08-18,Penobscot,P5,L1,10,L,PIRU,30,20,8.3,3,4.1,-9999 ... 2009-08-21,Penobscot,P11,L2,21,L,TSCA,41.4,21.2,3,4.5,-9999,-9999 2009-08-21,Penobscot,P11,L5,6,L,TSCA,48.2,17.2,4.5,3.5,-9999,-9999 2009-08-21,Penobscot,P11,L5,18,L,BEPA,25,20.9,6.7,4.5,-9999,-9999 |
Subplot Summary Data
The subplot summary file contains calculated biomass totals and stem numbers for all site subplots as well as coordinates for the subplot
locations.
File name: Subplot_summaries_biometry_2008-09_v3.2.1.csv
Data Description:
| Column Name | Units or Format | Description |
|---|---|---|
| Date | yyyy-mm-dd | Date |
| Site | Site identification: Bartlett, Hubbard Brook, Harvard Forest, Penobscot, Howland, Sierra | |
| Plot_ID | Plot identification | |
| Subplot_ID | Unique identifier for each subplot | |
| Plot_notes | Field observations. Note that for several subplots: "No field measurements were made in this subplot. Subplot coordinates are provided." | |
| Large_biomass_Jenkins | Mg per subplot | Total biomass of identified stems of DBH >= 10 cm calculated according to Jenkins et al. 2004 |
| Large_biomass_Young | Mg per subplot | Total biomass of identified stems of DBH >= 10 cm calculated according to Young et al. 1980 with equations developed specifically for sites in Maine. For species not included in the Young et al. study the Jenkins equations were used. Note this was not calculated for the Sierra sites |
| Unidentified_biomass | Mg per subplot | Total biomass of unidentified stems of DBH >= 10 cm calculated according to the equations for mixed hardwoods in Table 1 Jenkins et al. 2004 |
| Small_stem_biomass | Mg per meter squared | Total biomass of stems with DBH <10 cm in a 1 x 25 meter area within the subplot calculated using the mixed hardwoods equation from Table 1 Jenkins et al. 2004 with the midpoint of the diameter class as the DBH times the number of stems in each category |
| Mean_max_height | m | The mean height in meters (m) of the three tallest trees measured in the subplot |
| Ht_no | count | The number of trees included in the mean maximum height calculation |
| Large_stem_no | count | The number of stems with a DBH >= 10 cm in the subplot |
| Small_stem_density | stems per meter squared | The density of stems with a DBH < 10 cm per meter squared based on the 1 x 25 m sampling strip in the subplot |
| Average _slope | degrees | Average slope in the subplot |
| Average_aspect | degrees | Average aspect for the subplot |
| Long_corner_1 | decimal degrees | Longitude for the first corner of the subplot, negative values indicate west |
| Latitude_corner_1 | decimal degrees | Latitude for the first corner of the subplot |
| Long_corner_2 | decimal degrees | Longitude for the second corner of the subplot, negative values indicate west |
| Latitude_corner_2 | decimal degrees | Latitude for the second corner of the subplot |
| Long_corner_3 | decimal degrees | Longitude for the third corner of the subplot, negative values indicate west |
| Latitude_corner_3 | decimal degrees | Latitude for the third corner of the subplot |
| Long_corner_4 | decimal degrees | Longitude for the fourth corner of the subplot, negative values indicate west |
| Latitude_corner_4 | decimal degrees | Latitude for the fourth corner of the subplot |
Example Data Records:
| Date,Site,Plot_ID,Subplot,Plot_notes,Large_biomass_Jenkins,Large_biomass_Young,Unidentified_biomass,Small_stem_biomass, Mean_max_height,Ht_no,Large_stem_no,Small_stem_density,Average_slope,Average_aspect,Long_corner_1,Latitude_corner_1, Long_corner_2,Latitude_corner_2,Long_corner_3,Latitude_corner_3,Long_corner_4,Latitude_corner_4 2009-07-11,Bartlett,13L,R1,None,15.7932,14.3093,0.8309,-9999,30.55, 1,49,-9999,15.7,356,-71.310195,44.052292,-71.310508,44.052285, -71.310516,44.05251,-71.310205,44.052516 2009-07-11,Bartlett,13L,R2,None,12.1901,10.9353,0.5146,-9999,30.65, 1,32,-9999,22.4,331,-71.310204,44.052516,-71.310516,44.05251, -71.310525,44.052735,-71.310213,44.052741 2009-07-11,Bartlett,13L,R3,None,14.8936,13.4735,1.6295,-9999,22.3, 1,39,-9999,-9999,-9999,-71.310213,44.052741,-71.310525,44.052735, -71.310534,44.05296,-71.310222,44.052966 ... 2008-07-08,Sierra,801,7,None,18.2217,-9999,15.3089,-9999, 47.33,3,10,-9999,-9999,-9999,-119.108721,37.021046, -119.109096,37.02104,-119.109104,37.02134,-119.108729,37.021347 2008-07-08,Sierra,801,8,None,166.3889,-9999,6.4815,-9999, 76.73,3,14,-9999,-9999,-9999,-119.108347,37.021053, -119.108721,37.021046,-119.108729,37.021347,-119.108355,37.021353 2008-07-08,Sierra,801,9,None,67.2864,-9999,0,-9999, 52.2,2,18,-9999,-9999,-9999,-119.107972,37.02106, -119.108347,37.021053,-119.108355,37.021353,-119.107981,37.02136 |
Georeference Points Data
The georeference points file provides the coordinates for all measured reference points and estimates of GPS accuracy at the New England sites.
File name:
Georeference_points_field_surveys_2009.csv
Data Description:
| Column Name | Units or Format | Description |
|---|---|---|
| Site | Site identification:
Bartlett, Hubbard Brook, Harvard Forest, Penobscot, Howland | |
| Plot_ID | Plot identification | |
| Point | Location of measurement within plot | |
| Latitude | decimal degrees | Latitude |
| Longitude | decimal degrees | Longitude |
| GPS_error | meters plus or minus | GPS error |
| Bearing | degrees | |
| Notes | Observations |
Example Data Records:
| Site,Plot_ID,Point,Latitude,Longitude,GPS_error,Bearing,Notes none,none,none,decimal degrees,decimal degrees,meters plus or minus,degrees,none Bartlett,36K,NE Corner,44.052408,-71.280991,6,0,None Bartlett,36K,NW Corner,44.052385,-71.281702,5,0,None Bartlett,36K,SE Corner,44.054188,-71.281135,7,0,None ... Howland,11,Center line third point,45.208492,-68.707664,less than 7,-9999,None Howland,11,Center line second point,45.208437,-68.70797,less than 8,-9999,None Howland,11,Center line first point ,45.208385,-68.708278,less than 9,-9999,None |
3. Data Application and Derivation:
Species identification and diameter measurements were used to make estimates of forest biophysical attributes that will prove useful in comparisons with the Laser Vegetation Imaging Sensor (LVIS) (http://lvis.gsfc.nasa.gov) as in Zhao et al. (2011) and the Uninhabited Aerial Vehicle Synthetic Aperture Radar (UAVSAR) (http://uavsar.jpl.nasa.gov/) remote sensing data acquisitions. The transect plots were laid out parallel to the flight paths for UAVSAR remote sensing. Forest types spanned a range of biomass and morphologies that are representative of North American forests.
4. Quality Assessment:
All data have been verified and are final. Estimates of accuracy for the georeference points are included in the Georeference_points_field_surveys_2009.csv data file. Uncertainty estimates of similar measurements in 2007 were estimated and are reported in Yao et al., 2011 and the related data set Strahler et al., 2011.
5. Data Acquisition Materials and Methods:
Plot layout and measurements in the Sierra National Forest 2008
At each location within the Sierra National forest we laid out a 100 m by 100 m plot, which is divided into 9
subplots (3 rows of 3 subplots each). Subplot
corners were estimated by creating a template grid and overlaying this
in the proper
orientation over the existing GPS center points. Coordinates were then
extracted at
the vertices.
In the subplots, we recorded the diameter at breast height (DBH, measured at 1.3 m), tree species (Table 3) and condition (live or dead) for every tree with a DBH greater than or equal to 10 cm. In addition we measured height for 1-2 trees per subplot. In the central subplot, we recorded the distance from the center point to the tree using a sonar or laser rangefinder, the azimuth of the tree from the center point using a sighting compass, and DBH, tree height and crown diameter. Biomass for each stem was calculated in megagrams (Mg) using the general equations from Table 1 of Jenkins et al. 2004 (Table 1). Subplot biomass was summarized.
|
| Sierra National Forest Plot Center Points, 2008
|
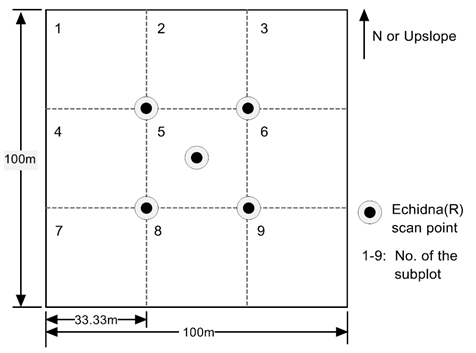
Figure 1. Plot layout and locations in Sierra National Forest 2008
Plot layout and measurements at New England sites in 2009 and 2010
At five well studied sites: Bartlett
Experimental Forest, Harvard Forest, Howland, Hubbard Brook and
Penobscot we laid out a set of 50 m by 200 m plots, each plot is
divided into 16 25 x 25 m subplots (arranged in 8 rows with one subplot
on each side of a central axis). In the subplots, we recorded
the diameter at
breast height (DBH, measured at 1.3 m), tree species (Table 3) and
condition
(live or dead) for every tree with a DBH greater than or equal to 10
cm. In addition we measured height for the three tallest trees in each
subplot.
Biomass for each stem was calculated in megagrams (Mg) using the general equations from Table 1 of Jenkins et al. 2004 (Table 1) and Young et al. 1980 (Table 2) for the New England sites. At four sites (Penobscot, Howland, Bartlett and Hubbard Brook) stems less than 10 cm DBH were counted in a 1 m x 25 m transect along the central plot axis in each subplot. These stems were separated into 4 size classes: 0-2 cm DBH, 2-5 cm DBH, 5-8 cm DBH and 8-10 cm DBH. Stems were not identified to species but total biomass was calculated using the mixed hardwoods equation from Table 1 of Jenkins et al., 2004. Subplot biomass was summarized.
For a subset of sites and plots (Bartlett Experimental Forest, Harvard Forest and Howland Research Forest), more intensive inventories were done in coordination with the Echidna imaging (Strahler et al., 2008). In these intensive collections, the stem location, species, DBH and live/dead status were recorded for all stems with total stem height and canopy dimensions recorded for every tenth stem. In addition, for stems below 10 cm DBH, species and count were recorded in a subplot of each intensive inventory plot.
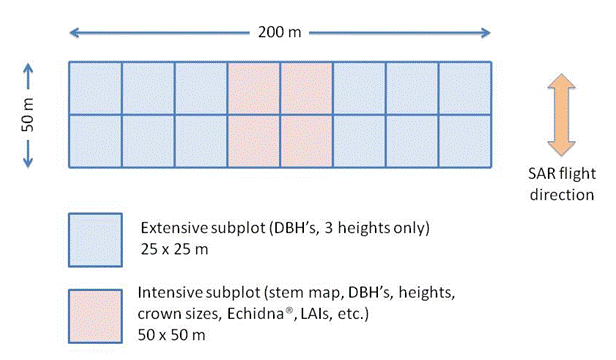
Figure 2. Plot layout at New England Sites.
Georeferencing for Plot Layout at New England Sites
At all sites, handheld GPS units were used to establish the locations of the four corners of the 50 x 200 m transect plot. These data are reported in the Georeference Points data file. Then subplots were delineated using tape measures based on the established points. Subplot coordinates for all sites are included in the Subplot Summary Data file. The number and location of measured georeference points as well as the accuracy of those measurements varied from site to site. At the Howland site GPS measurement errors of +/- 5 to 10 meters were reported due to poor satellite reception. The team used compass bearings and a tape measure in order to establish a more accurately aligned grid. Measurements were collected from most of the nodes, and an ideal sampling grid was fit to these coordinates in a manner that minimized the distance between the nodes and the GPS measurements.
Table 1. Allometric Equations for Biomass Calculations from Jenkins et al. (2004)
| Calculation of stem biomass from Table 1 of Jenkins et al. (2004) | ||
| Allometric equation used: biomass (kg)= Exp(B0 + B1(ln(dbh (cm))) | ||
| Tree/Shrub species | B0 | B1 |
|---|---|---|
| Aspen/alder/willow | -2.2094 | 2.3867 |
| Soft maple/birch | -1.9123 | 2.3651 |
| Mixed hardwood | -2.4800 | 2.4835 |
| Hard maple/oak/beech | -2.0127 | 2.4342 |
| Cedar/larch | -2.0336 | 2.2592 |
| Douglas fir | -2.2304 | 2.4435 |
| True fir/hemlock | -2.5384 | 2.4814 |
| Pine | -2.5356 | 2.4349 |
| Spruce | -2.0773 | 2.3323 |
| Juniper/oak/mesquite | -0.7152 | 1.7029 |
| Jenkins, JC, DC Chojnacky, LS Heath and RA Birdsey. 2004. Comprehensive database of diameter-based biomass regressions for North American tree species. USDA/ Forest Service GTR-319 | ||
Table 2. Allometric Equations for Biomass Calculations from Young et al. (1980)
| Calculation of large stem biomass based on the equations in Young et al. 1980 developed specifically for forests in Maine. | ||
| Calculated only for New England sites. For species not included in these equations, the equations from Jenkins et al. were used to calculate biomass. | ||
| Allometric equations used: ln (lbs)=B0 + B1 (ln(inches dbh)) | ||
| Where kg=lbs*0.4536 and cm=inches*2.54 | ||
| Tree/Shrub species | B0 | B1 |
|---|---|---|
| Spruce | 0.8079 | 2.3316 |
| Balsam fir | 0.5958 | 2.4017 |
| White pine | 0.408 | 2.449 |
| Red pine | 0.7157 | 2.3865 |
| Hemlock | 0.6803 | 2.3617 |
| Northern white cedar | 1.1182 | 1.9269 |
| Larch | 0.8162 | 2.2453 |
| Yellow birch | 1.1297 | 2.3376 |
| White birch | 0.4792 | 2.6634 |
| Beech | 1.3303 | 2.2988 |
| Sugar maple | 1.2451 | 2.3329 |
| Red maple | 0.9392 | 2.3804 |
| Aspen | 0.4689 | 2.6087 |
| Gray birch | 1.0931 | 2.3146 |
| Pin cherry | 0.9758 | 2.1948 |
| Choke cherry | 1.0539 | 1.7102 |
| Willow | 0.8856 | 2.0552 |
| Alder | 0.7164 | 2.2087 |
| Young HE, Ribe JH, Wainwright K (1980) Weight tables for tree and shrub species in Maine. Life Sciences and Agriculture Experiment Station, University of Maine at Orono. Miscellaneous Report 230, 84 pp. | ||
Table 3. Species Code Reference for New England and Sierra National Forests
| Species codes: Codes are based on the first two letters of the genus and first two letters of the species. | |
| The species codes are derived from the USDA NRCS PLANTS Database at http://plants.usda.gov/. The complete list is available for download at http://plants.usda.gov/dl_all.html. | |
| New England Species List | Sierra Species List |
| Code Genus Species Common name | Code Genus Species Common name |
| ABBA Abies balsamea Balsam fir | ABCO Abies concolor White Fir |
| ACPE Acer pennsylvanica Striped maple | ABMA Abies magnifica Red Fir |
| ACRU Acer rubrum Red maple | ACMA Acer macrophyllum Bigleaf maple |
| ACSA Acer saccharum Sugar maple | ALRH Alnus rhombifolia White alder |
| ACSP Acer spicatum Mountain maple | ARSP Arctostaphylos spp. Manzanita species |
| BEAL Betula alleghaniensis Yellow birch | BESP Betula spp. Birch |
| BELE Betula lenta Black birch | CACH Castanopsis chrysophylla Golden chinquapin |
| BEPA Betula papyrifera Paper birch | CONU Cornus nuttallii Mountain dogwood |
| BEPO Betula populifolia Grey birch | FRLA Fraxinus latifolia Oregon ash |
| CADE Castanea dentata American chestnut | JUOC Juniperus occidentalis Western juniper |
| FAGR Fagus grandifolia Beech | LIDE Libocedrus decurrens Incense cedar |
| FRAM Fraxinus americana White ash | PICO Pinus contorta Lodgepole pine |
| FRNI Fraxinus nigra Black ash | PIJE Pinus jeffreyi Jeffrey pine |
| FRPE Fraxinus pennsylvanica Green ash | PILA Pinus lambertiana Sugar Pine |
| LALA Larix laricina Tamarack | PIMO Pinus monticola Western white pine |
| OSVI Ostrya virginiana Eastern hophornbeam | PIPO Pinus ponderosa Ponderosa Pine |
| PIAB Picea abies Norway spruce | PISA Pinus sabiniana Gray pine |
| PIMA Picea mariana Black spruce | POTR Populus tremuloides Quaking aspen |
| PIREPinus resinosa Red pine | PREM Prunus emarginata Bitter cherry |
| PIRU Picea rubens Red spruce | PRSU Prunus subcordata Sierra plum |
| PIST Pinus strobus White pine | PRVI Prunus virginiana Western chokecherry |
| POBA Populus balsamea Balsam poplar | QUCH Quercus chrysolepis Canyon live oak |
| POGR Populus grandidentata Big-toothed aspen | QUKE Quercus kellogii Black oak |
| POTR Populus tremuloides Trembling aspen | SASC Salix scouleriana Scouler's willow |
| PRPE Prunus pennsylvanica Pin cherry | SEGI Sequoiadendron giganteum Giant sequoia |
| PRSE Prunus serotina Black cherry | TOCA Torreya californica California nutmeg |
| QUAL Quercus alba White oak | UNK Unknown |
| QURU Quercus rubra Red oak | |
| QUVE Quercus velutina Black oak | |
| THOC Thuja occidentalis Northern white cedar | |
| TIAM Tilia americana American basswood | |
| TSCA Tsuga canadensis Hemlock | |
| ULAM Ulnus americana Elm | |
| UNK Unknown | |
6. Data Access:
This data set is available through the Oak Ridge National Laboratory (ORNL) Distributed Active Archive Center (DAAC).
Data Archive:
Web Site: http://daac.ornl.gov
Contact for Data Center Access Information:
E-mail: uso@daac.ornl.gov
Telephone: +1 (865) 241-3952
7. References:
Jenkins, JC, DC Chojnacky, LS Heath and RA Birdsey. 2004. Comprehensive database of diameter-based biomass regressions for North American tree species. USDA/ Forest Service GTR-319.
Strahler, A. H., D.L.B. Jupp, C.E. Woodcock, C.B. Schaaf, T. Yao, F. Zhao, X. Yang, J. Lovell, D. Culvenor, G. Newnham, W. Ni-Meister, and W. Boykin-Morris. 2008. Retrieval of forest structural parameters using a ground-based lidar instrument (Echidna®). Can J. Remote Sensing, 34(Suppl. 2): S426-S440.
Strahler, A., C. Schaaf, C. Woodcock, D. Jupp, D. Culvenor, G. Newnham, R. Dubayah, T. Yao, F. Zhao, X. Yang. 2011. ECHIDNA Lidar Campaigns: Forest Canopy Imagery and Field Data, U.S.A., 2007-2009. Data set. Available on-line [http://daac.ornl.gov] from Oak Ridge National Laboratory Distributed Active Archive Center, Oak Ridge, Tennessee, U.S.A. doi:10.3334/ORNLDAAC/1045
Yao, T., et al., Measuring forest structure and biomass in New England forest stands using Echidna ground-basedlidar, Remote Sensing of Environment (2011), doi:10.1016/j.rse.2010.03.019
Young HE, Ribe JH, Wainwright K (1980) Weight tables for tree and shrub species in Maine. Life Sciences and Agriculture Experiment Station, University of Maine at Orono. Miscellaneous Report 230, 84 pp.
Zhao, F., et al., Measuring effective leaf area index, foliage profile, and stand height in New England forest stands using a full-waveform ground-based lidar, Remote Sensing of Environment (2011), doi:10.1016/j.rse.2010.08.030